Forex Dashboard
Uzair Patel
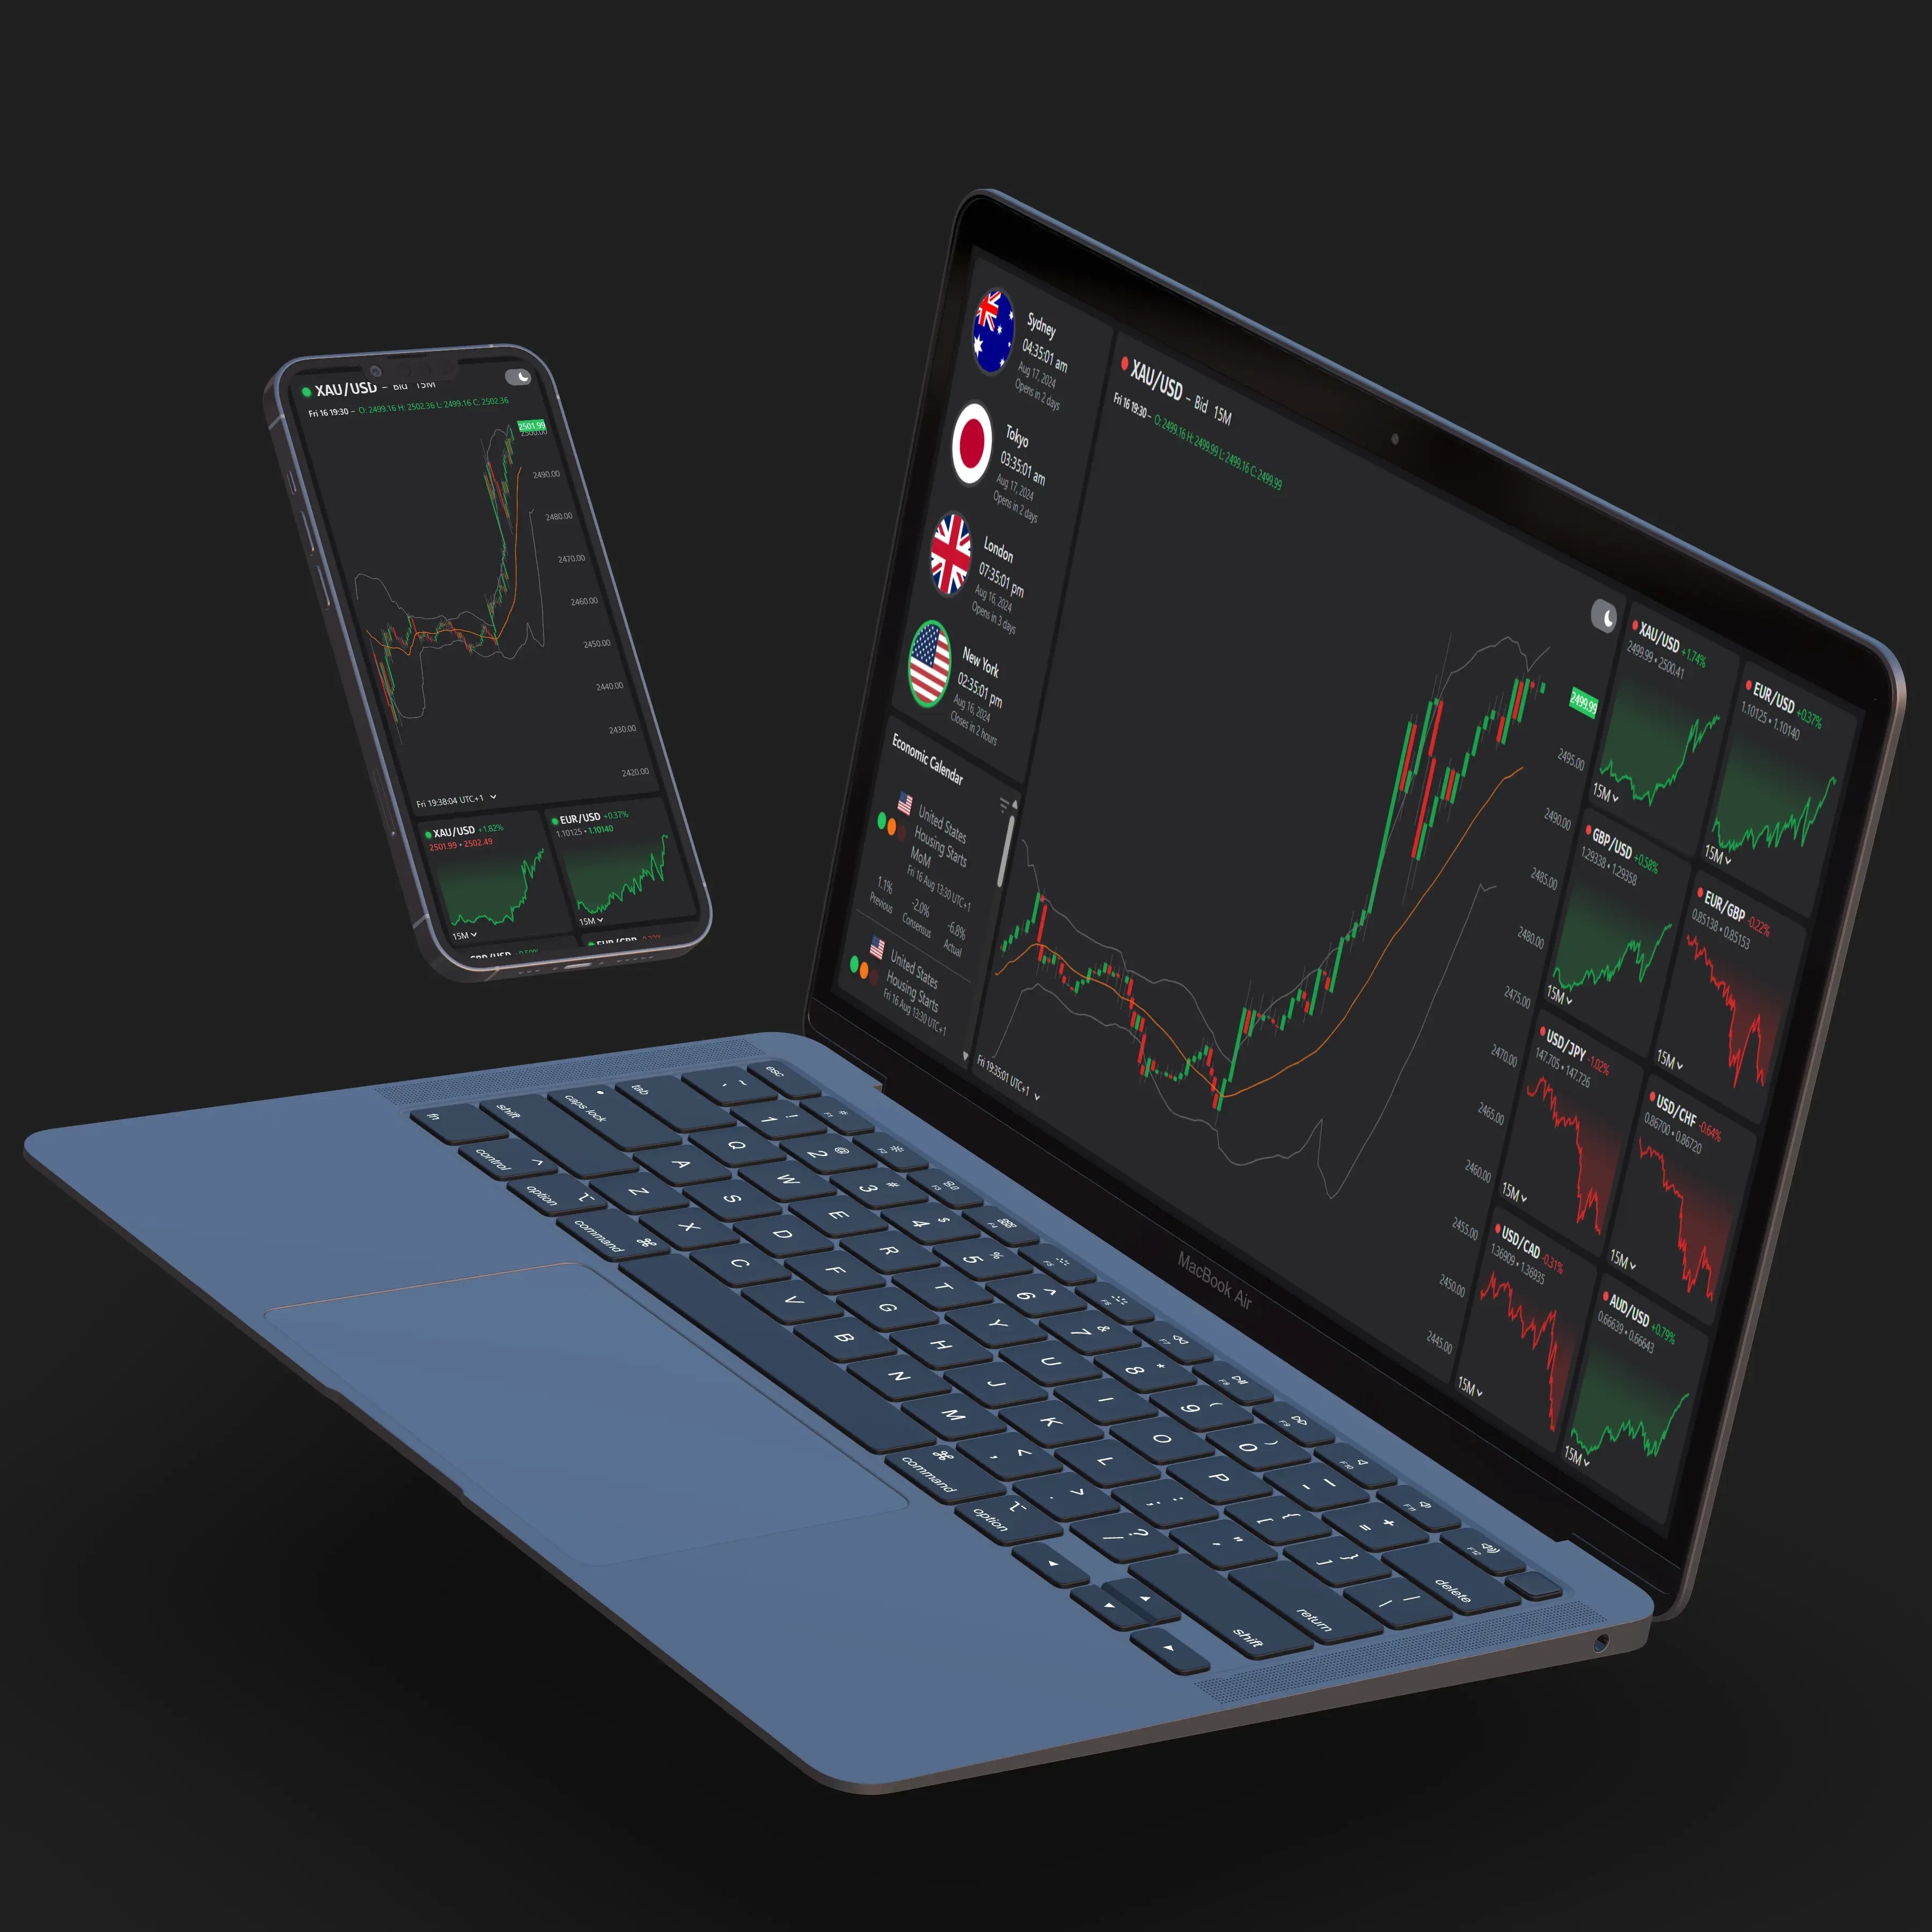
In this project, I leveraged the Dukascopy API and transformed real-time tick data into OHLC (open, high, low, close) intervals to produce dynamic, interactive charts using Remix.js and d3.js.
Like this project
Posted Sep 3, 2024
In this project, I leveraged the Dukascopy API and transformed real-time tick data to produce dynamic and interactive realtime visualizations.
Likes
0
Views
6