


What should I look for in a portfolio when hiring a data visualizer on Contra?
A portfolio can tell you a lot about a data visualizer's style and skills. Look for clear visualizations that present information simply and effectively. Check if they have experience in the type of data relevant to your project. It's also important to see if their work is creative and well-designed. Make sure their portfolio includes a variety of work, showing they can handle different kinds of data sets.
How can I assess if a data visualizer understands my project's goals?
Make sure the data visualizer can summarize your project's objectives in their own words. They should ask questions that show they are trying to understand your needs. Look for someone who can explain how they would transform your data into visuals. Their approach should align with your vision. It's important they show genuine interest in achieving your project's goals.
What tools might a data visualizer use and why are they important?
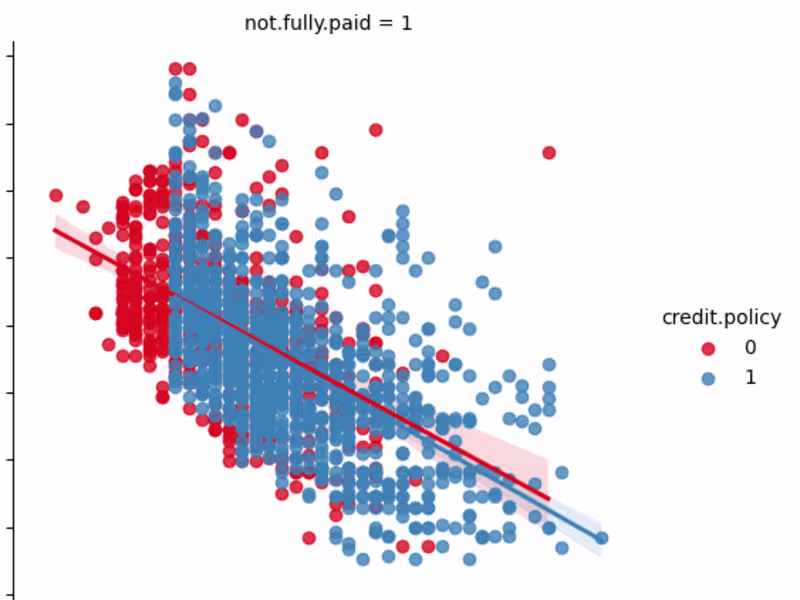
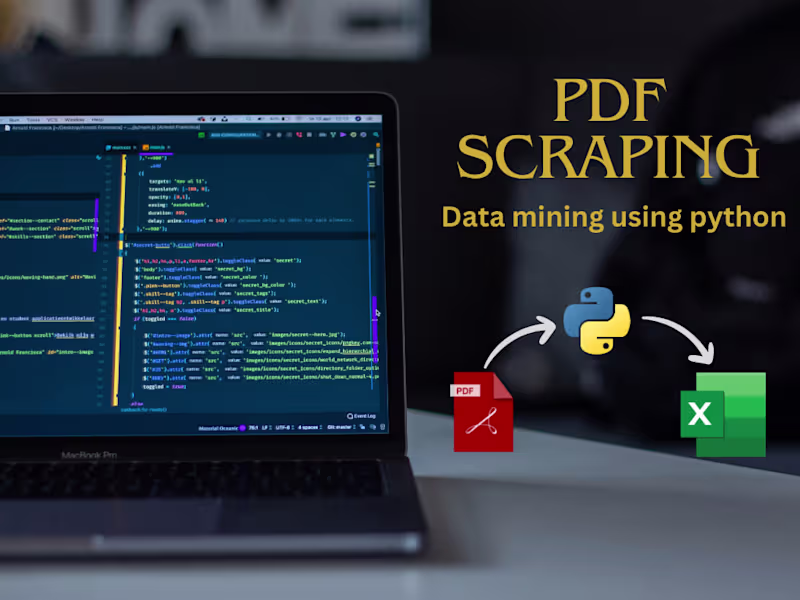
Data visualizers use tools like Tableau, Power BI, or Python for creating visuals. These tools help in transforming complex data into easy-to-understand charts and graphs. It's important for them to use tools they are skilled in and that fit the project's requirements. You should feel confident they can use their chosen tools efficiently. Competence in multiple tools can be beneficial for diverse projects.
How important is it to decide on deliverables before starting a data visualization project?
Deciding on deliverables is crucial before starting a project. It ensures both parties know what to expect and by when. With clear deliverables, you can also better evaluate the data visualizer's progress. It helps manage timelines and budgets more effectively. Make sure the scope and format of each deliverable are well-defined.
Should I ask for a timeline from the data visualizer before beginning a project?
Absolutely, a timeline helps everyone understand the project's progression. It outlines when each part of the work will be completed. This can include stages like initial drafts, reviews, and final submissions. Having a timeline keeps everyone on track and helps avoid delays. It also helps ensure that any needed adjustments are made in a timely manner.
What kind of communication should I expect from a data visualizer once the project starts?
Communication should be regular and clear. The data visualizer should provide updates at agreed intervals. They should be open to discussing challenges and changes. Good communication ensures that the project stays aligned with your expectations. You should also feel comfortable asking questions any time.
How can I confirm that a data visualizer can work with different data formats and themes?
It's important that the data visualizer is flexible with data formats and themes. Check if they have experience with various types of data, like financial or scientific data. Their portfolio or past work should reflect their ability to handle different themes. They should explain how they adapt their style to fit different data stories. This versatility ensures their work can meet diverse project needs.
How can I make sure that the final visuals are suitable for an English audience?
Visuals for an English audience should use familiar color themes and terms. Discuss cultural aspects like colors that have specific meanings in England. Ensure the data visualizer knows your target audience well. Their past work should show they can create visuals that engage English audiences. Clear communication about audience expectations helps avoid misunderstandings.
Why is it beneficial to decide on the method of feedback and revisions before the project starts?
Establishing a feedback process early on prevents confusion. Decide how and when feedback will be given. This should include how many revision rounds are allowed. A structured process ensures smoother collaboration and quicker improvements. Being on the same page also maintains the project timeline.
How can I gauge if a data visualizer can illustrate data with cultural relevance to England?
A data visualizer who understands culture can make relatable visuals. Check if they have experience working with English data or clients. Their work should reflect an awareness of things like local dates or events. Importance imagery recognized in England should be used where applicable. This guarantees that visuals resonate well with the target audience.
Who is Contra for?
Contra is designed for both freelancers (referred to as "independents") and clients. Freelancers can showcase their work, connect with clients, and manage projects commission-free. Clients can discover and hire top freelance talent for their projects.
What is the vision of Contra?
Contra aims to revolutionize the world of work by providing an all-in-one platform that empowers freelancers and clients to connect and collaborate seamlessly, eliminating traditional barriers and commission fees.