Virex — Fintech Dashboard (Concept)
Mustofa Al-Ameen Mustafa
Cover
Type: Concept / spec project (not a client engagement)
Role: Product Designer (UI/UX)
Tools: Figma
What This Is
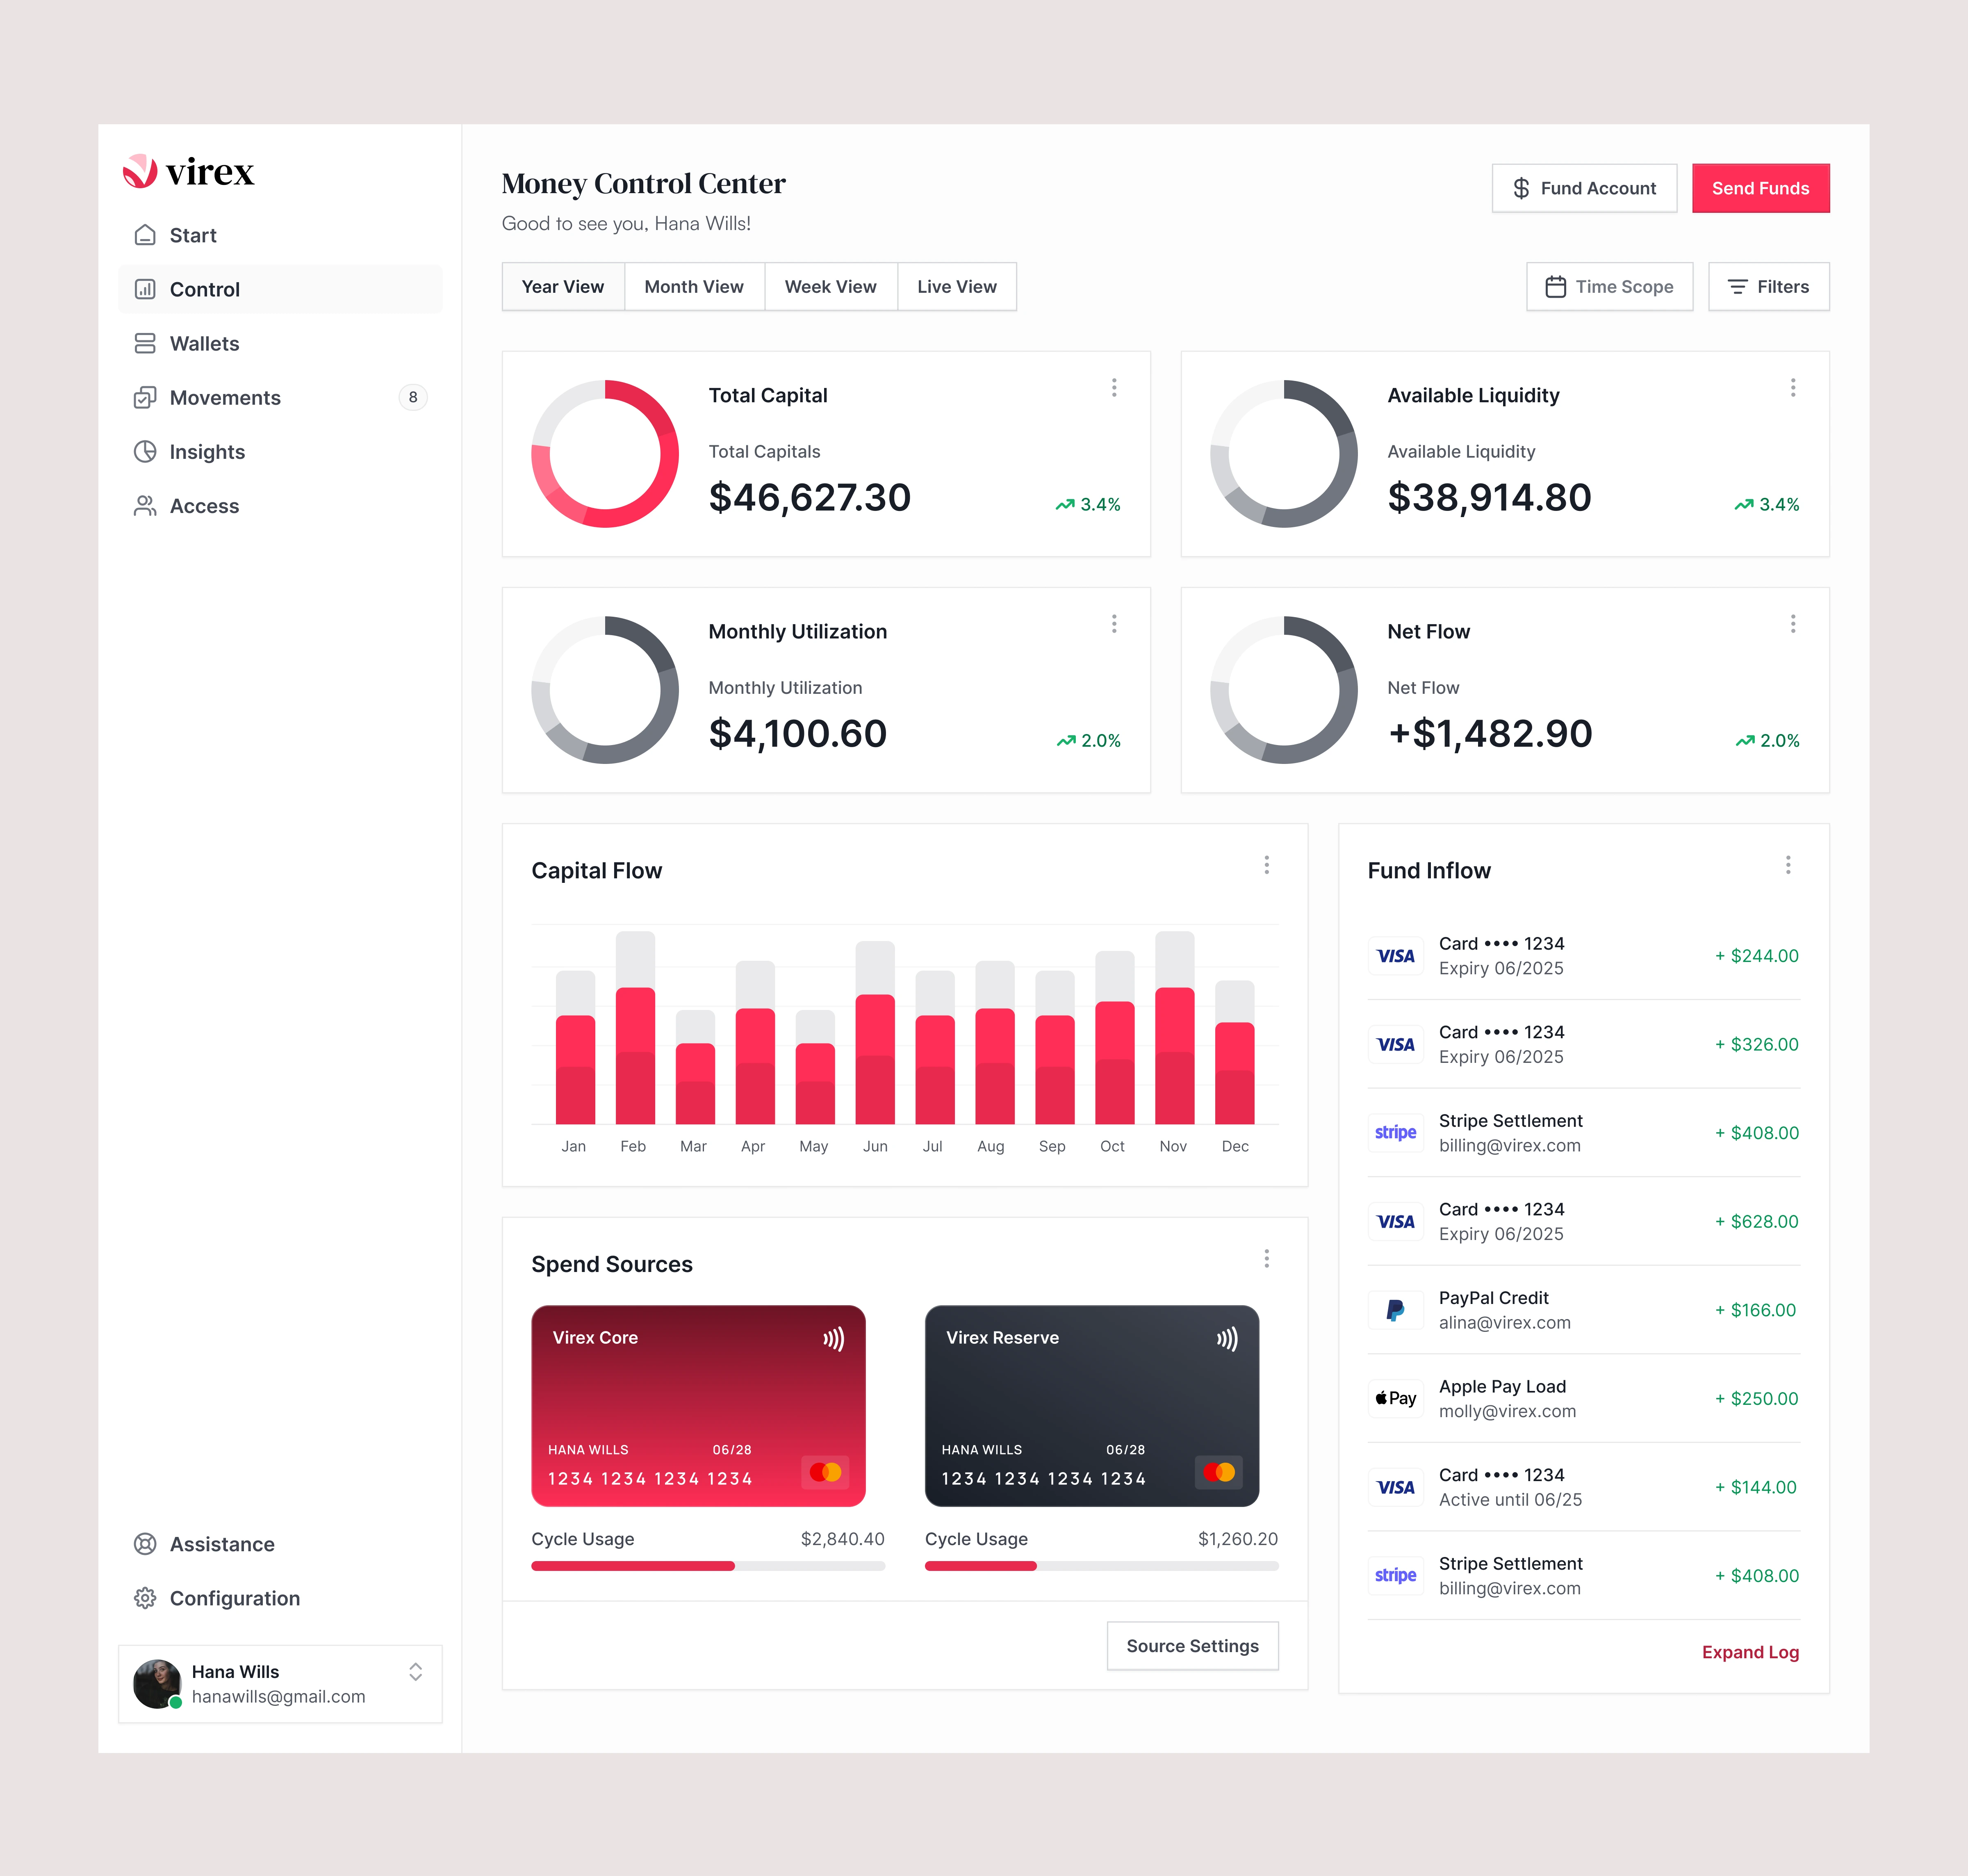
Virex is a concept fintech dashboard designed to help users monitor and control their financial activity from a single interface. I built this to demonstrate how financial data can be presented clearly without overwhelming users.
What I Did
Defined the core problem — most fintech dashboards show too much raw data. Users need to understand their financial health at a glance, not parse spreadsheets
Designed the metrics layer — 4 high-level cards: Total Capital, Available Liquidity, Monthly Utilization, and Net Flow. Each answers one question about financial health
Built the transaction views — Capital Flow visualization (monthly bar chart for trends), Fund Inflow Log (structured incoming transactions), and Spend Sources (card-based spend management with usage indicators)
Created a scalable design system — metrics-first layout, strong visual hierarchy using typography and contrast, card-based components, minimalist UI to build trust
Key Design Decisions
Metrics-first layout — the dashboard opens with the 4 numbers that matter most, not a wall of transactions
Card-based system — each data module is self-contained and scannable
Calm, modern visual language — fintech products need to feel trustworthy. The design uses restraint to build confidence
Why This Matters
This project demonstrates fintech dashboard design: how to take complex financial data and surface it in a way that enables quick decision-making.
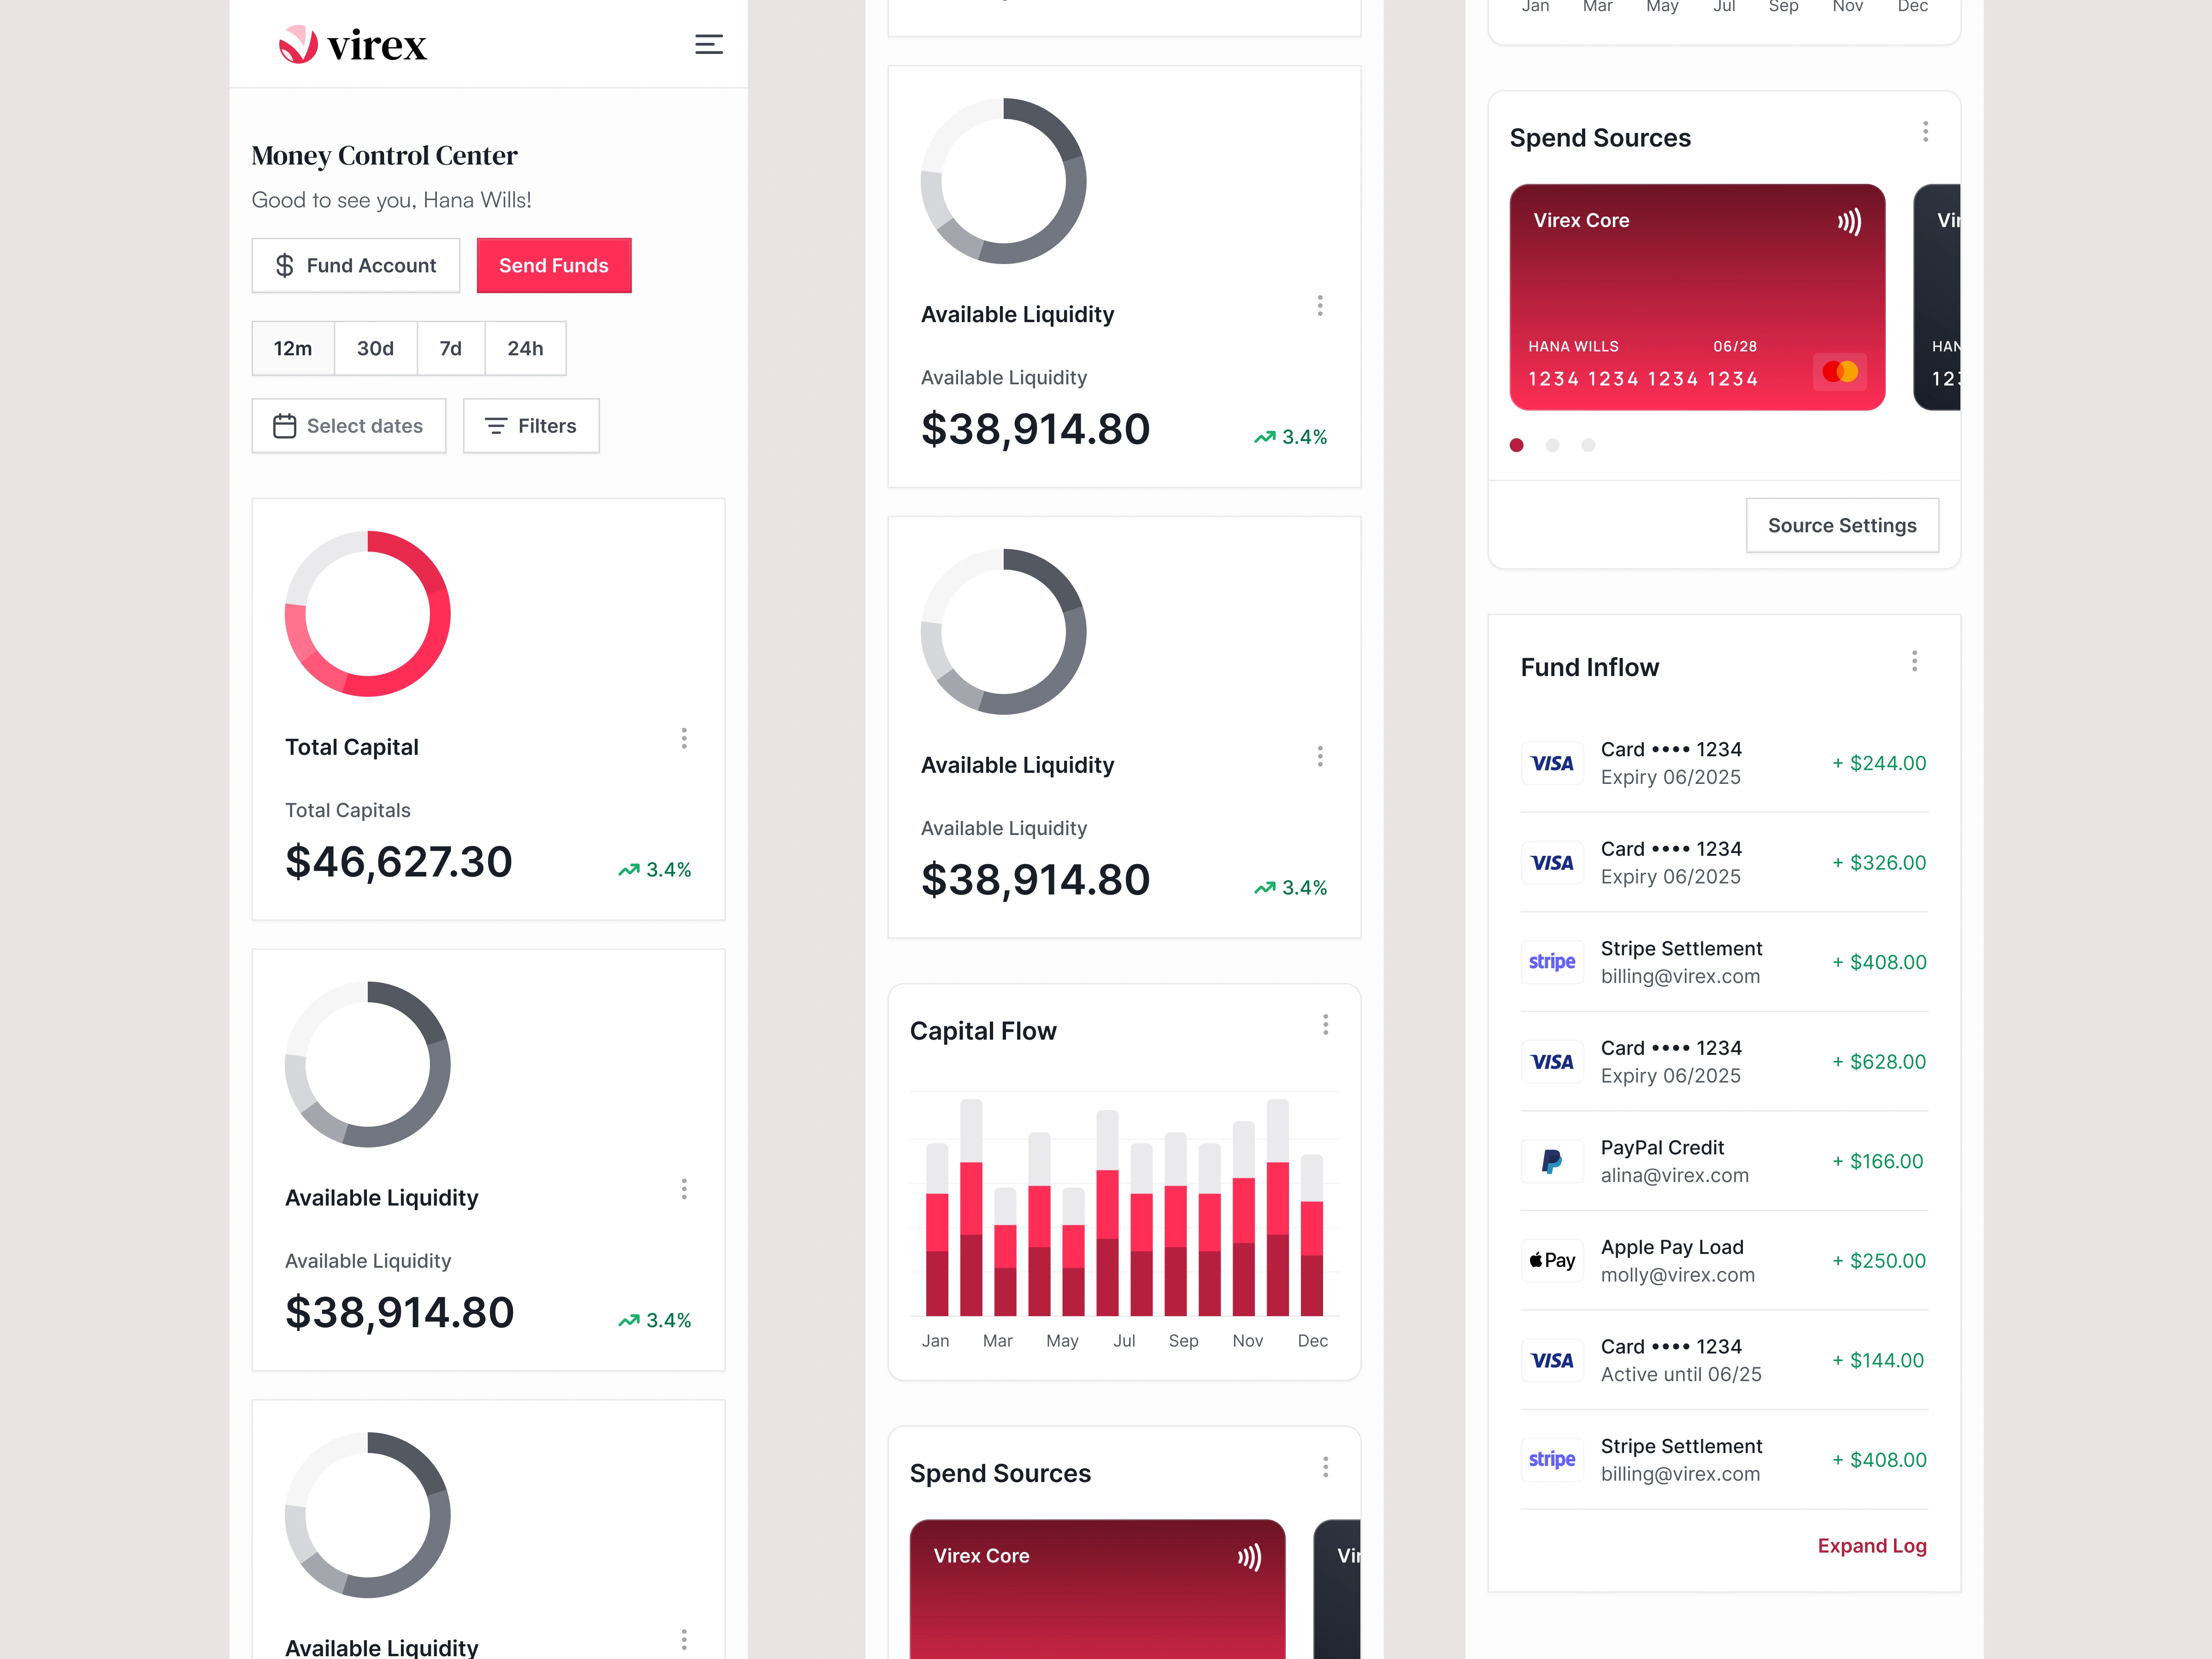
Mobile screens
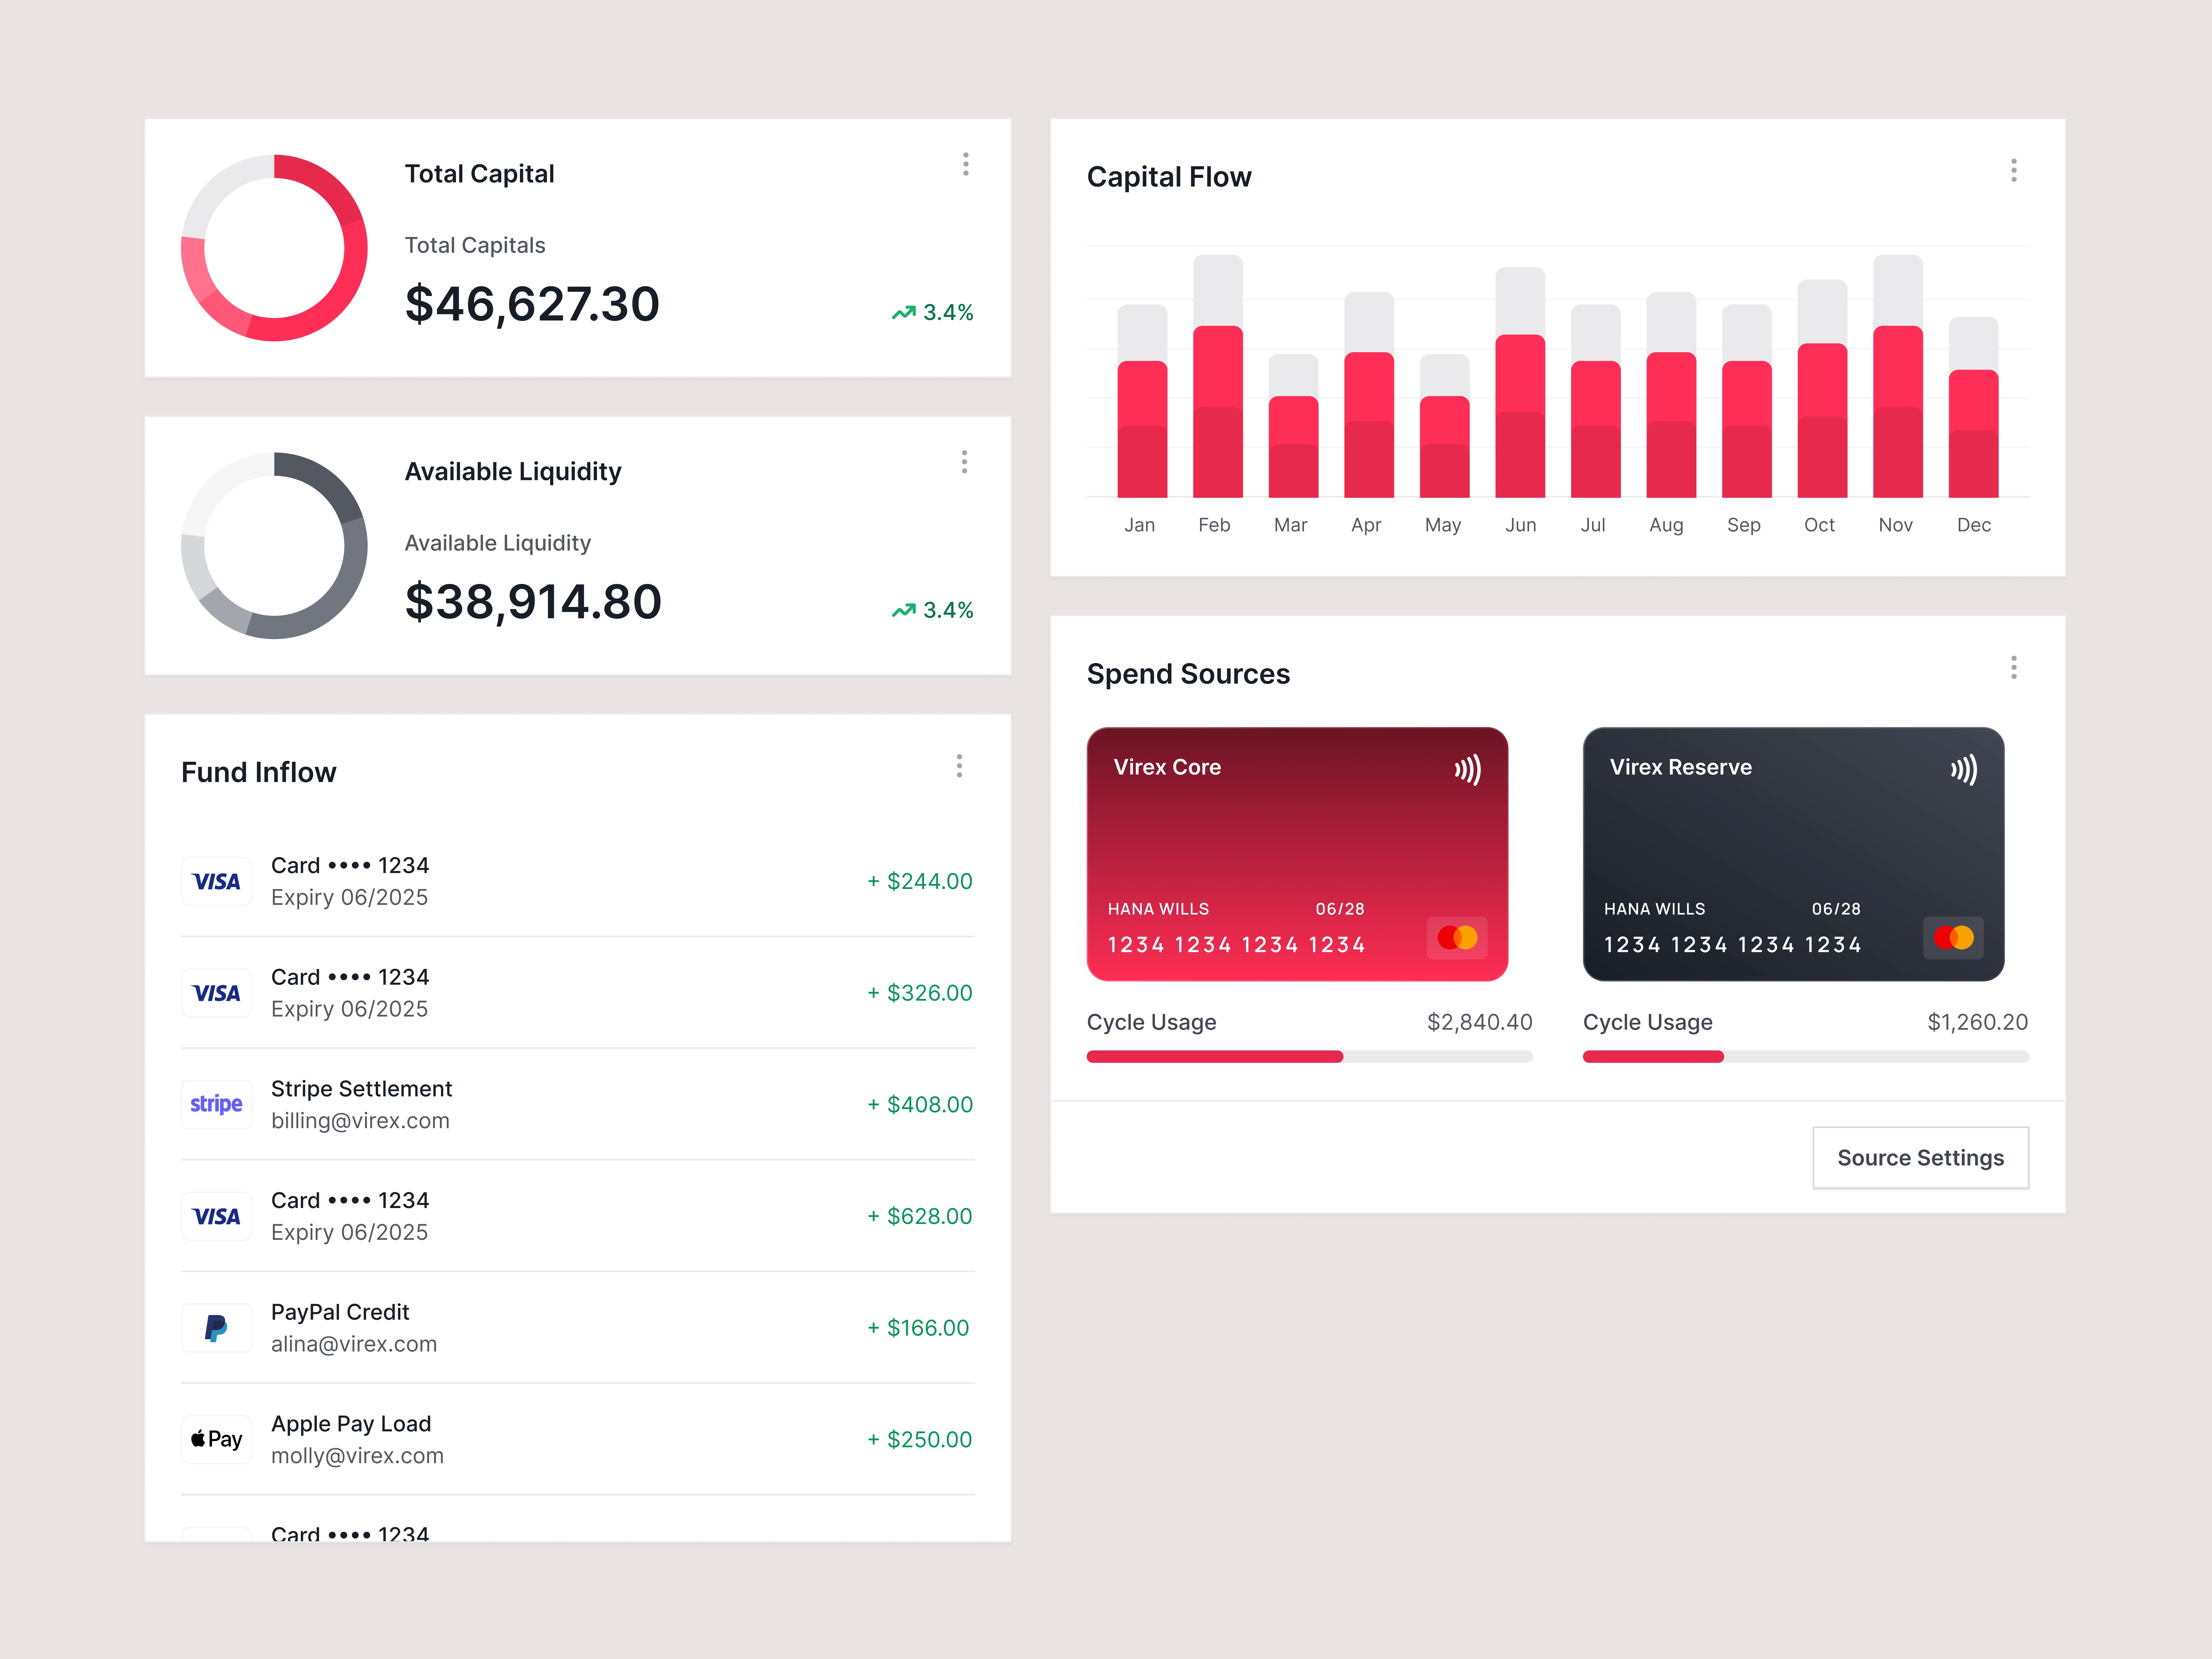
Key components
Like this project
Posted Jan 10, 2026
Concept project: designed a fintech dashboard for monitoring capital flow, transactions, and spend sources.