I Developed an interactive Excel
Farah Maqbool
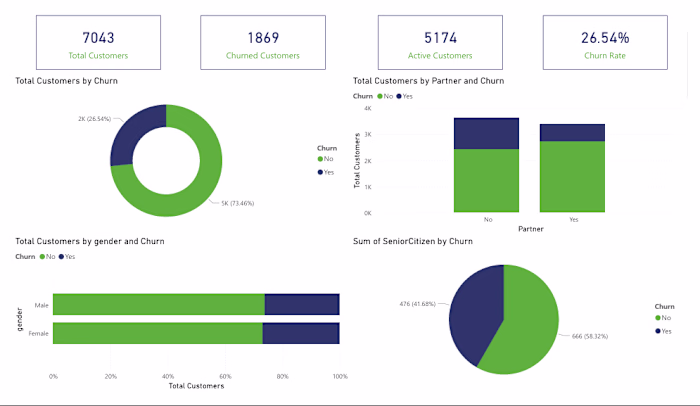
I Developed an interactive Excel dashboard to analyze sales performance, profitability, and customer behavior using transactional retail data.
The dashboard enables quick insights into regional performance, monthly trends, product profitability, and high-value customers.
Key metrics such as total sales, total profit, total orders, and average discount are highlighted using KPI indicators, while dynamic slicers allow users to filter the analysis by region, customer segment, and product category.
The project demonstrates the ability to transform raw business data into clear and actionable insights using spreadsheet analytics.
Like this project
Posted Mar 14, 2026
I Developed an interactive Excel dashboard to analyze sales performance, profitability, and customer behavior using transactional retail data. The dashboar...
Likes
0
Views
0
Timeline
Mar 12, 2026 - Mar 14, 2026