Invoice Process Application Dashboard
Dumebi Odumah
How a Financial Dashboard Enhances Decision-Making
Overview
Organizations often struggle with tracking expenses, analyzing spending patterns, and making informed financial decisions. A comprehensive financial dashboard addresses these challenges by providing structured insights into key financial metrics. By leveraging data visualization, organizations can optimize spending, improve vendor management, and enhance budget planning.
Key Challenges and Solutions Provided
Lack of Visibility in Financial Data
Challenge: Organizations find it difficult to get a clear overview of their total spending, invoices, and receipts over time.
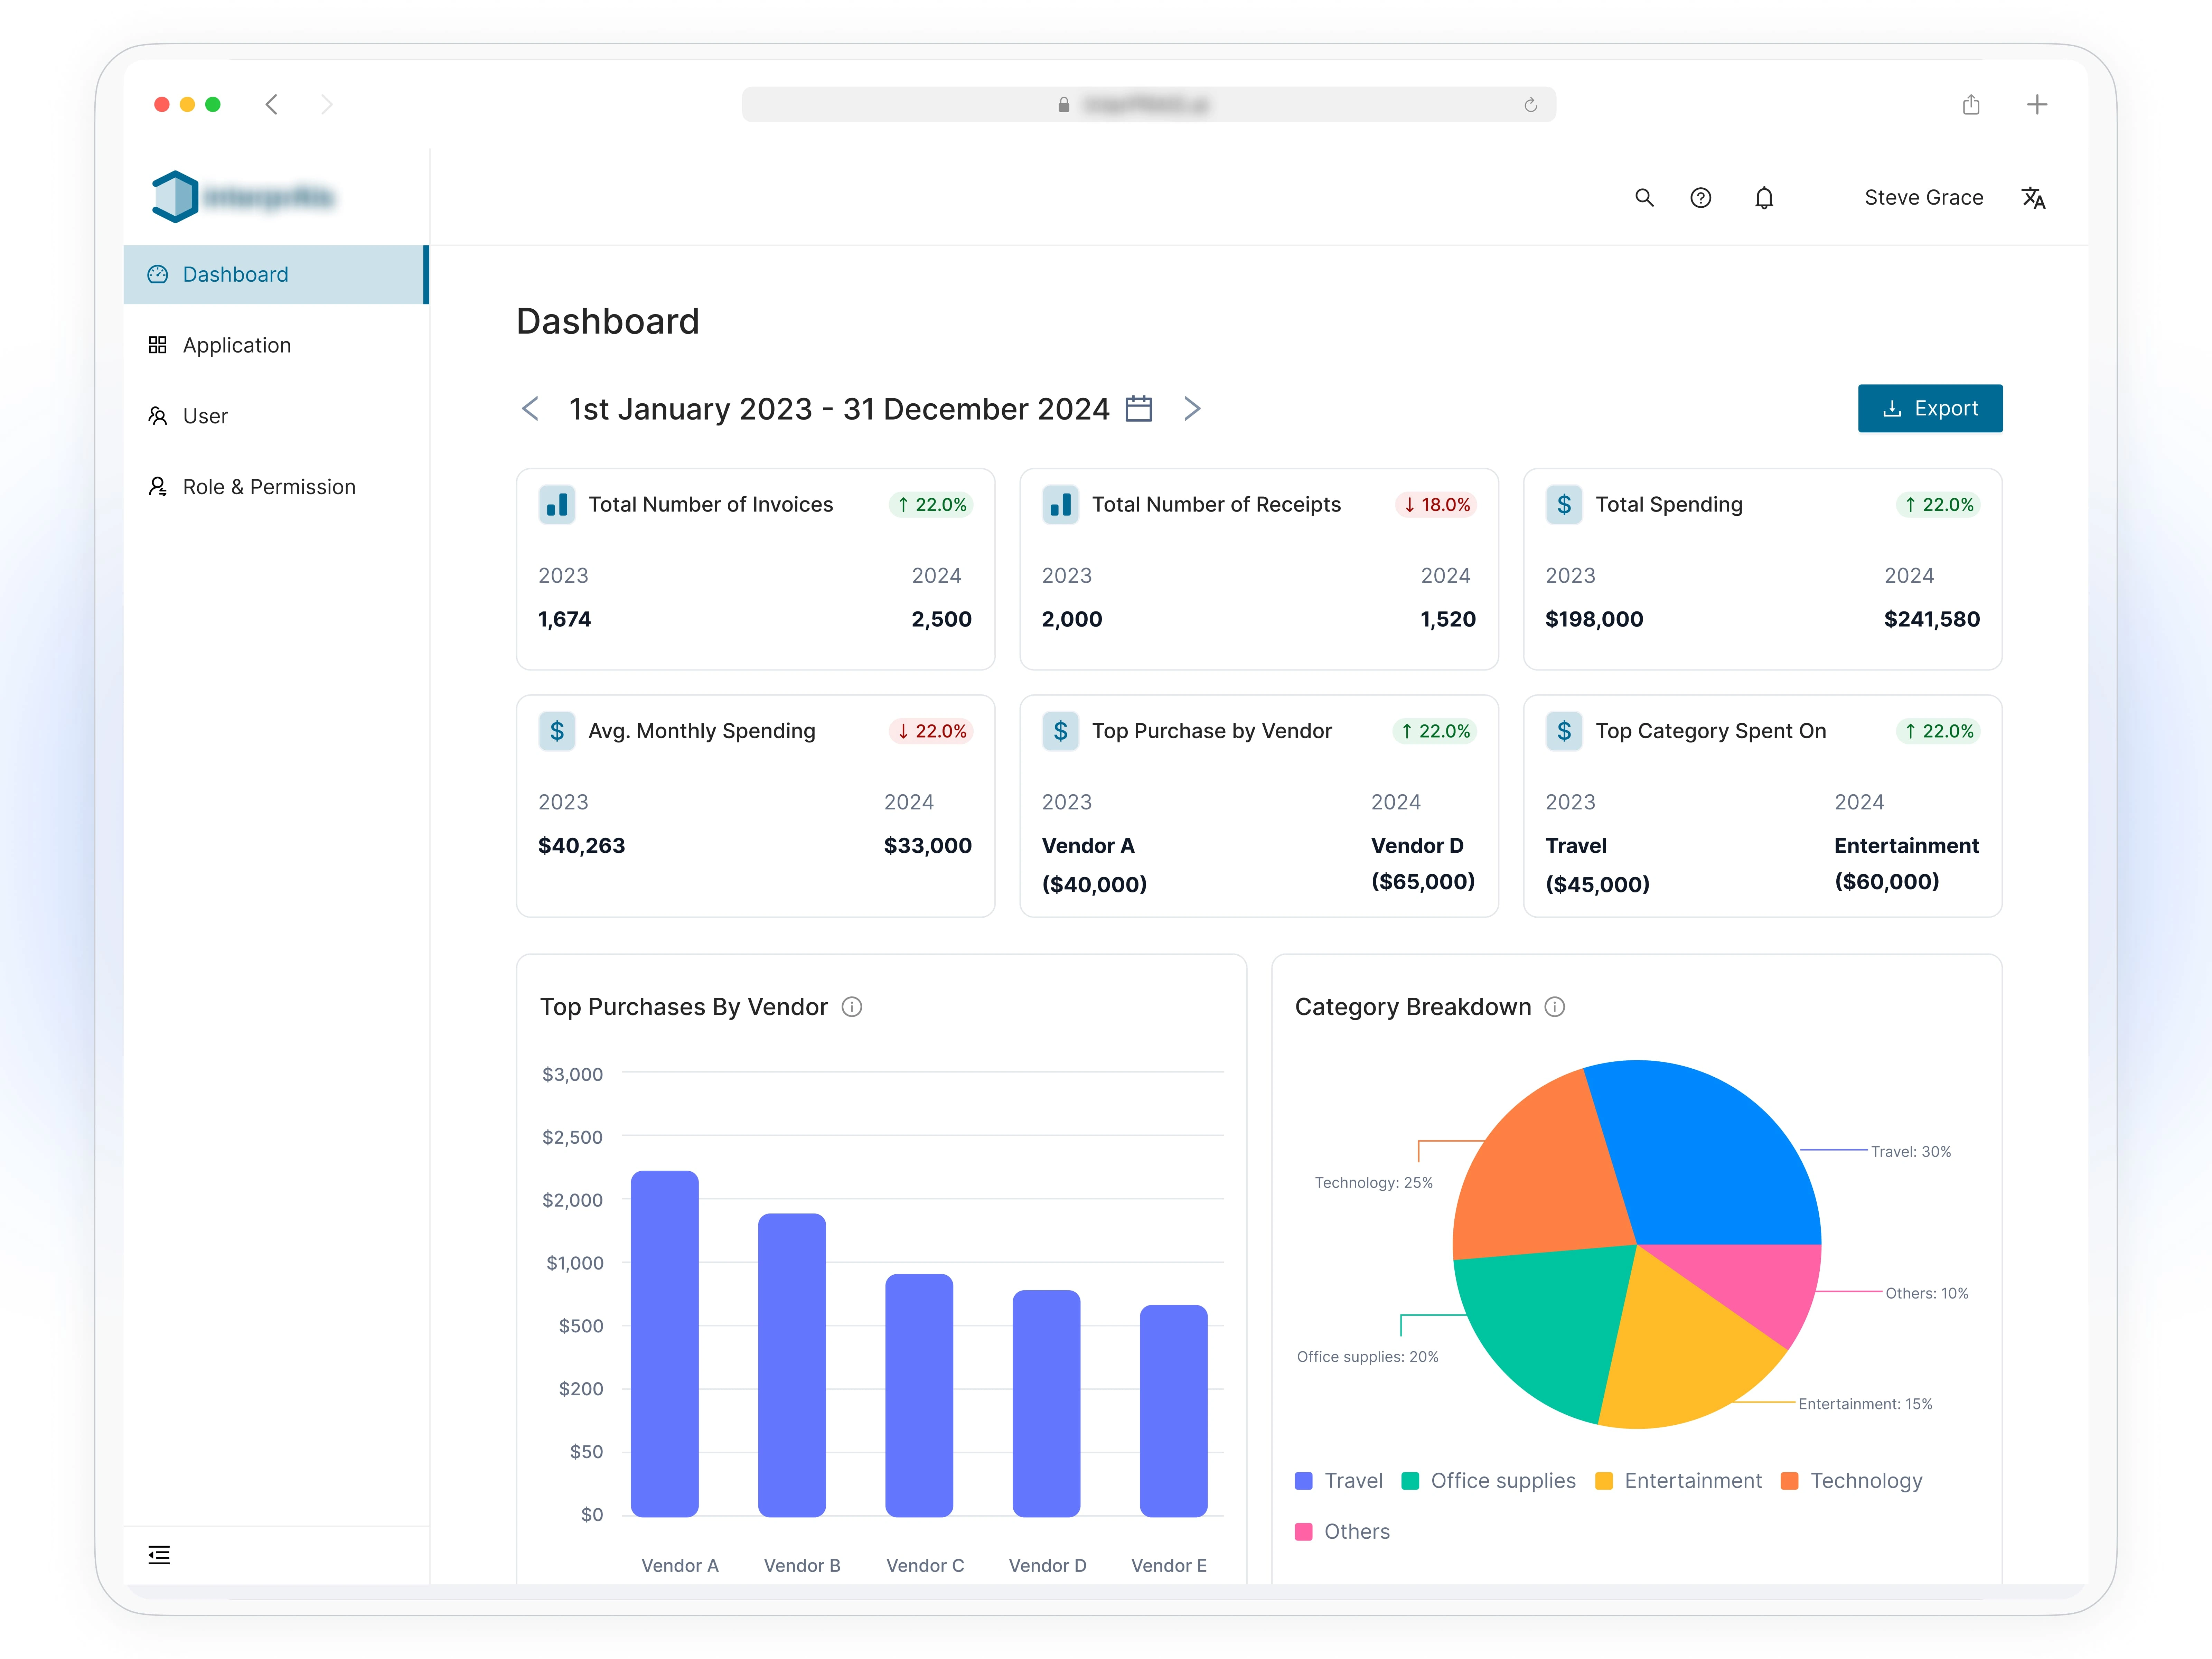
Solution: The KPI Card Section provides a summary of total invoices, receipts, and overall expenditure trends, enabling quick assessment of financial performance across different years.
Unstructured Vendor Analysis
Challenge: Identifying the top vendors and tracking how much is spent with each supplier can be complex, leading to inefficient procurement.
Solution: A bar chart displaying purchases by vendor helps organizations pinpoint major suppliers, negotiate better deals, and reduce unnecessary costs.
Difficulty in Identifying Spending Trends
Challenge: Without clear spending patterns, organizations struggle to forecast budgets and allocate resources effectively.
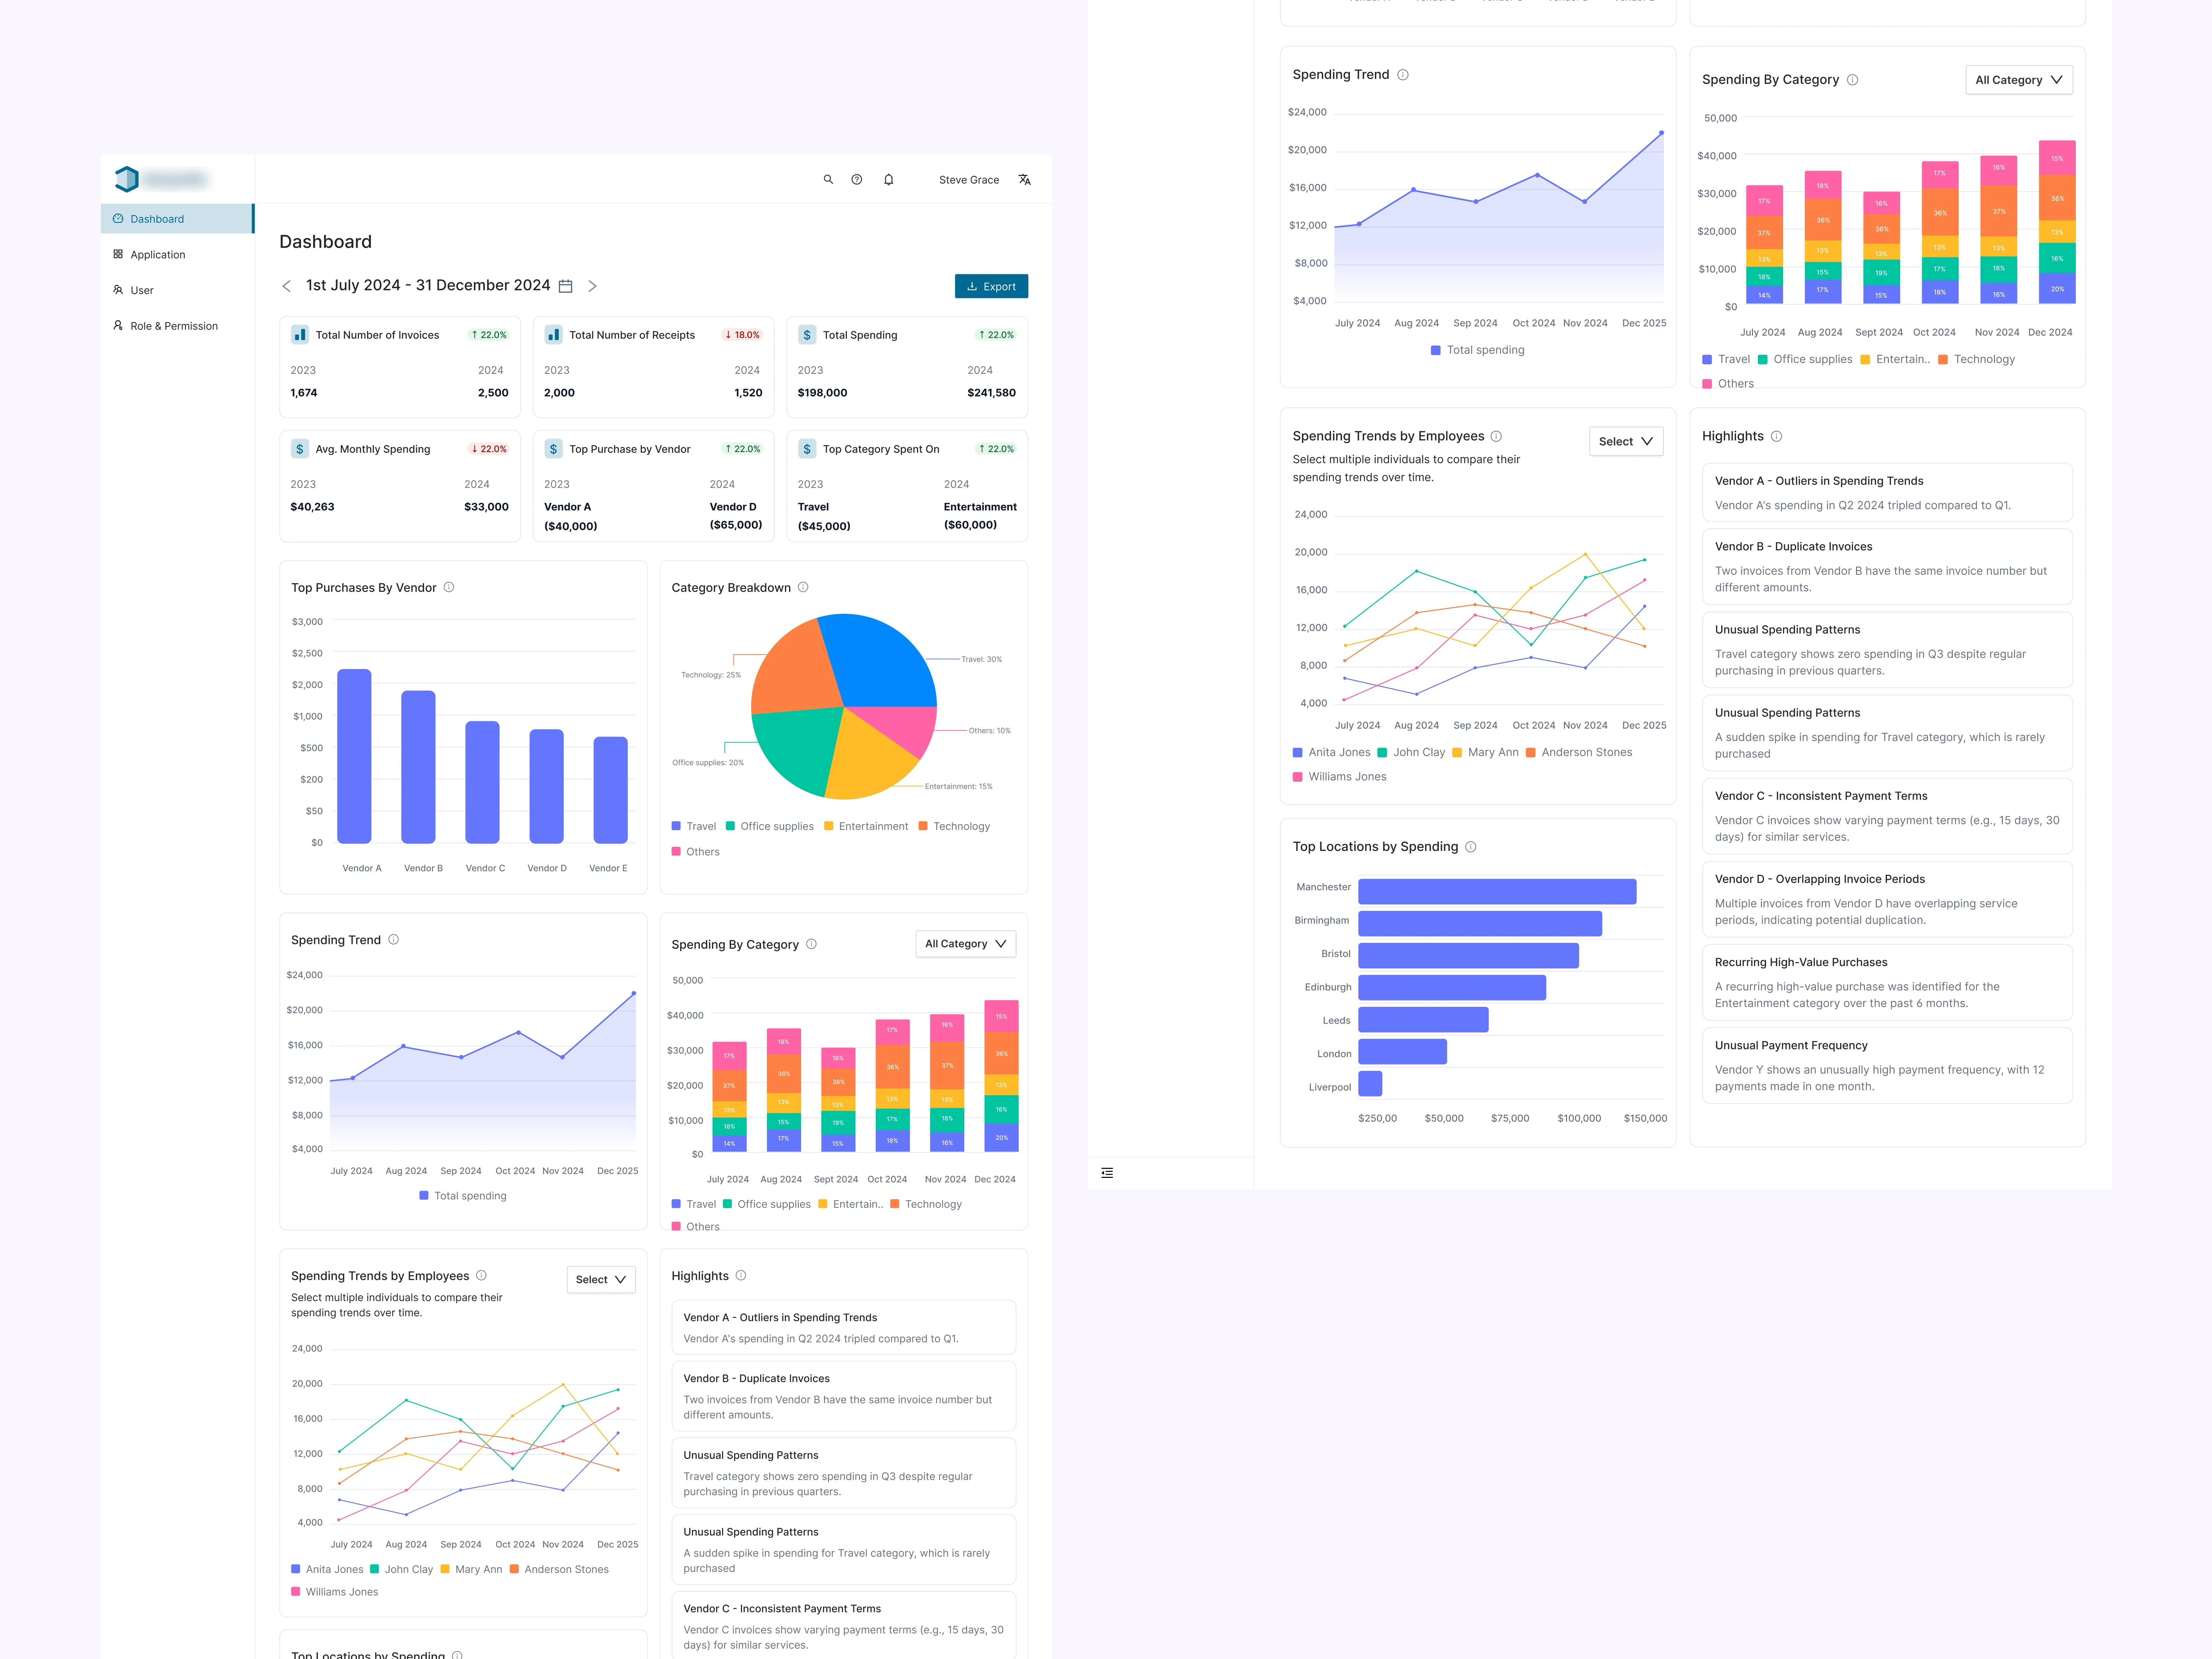
Solution: A line chart illustrating spending trends over the past two years allows for easy comparison and helps identify periods of high or low expenditure.
Limited Insight into Category-Based Expenditures
Challenge: Organizations often fail to categorize spending, making it hard to allocate budgets efficiently.
Solution: A pie chart breakdown of category-based spending ensures that organizations can track which areas—such as technology, office supplies, or travel—consume the most budget.
Unclear Spending Distribution by Location
Challenge: Without location-based tracking, organizations cannot determine which branches or offices drive the highest costs.
Solution: A horizontal bar chart highlighting top locations by spending provides insight into which regions require financial review, allowing for better budget adjustments.
Lack of Employee-Specific Spending Insights
Challenge: Organizations need a way to track individual employee expenditures to ensure accountability and compliance.
Solution: The spending by employee section helps monitor employee expenses, detect unusual spending patterns, and enforce financial policies.
Difficulty in Quickly Understanding Key Insights
Challenge: Managers and stakeholders often lack time to analyze every section of a financial dashboard in detail and Without a summarized view, identifying critical financial trends and key takeaways becomes time-consuming.
Solution: The Highlights Section offers a quick summary of key financial insights, helping stakeholders efficiently identify critical trends and make informed decisions without reviewing each section in detail.
Image
Interactive video of the Dashboard
Impact of the Dashboard
By implementing these solutions, organizations benefit from:
Improved Financial Oversight – A centralized dashboard provides clear visibility into all spending activities.
Better Cost Control – Organizations can identify inefficiencies and reduce unnecessary expenses.
Enhanced Budget Planning – Spending trends and category insights enable more effective resource allocation.
Increased Accountability – Employee and location-specific spending tracking ensures compliance and reduces financial risks.
Like this project
Posted Jan 31, 2025
The dashboard provides a clear and organized view of invoices, helping to track financial performance, analyze trends, and make informed decisions.