


How do I define the goals for my data visualization project?
Start by thinking about what you want the data to show. Consider what questions you need the data to answer. Work out what decisions you want to make from this data. This helps your data visualizer know what to focus on. Clear goals help them create the best visual story for you.
What should I include in my project brief for a data visualizer?
Write down what you want to achieve and include any specific datasets. Tell them about any styles or colors you prefer. Share your timelines and any important deadlines. The clearer your brief, the easier it is for the data visualizer to understand your needs. A good brief helps them create visuals that match your vision.
How can I evaluate a data visualizer's past work?
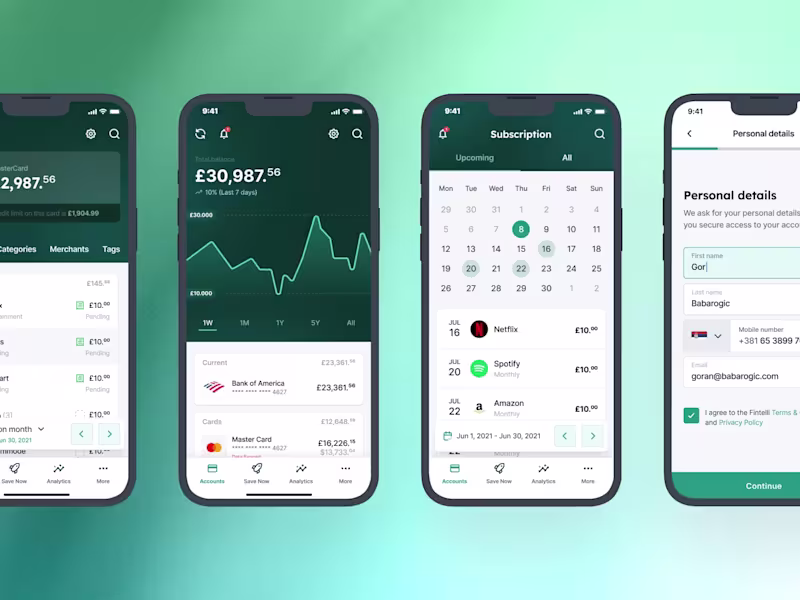
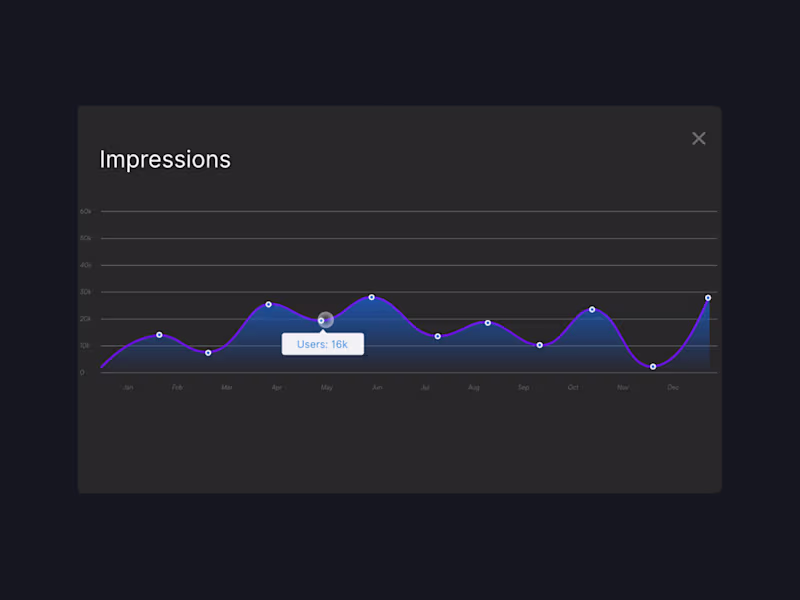
Look at their portfolio to see the kinds of projects they've worked on. Check for a variety of styles and data types they have visualized. See if their work tells a story or makes complex data easy to understand. A good portfolio shows the visualizer’s skills and creativity. This helps you decide if they are a good fit for your project.
How do I make sure the data is given to the visualizer in the right format?
Ask the data visualizer what format they prefer. This makes it easy for them to start the project quickly. Make sure your data is clean and organized, with clear labels. Providing the right format helps the visualizer work more efficiently. It also helps in creating accurate and effective visuals.
What are important milestones to set when planning the project timeline?
Set initial deadlines for reviewing initial designs or drafts. Plan check-ins to discuss progress and make adjustments. Agree on a final due date for the completed project. Milestones help keep the project on track. They also ensure that you and the data visualizer are aligned throughout the process.
How do I agree on deliverables with the data visualizer?
Talk with the visualizer about what outputs you expect, like graphs, charts, or dashboards. Specify sizes, file formats, and any interactive elements you need. Be clear about how you plan to use the visualizations, whether it's for a presentation or a report. Agreeing on deliverables avoids misunderstandings. It ensures you receive what you need at the end of the project.
How can I ensure the data visuals align with my branding?
Provide the visualizer with your brand guidelines if you have them. These include colors, fonts, and any particular style or tone you use. Discuss how closely you want the visuals to match your current brand look. This ensures that all visuals fit seamlessly into your existing materials. A consistent style helps strengthen your brand identity.
What should I do if I have changes during the project?
Communicate any changes as soon as possible to the data visualizer. Set a process for how updates will be managed and confirm any changes to the timeline. Keeping open communication helps the visualizer adjust and stay on track. This way, the final product will meet your updated needs.
How do I provide feedback on the drafts or samples?
Be specific about what you like and what you want changed. Use constructive and clear points, focusing on both visuals and data accuracy. Suggest any improvements that align better with your goals. Effective feedback helps the data visualizer enhance the work to your satisfaction. It ensures that the final output is exactly what you envision.
How do I measure the success of the data visualization?
Decide on the key metrics that tie to your project goals. This could be improved decision-making, clearer data understanding, or engaging presentations. Check if the visualizations achieve the intended impact or answer your key questions. Success is when the data visuals help you achieve your goals. Knowing how to measure success helps in assessing the value of the project.
Who is Contra for?
Contra is designed for both freelancers (referred to as "independents") and clients. Freelancers can showcase their work, connect with clients, and manage projects commission-free. Clients can discover and hire top freelance talent for their projects.
What is the vision of Contra?
Contra aims to revolutionize the world of work by providing an all-in-one platform that empowers freelancers and clients to connect and collaborate seamlessly, eliminating traditional barriers and commission fees.