Serverless Database Dashboard
Cansaas Agency
Overview
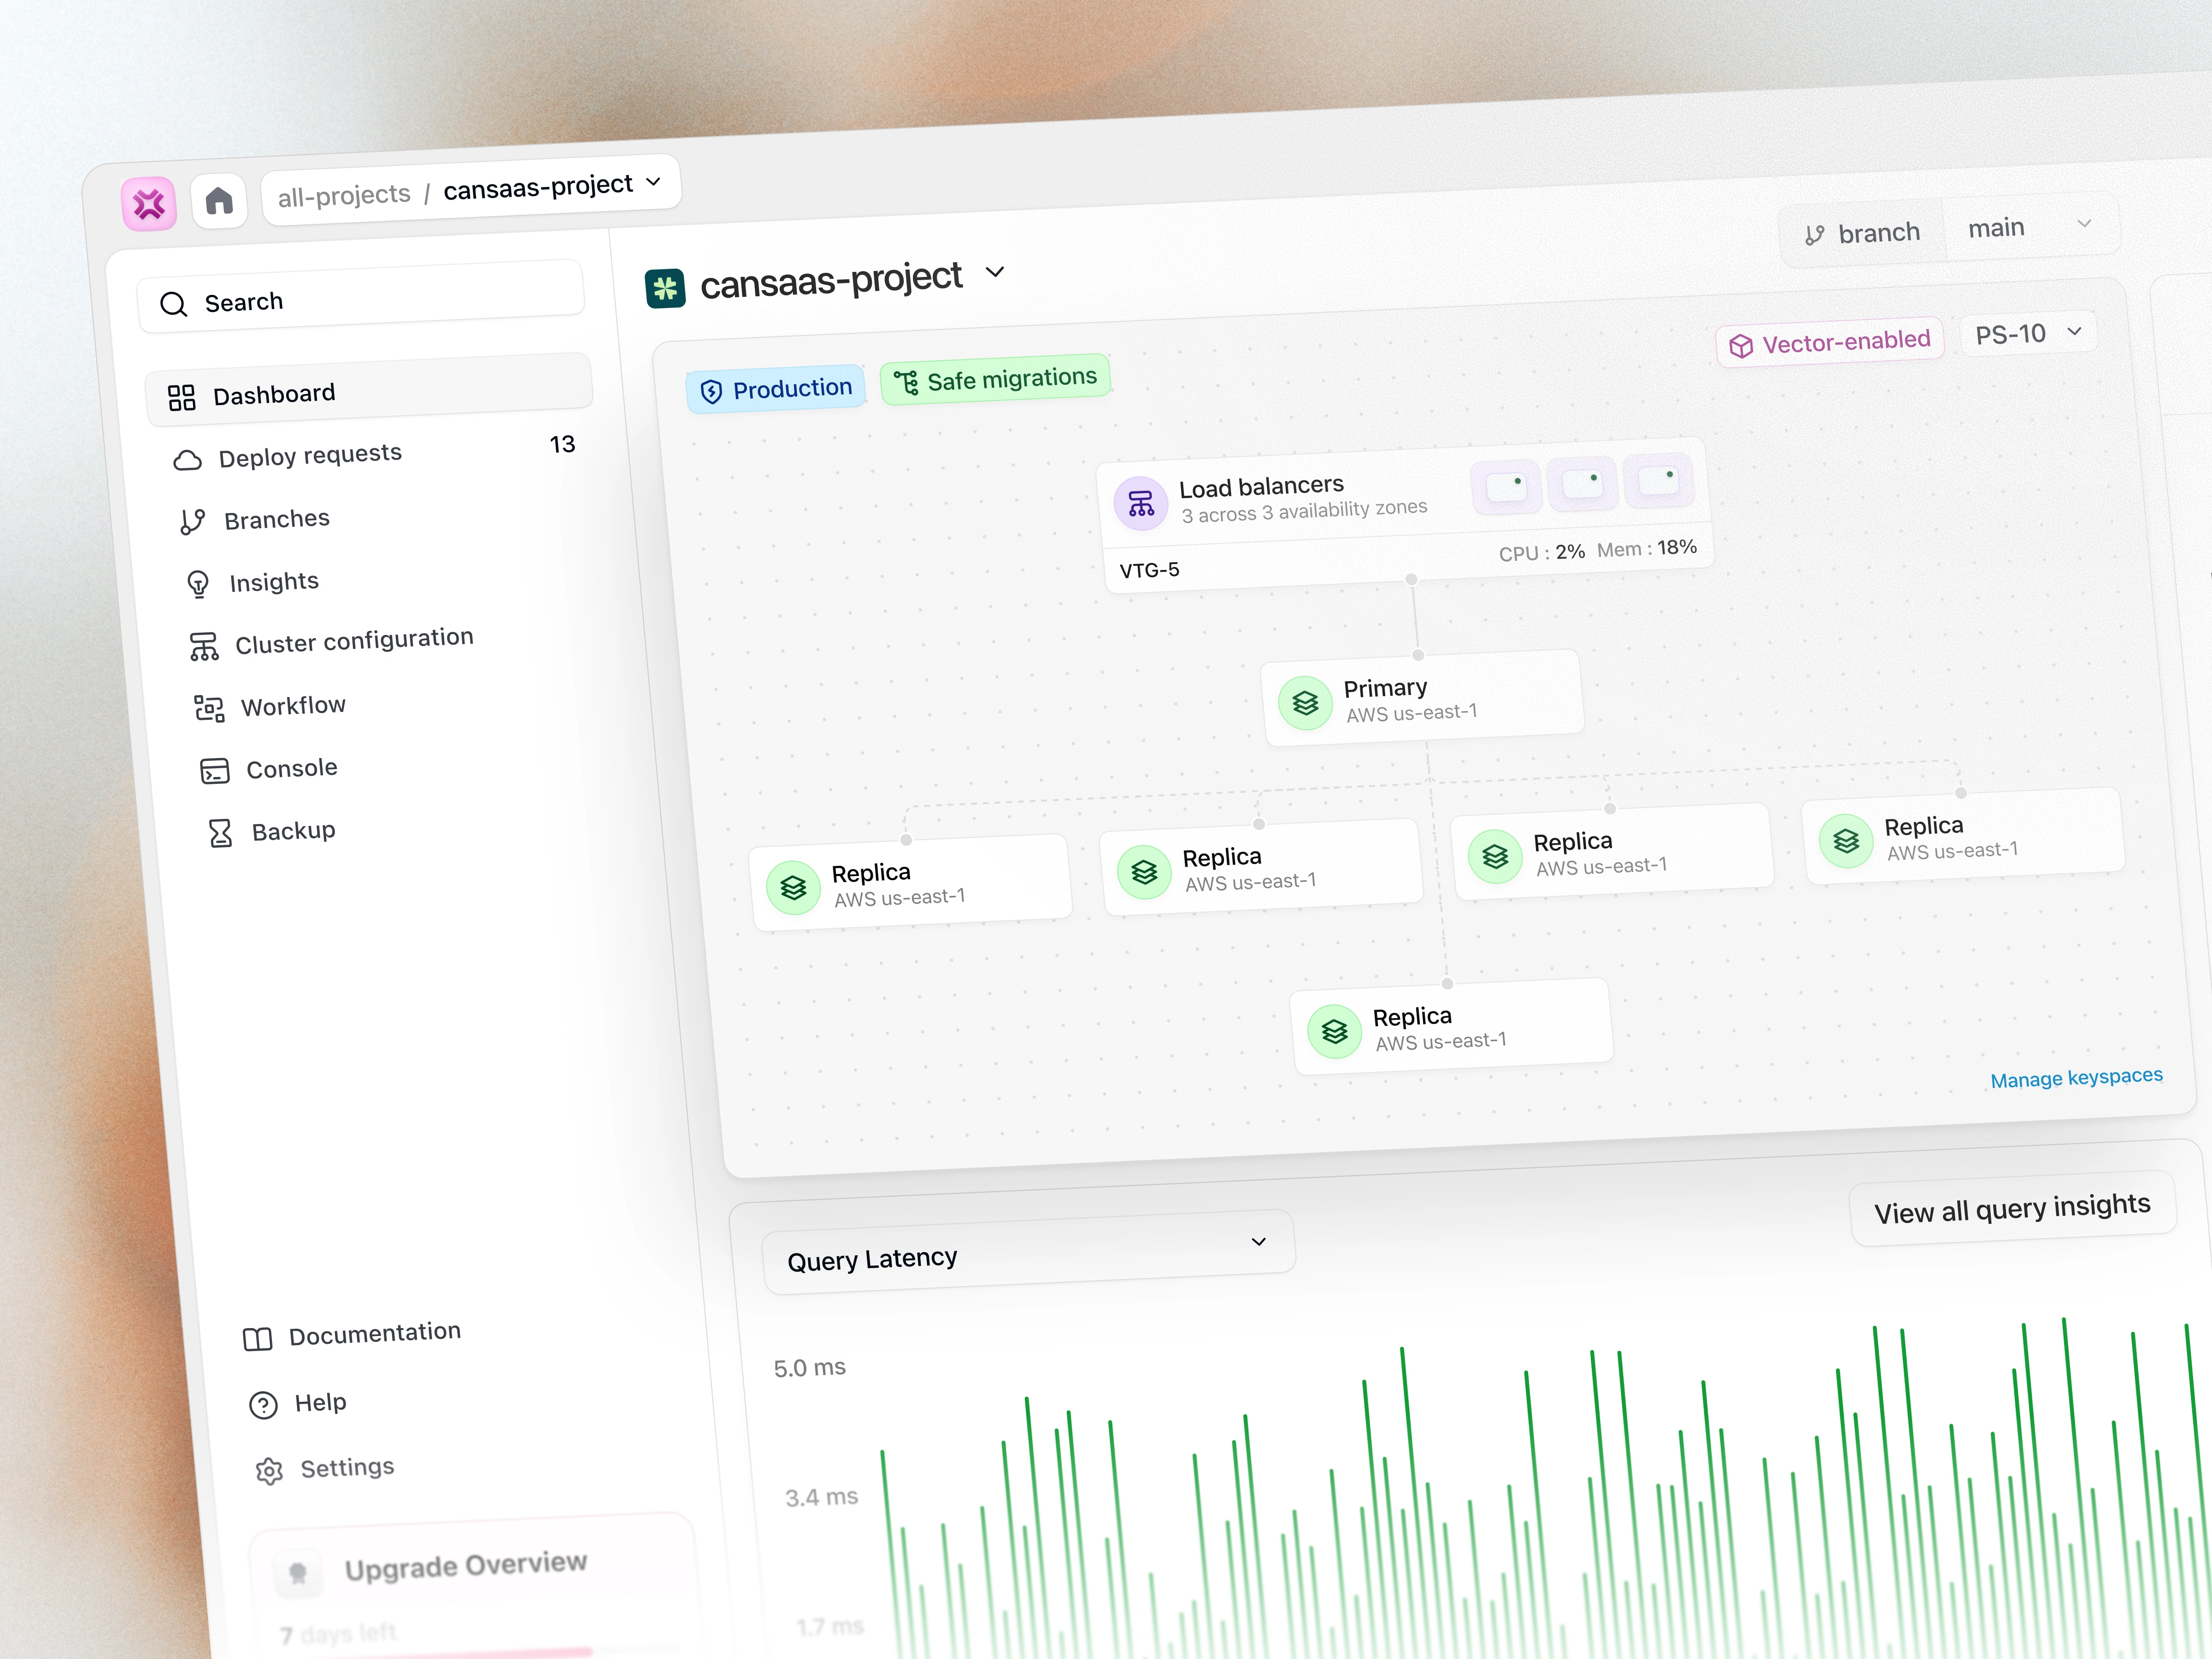
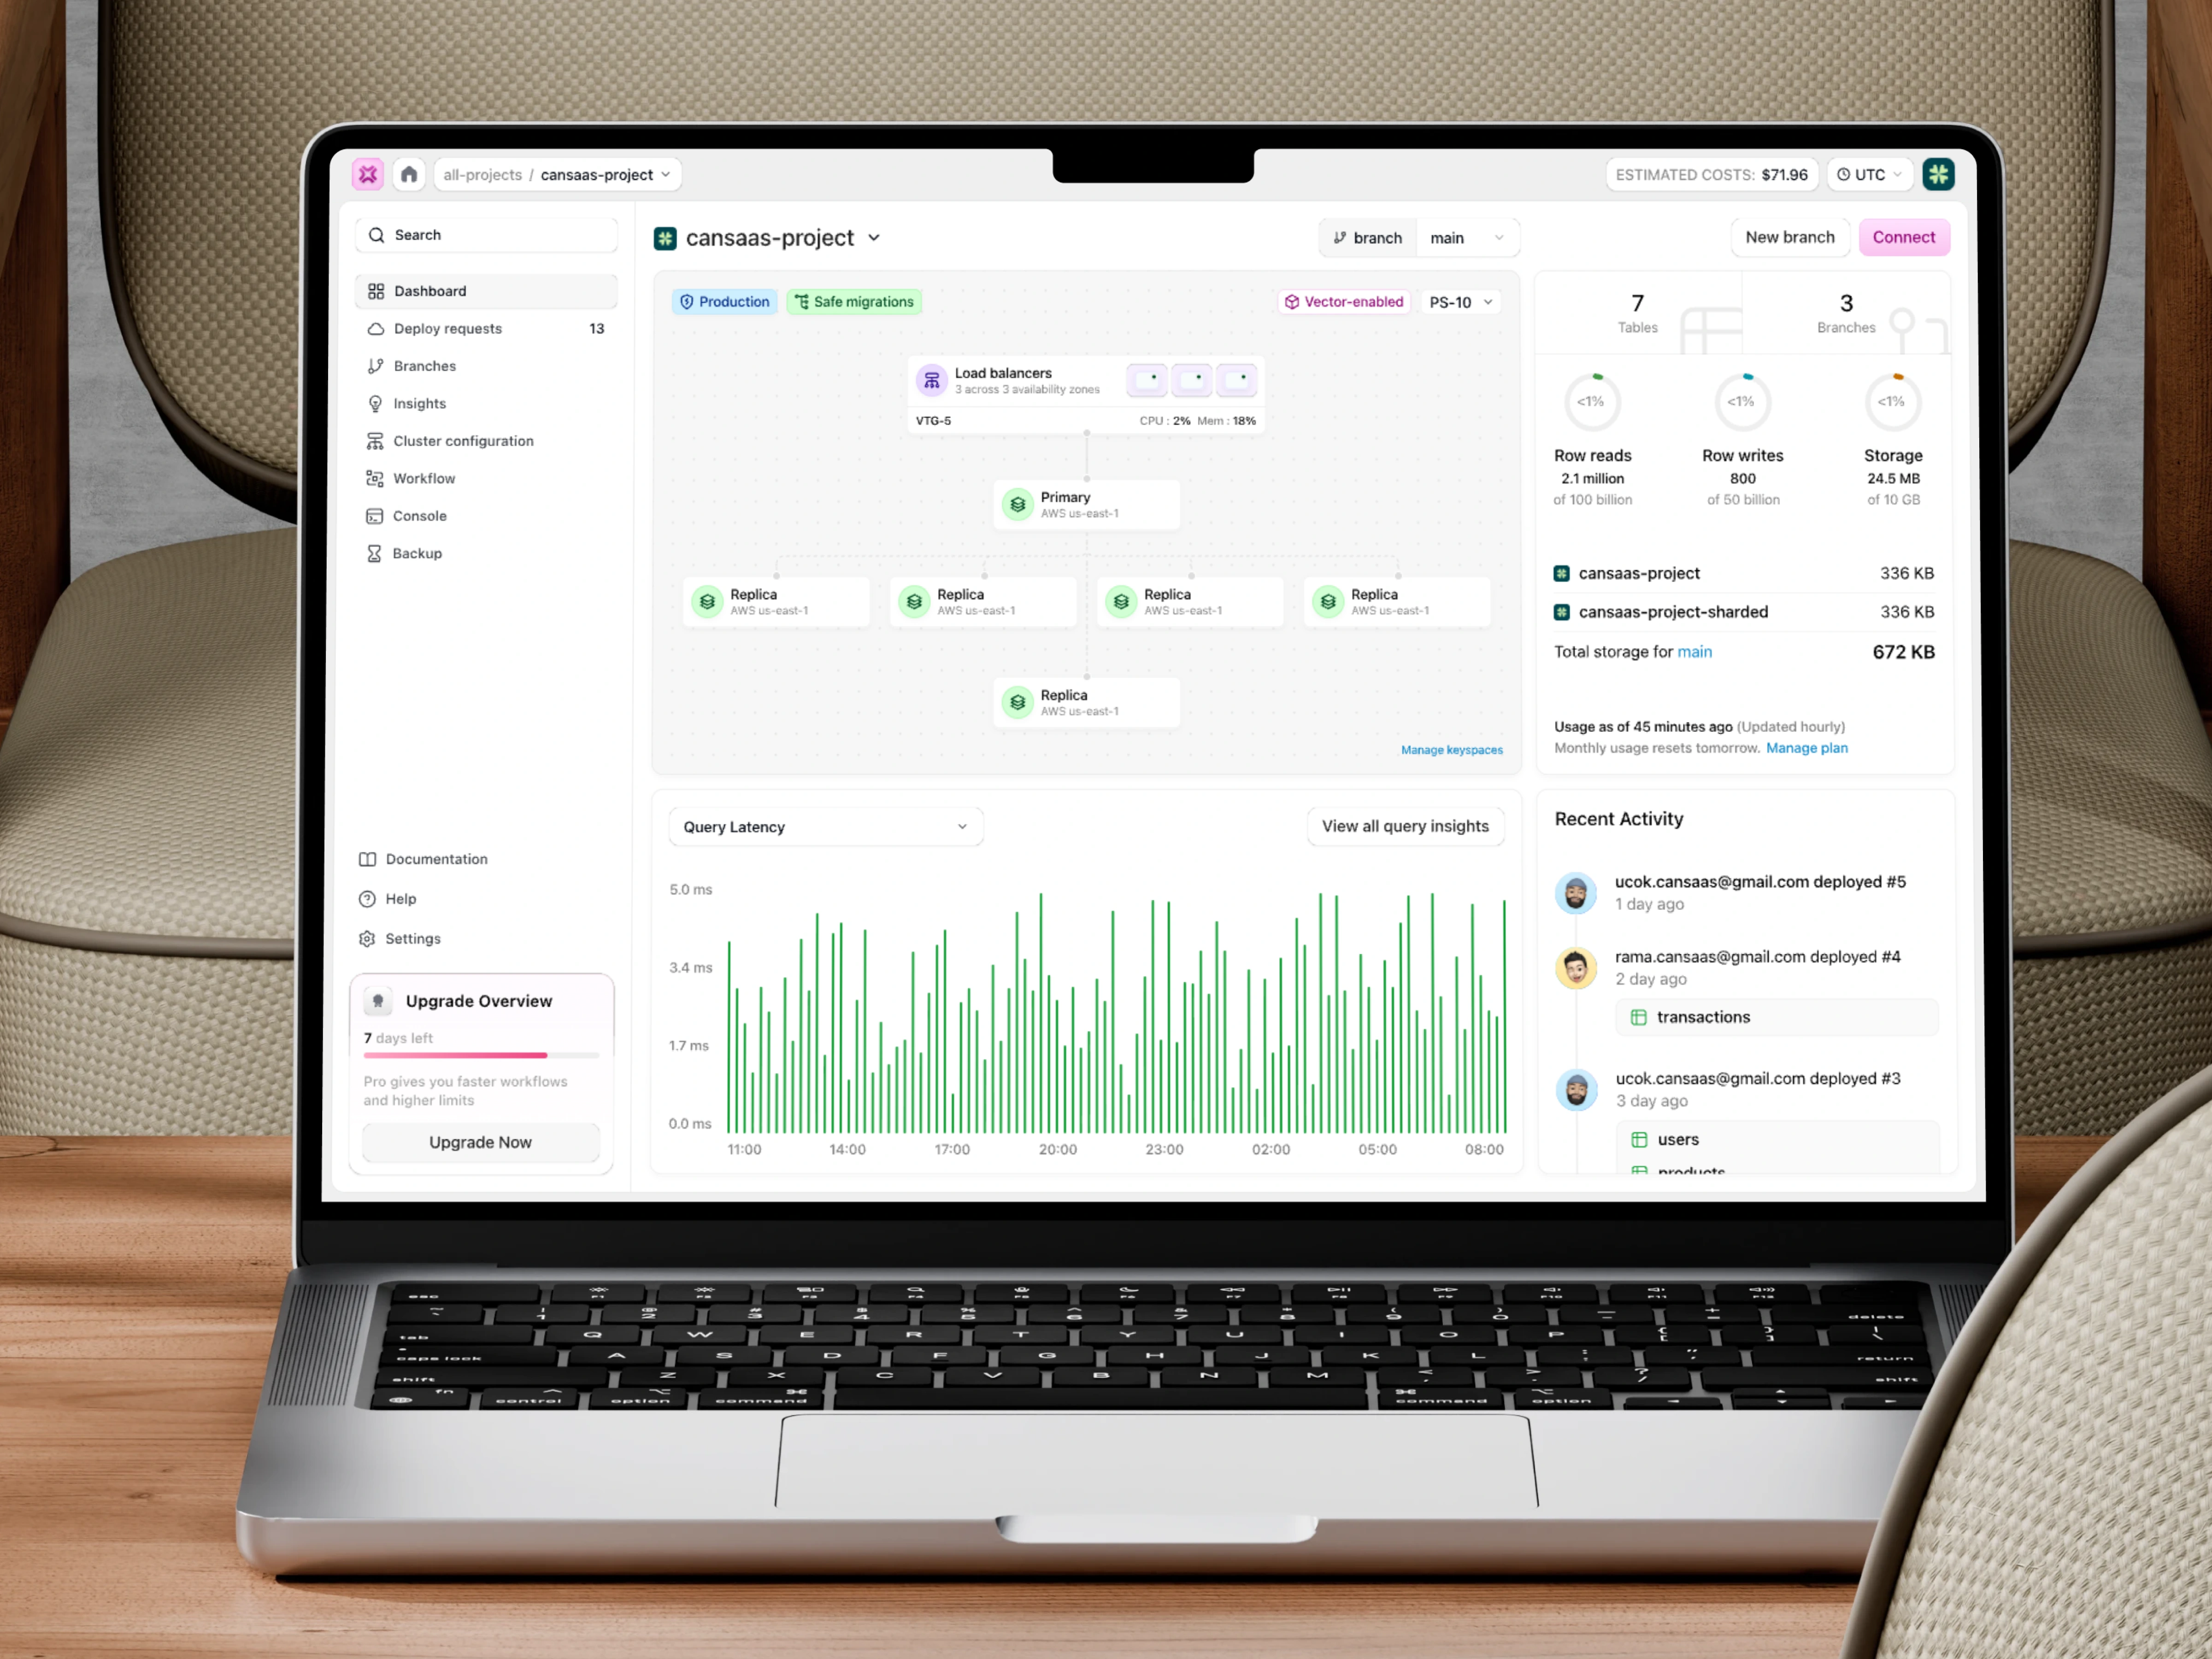
This exploration presents a Serverless Database dashboard designed to help teams monitor infrastructure health, performance, and usage in a clear and scalable environment. The goal is to make complex database architecture feel understandable at a glance.
The Challenge
Serverless and distributed databases often introduce complexity through replicas, regions, and performance metrics. Without a clear visual structure, users can struggle to understand system status, costs, and operational impact in real time.
Recognition Rather Than Recall
Minimize the user’s memory load by making information visible and easy to interpret, rather than requiring users to mentally process raw data.
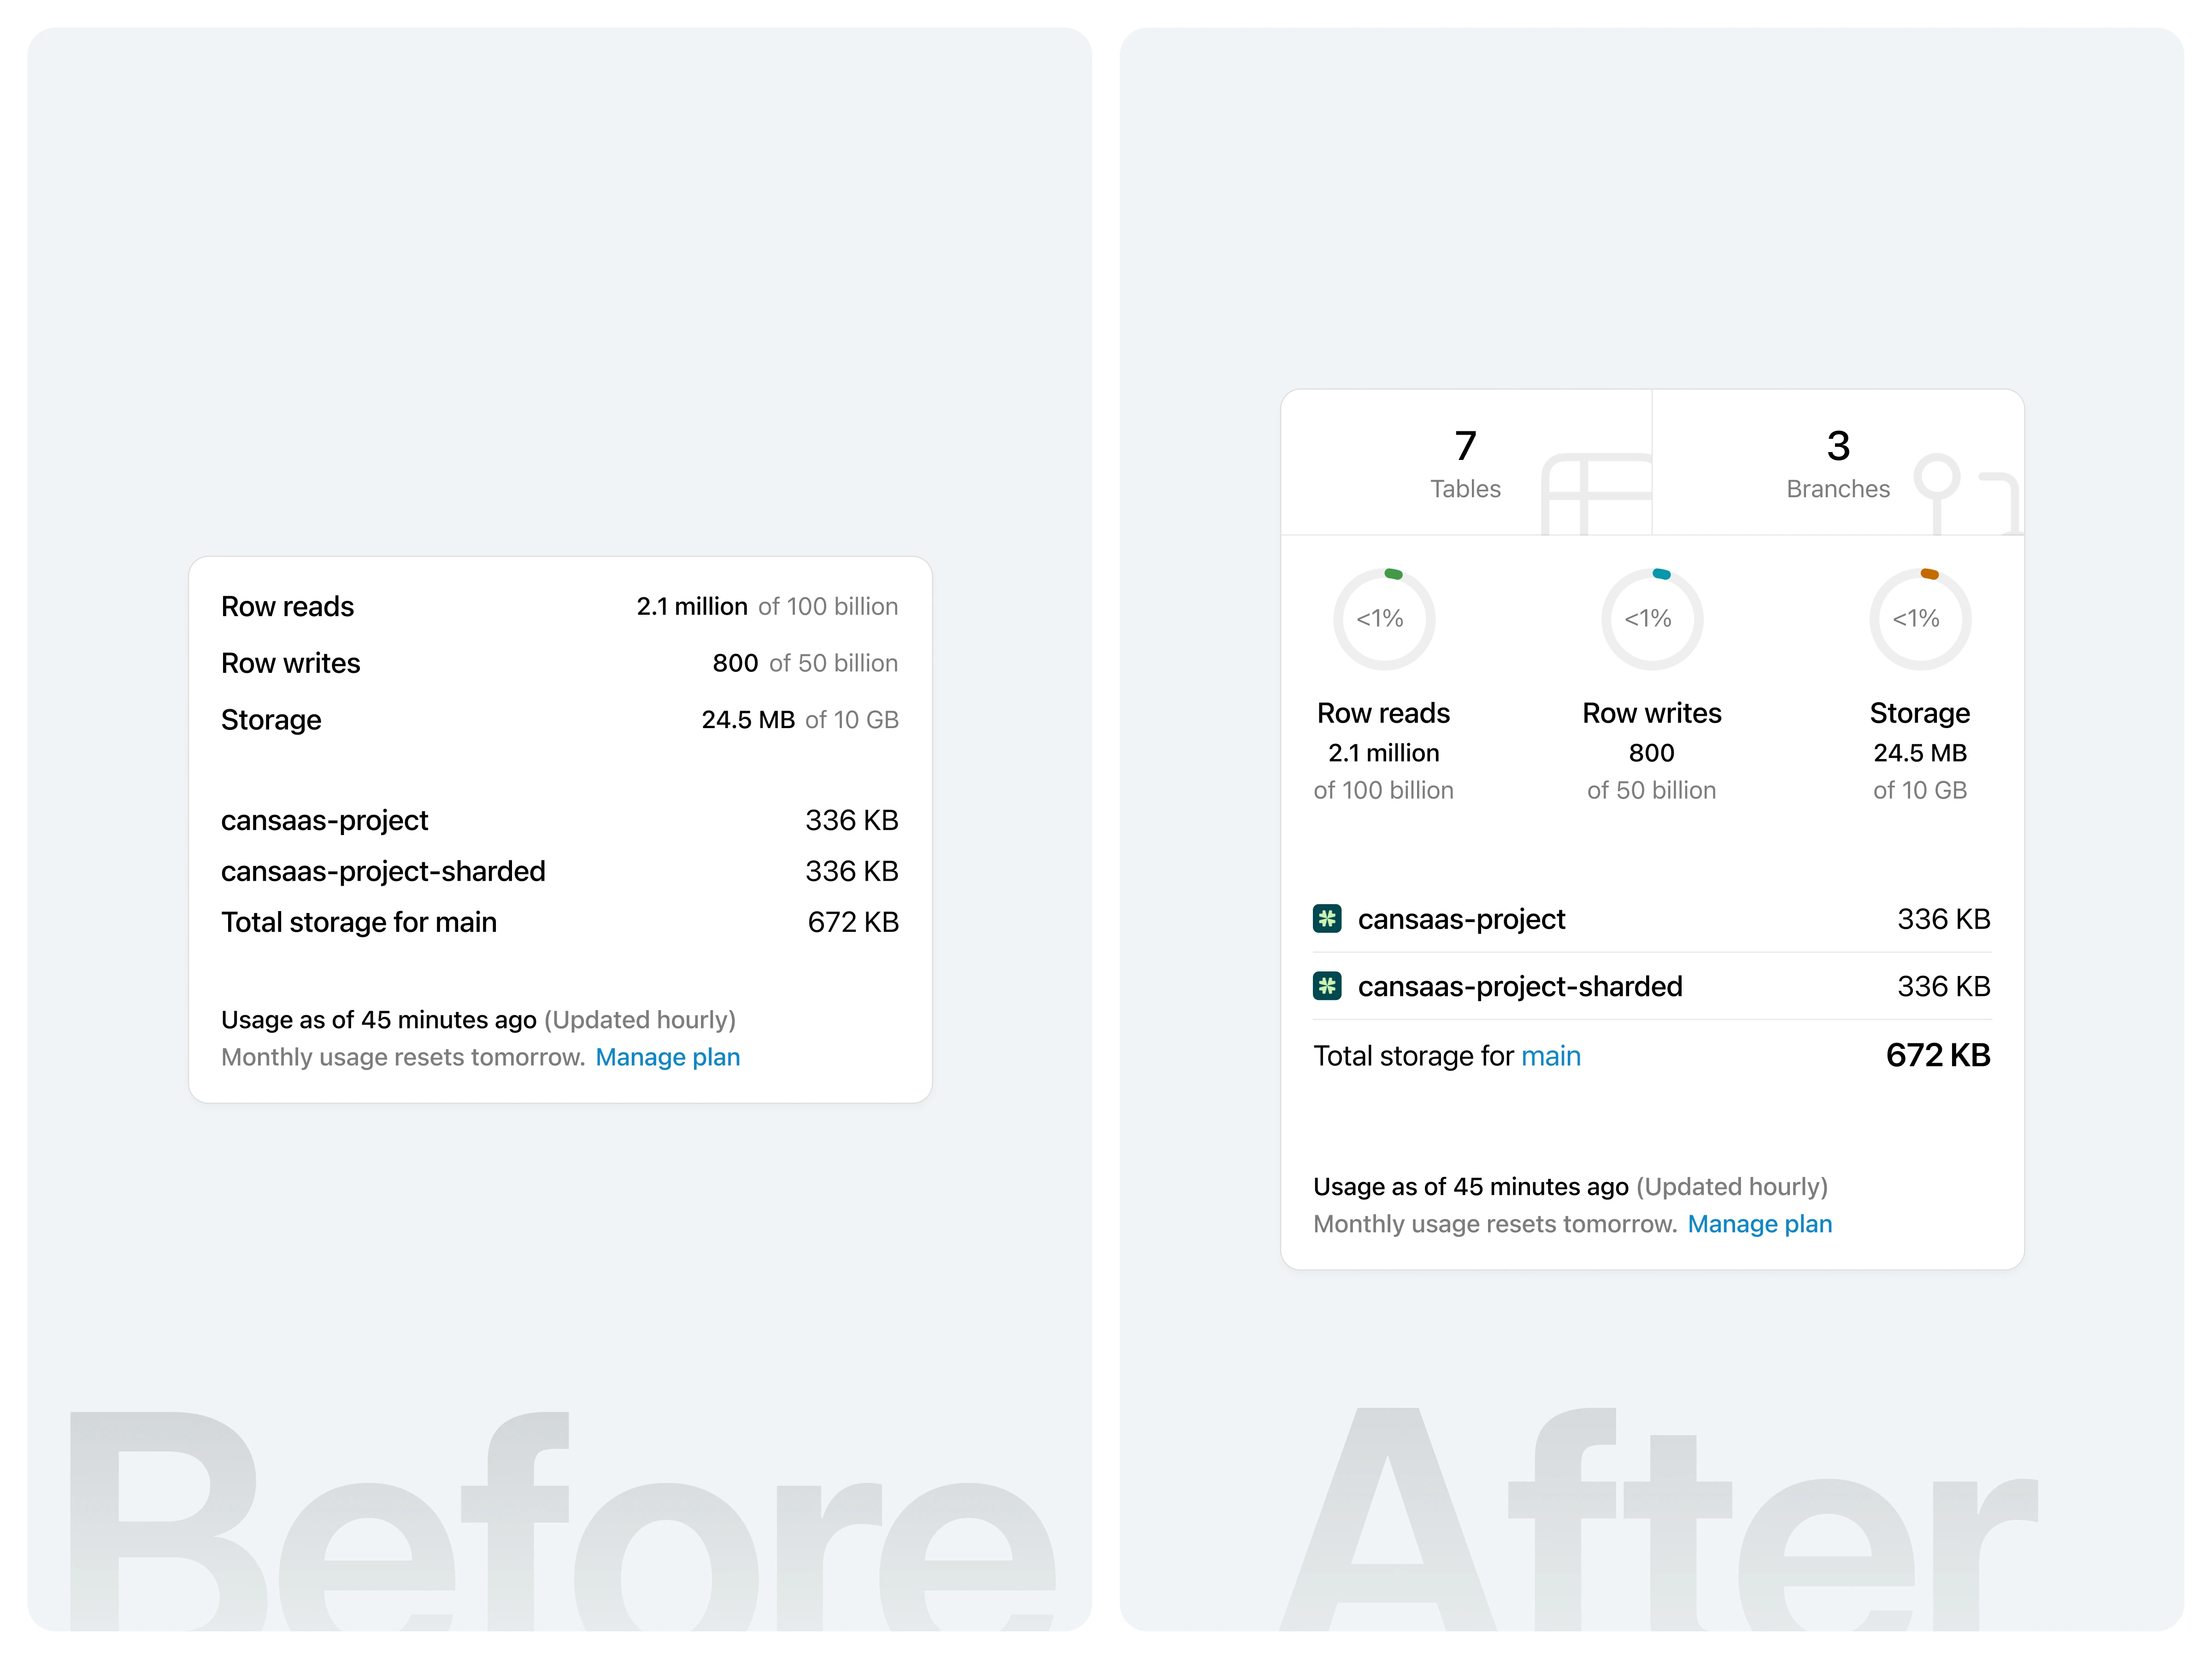
In the initial version, usage information such as row reads, row writes, and storage was presented as plain text values in a compact list. Although the data was technically complete, users had to manually interpret how significant each number was in relation to its limit. There was no immediate visual cue to indicate usage proportion, making it harder to quickly assess system health or capacity at a glance.
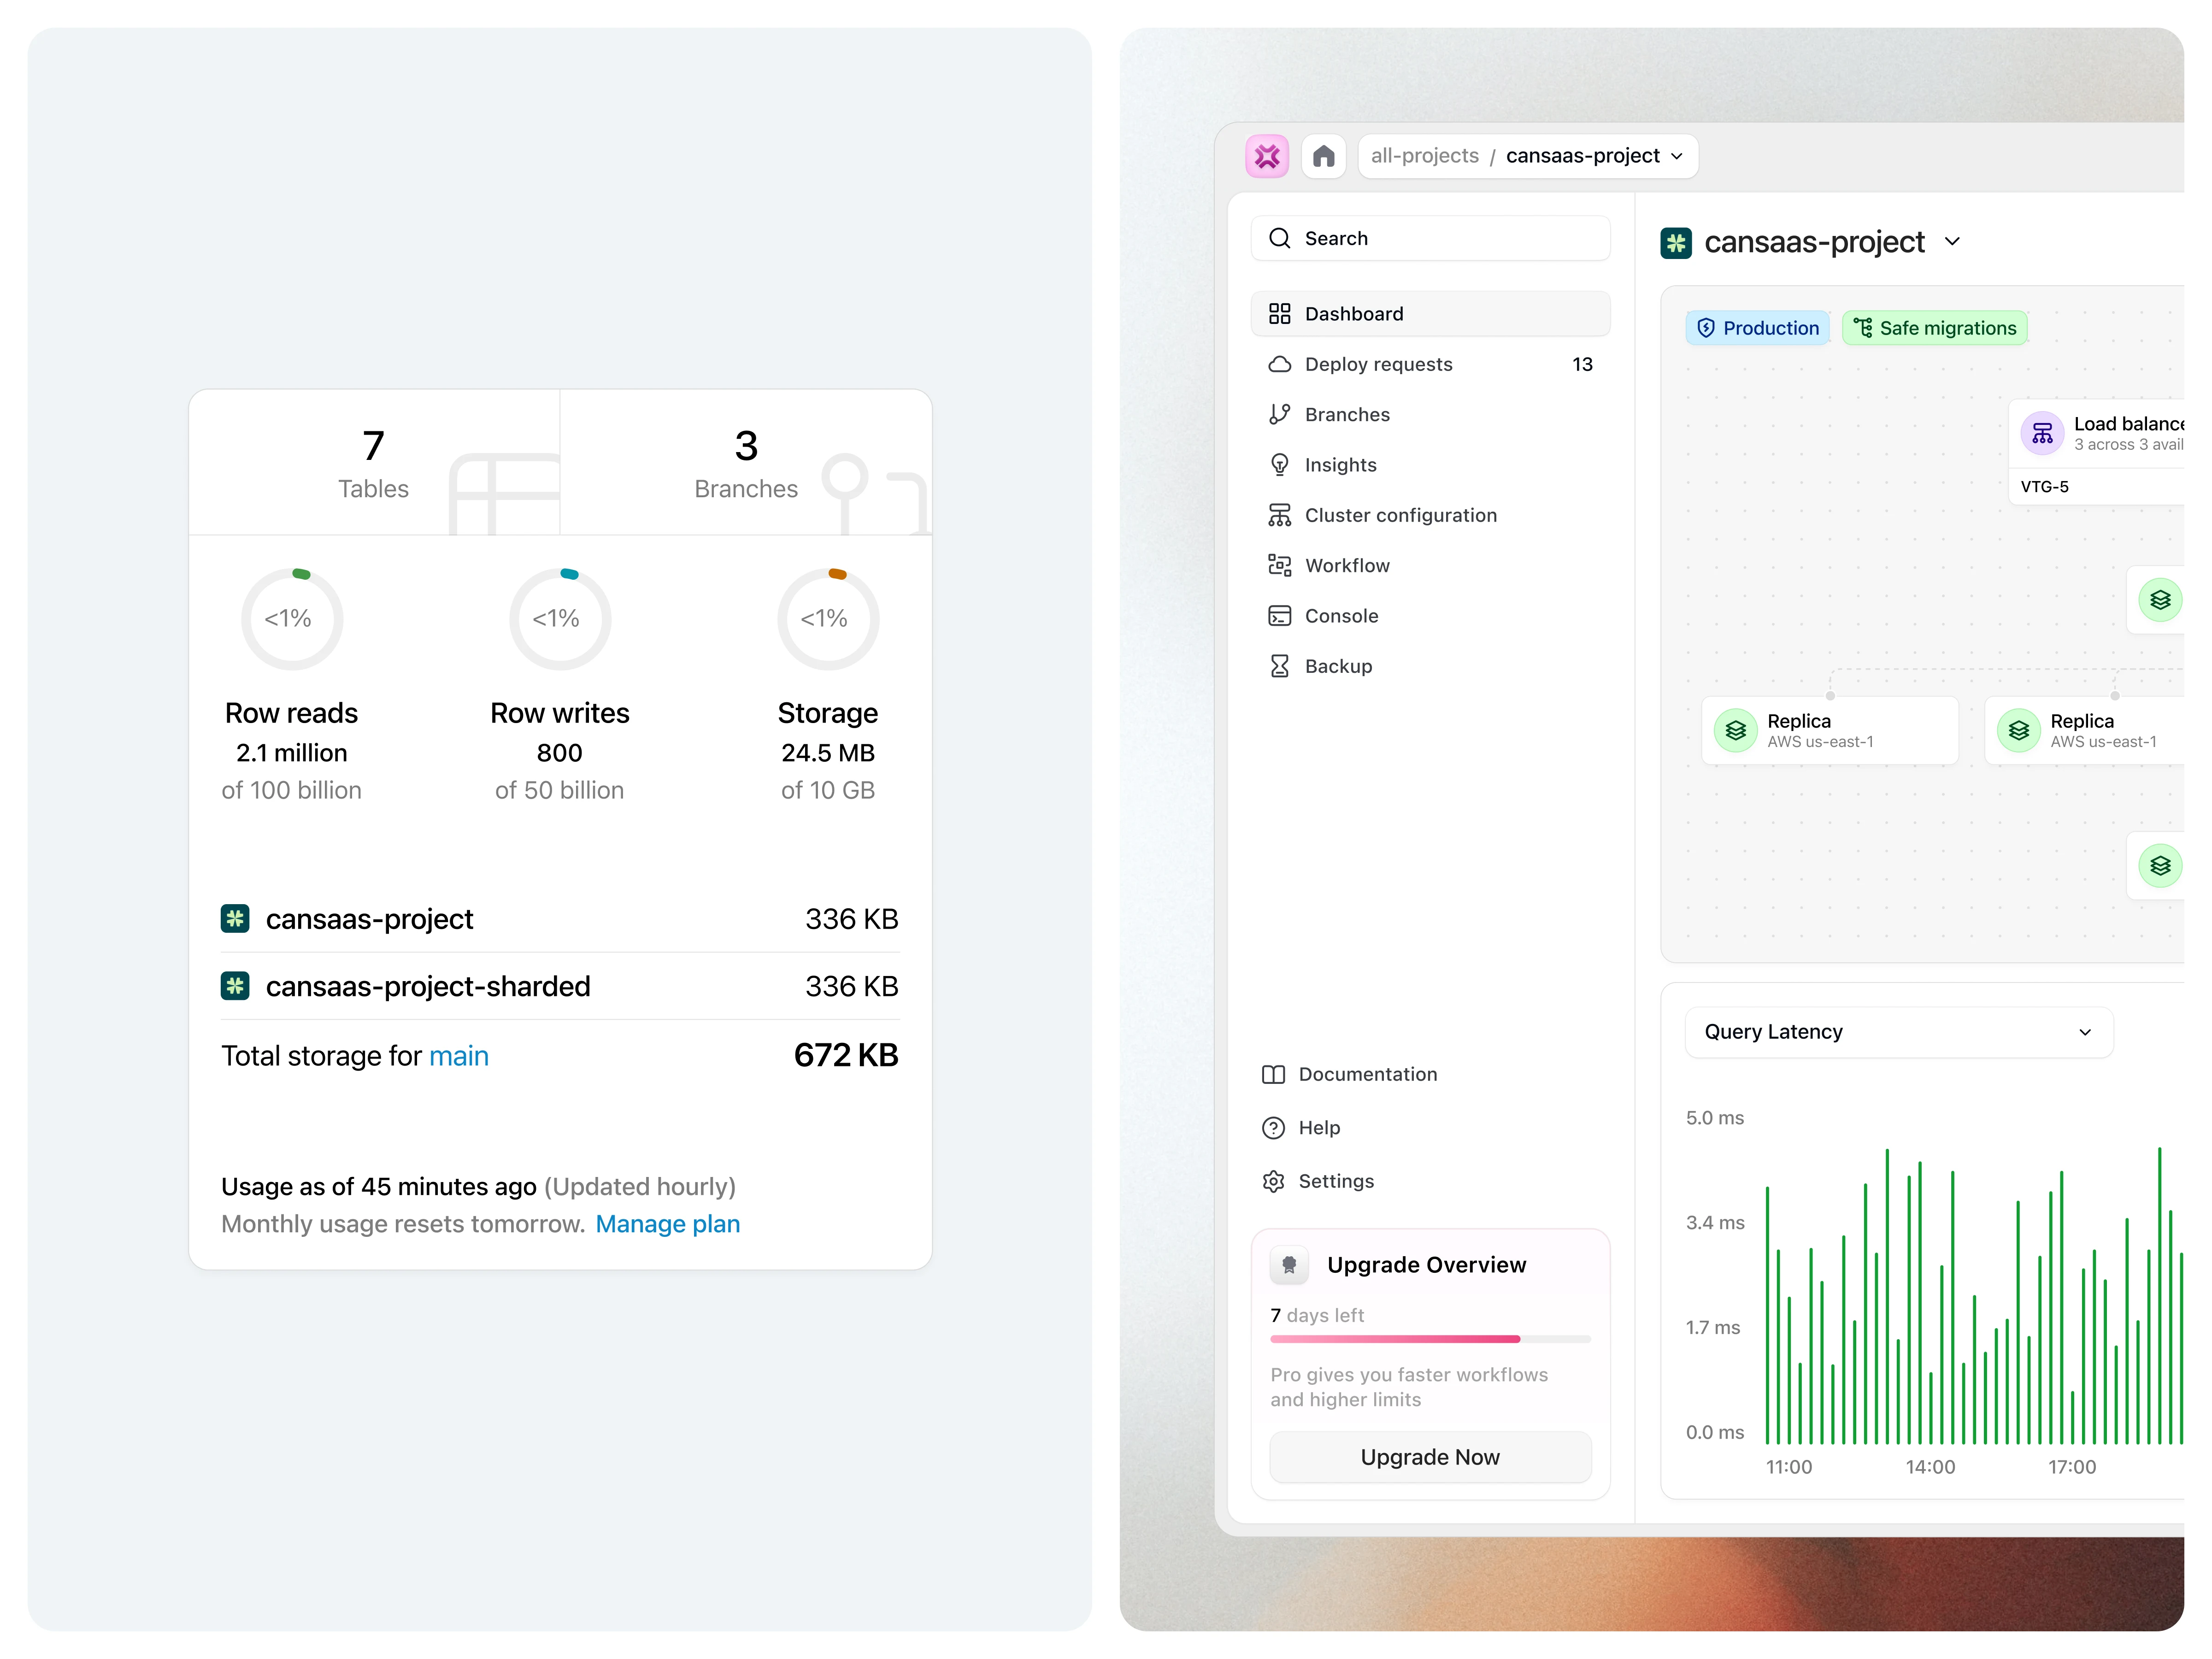
In the improved version, key usage metrics are enhanced with visual indicators such as circular progress rings and clearer grouping. These visual cues instantly communicate relative usage (e.g., “<1%”) without requiring users to calculate or recall limits. The addition of top-level summaries like table and branch counts further strengthens information hierarchy, allowing users to scan and understand system status more efficiently. Overall, the interface shifts from raw data presentation to intuitive recognition, reducing cognitive load and improving decision-making speed. (src: Jakob Nielsen – 10 Usability Heuristics for User Interface Design)
Key Features Highlighted
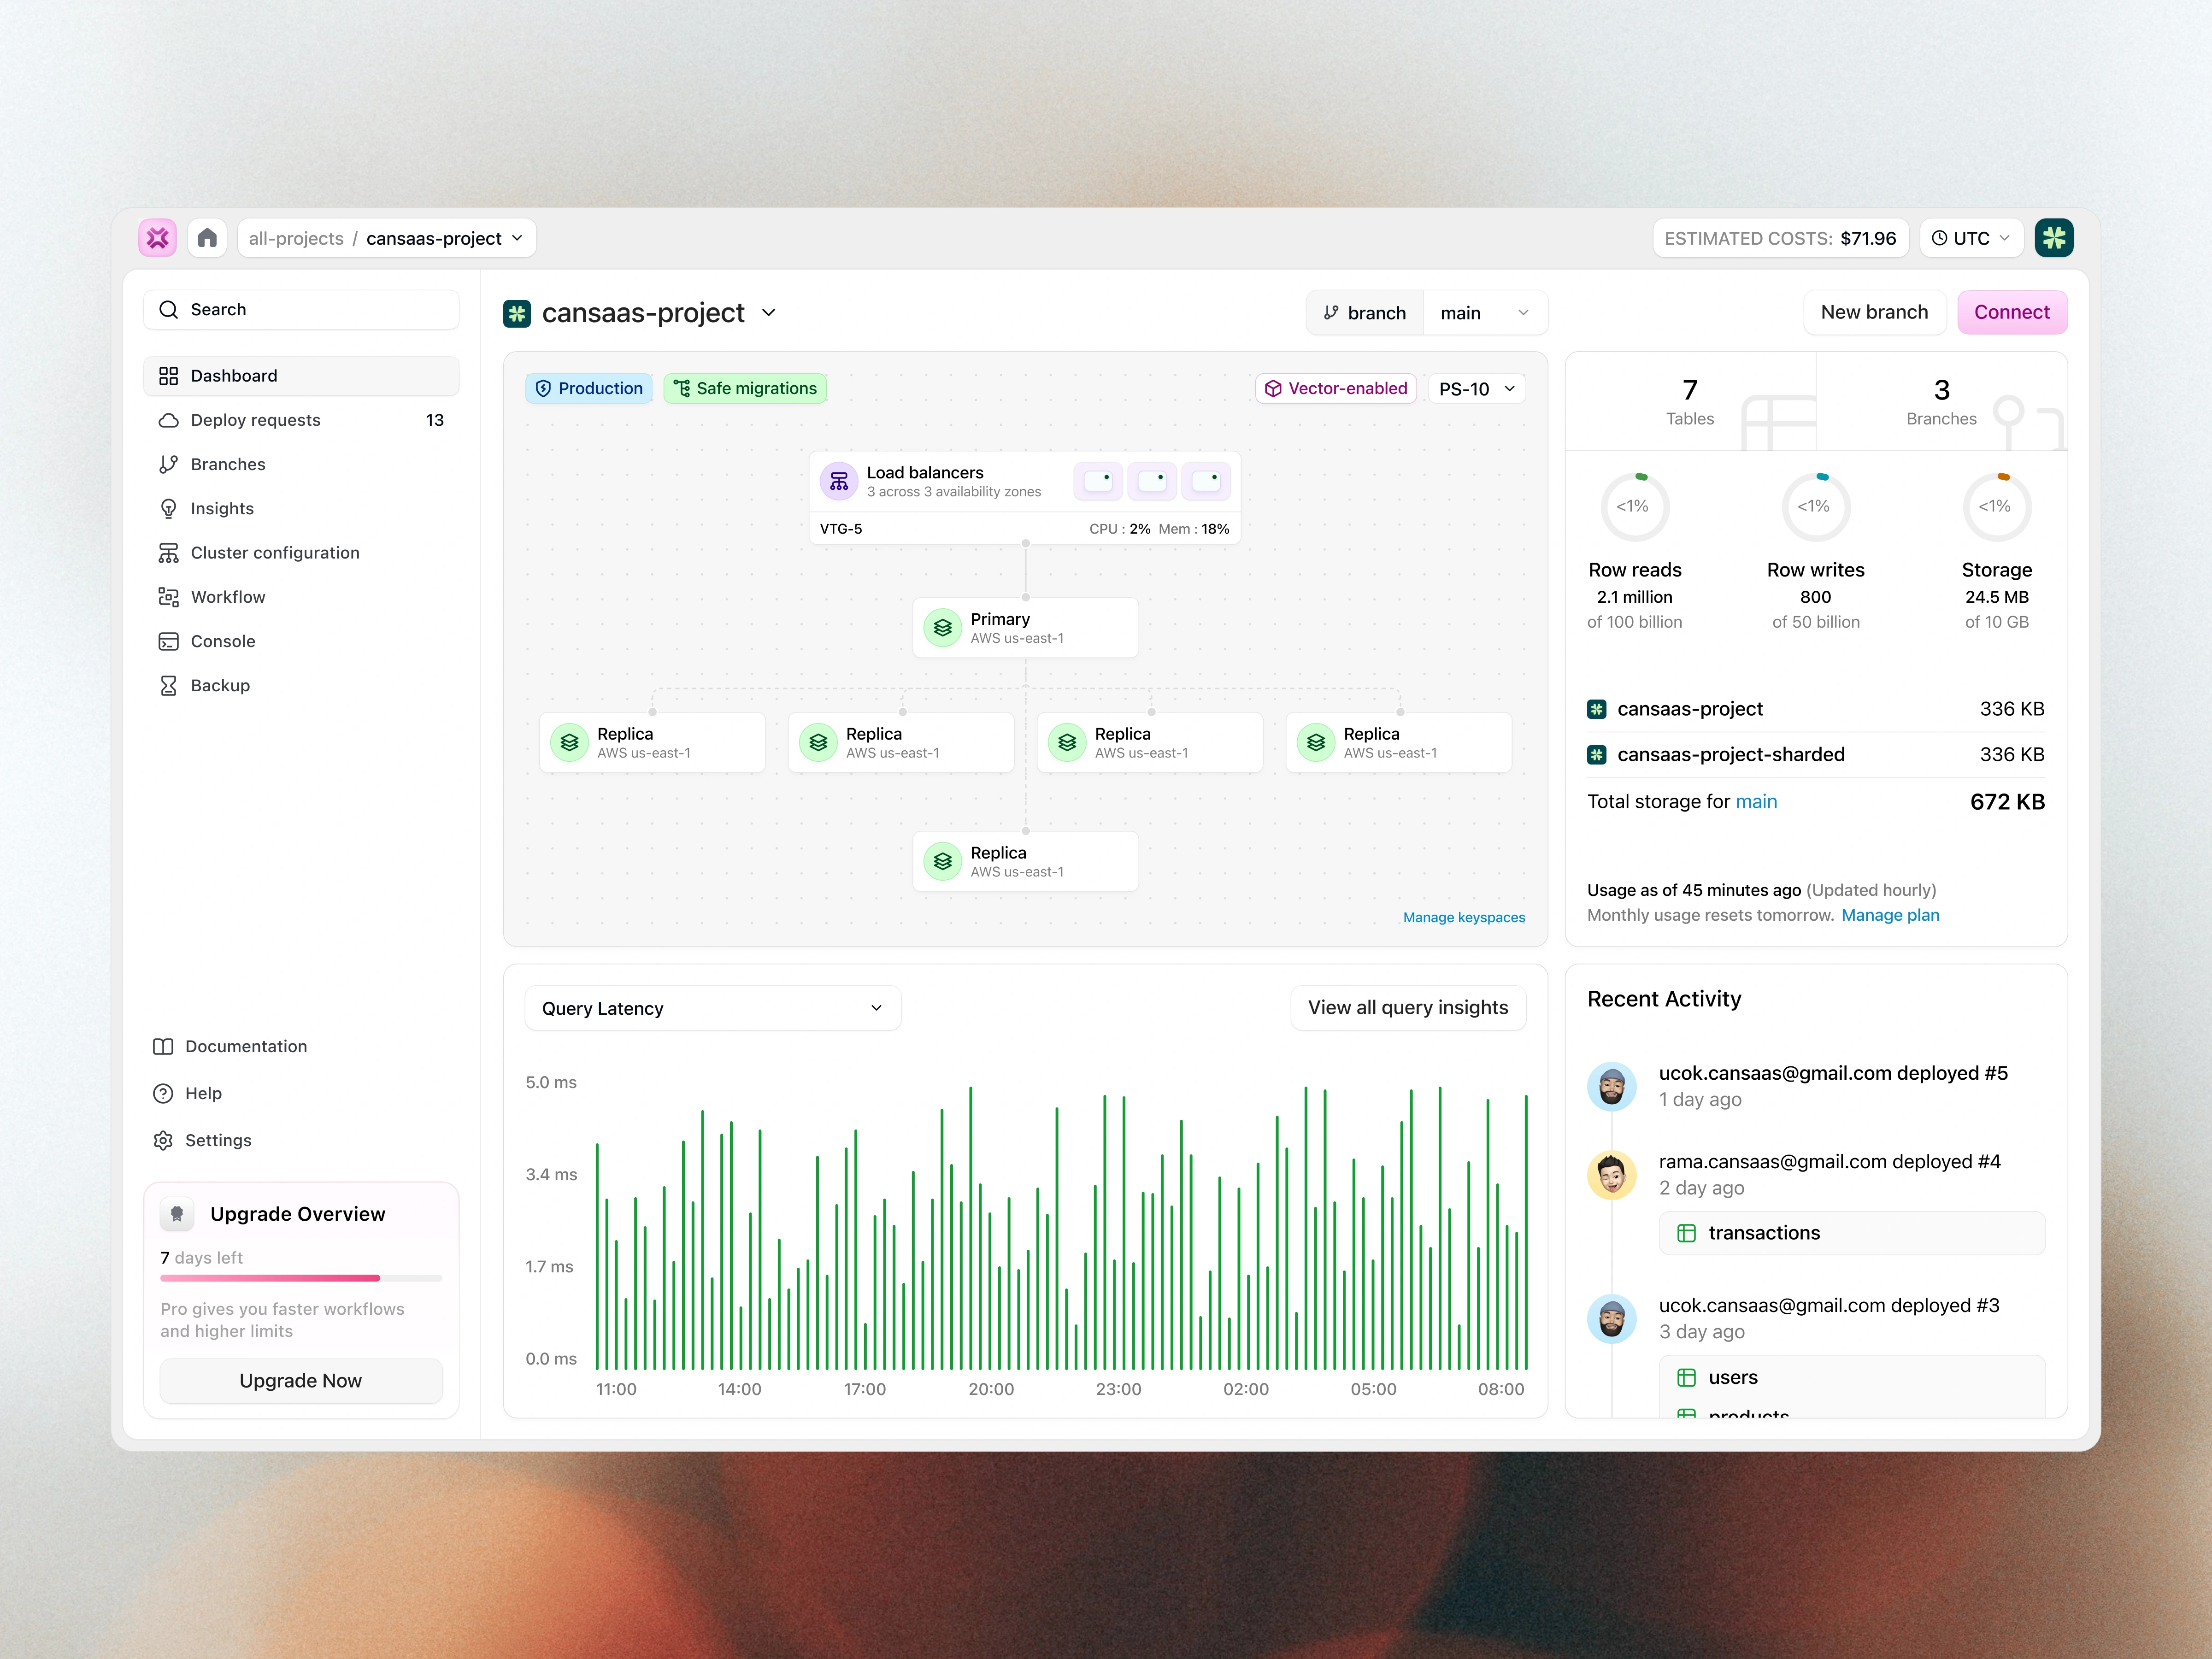
The dashboard highlights cluster topology visualization, read and write metrics, latency monitoring, cost estimation, and recent activity tracking. These elements help users understand both system health and usage patterns instantly.
The Solution and Impact
By visualizing serverless infrastructure in a structured and readable interface, this dashboard enables teams to monitor performance, manage scale, and respond to changes with confidence. The result is a more transparent and trustworthy database management experience.
Like this project
Posted Jan 23, 2026
Serverless database dashboard exploration designed to visualize performance, scalability, and infrastructure health through a clean, system-focused interface.
Likes
2
Views
6