Sales Dashboard
Cansaas Agency
Overview
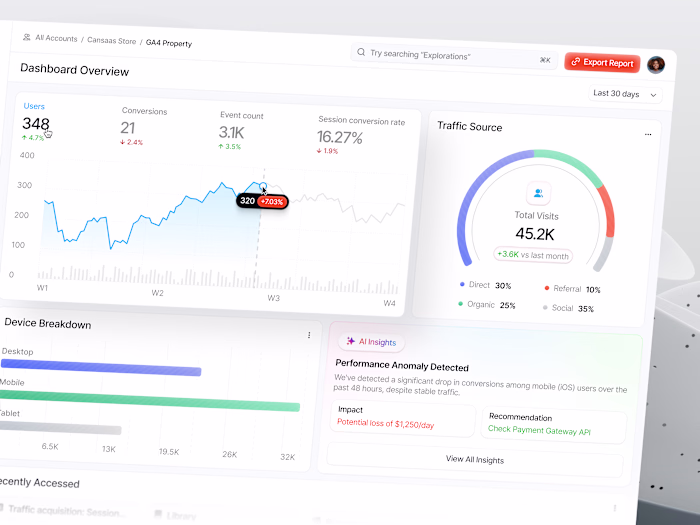
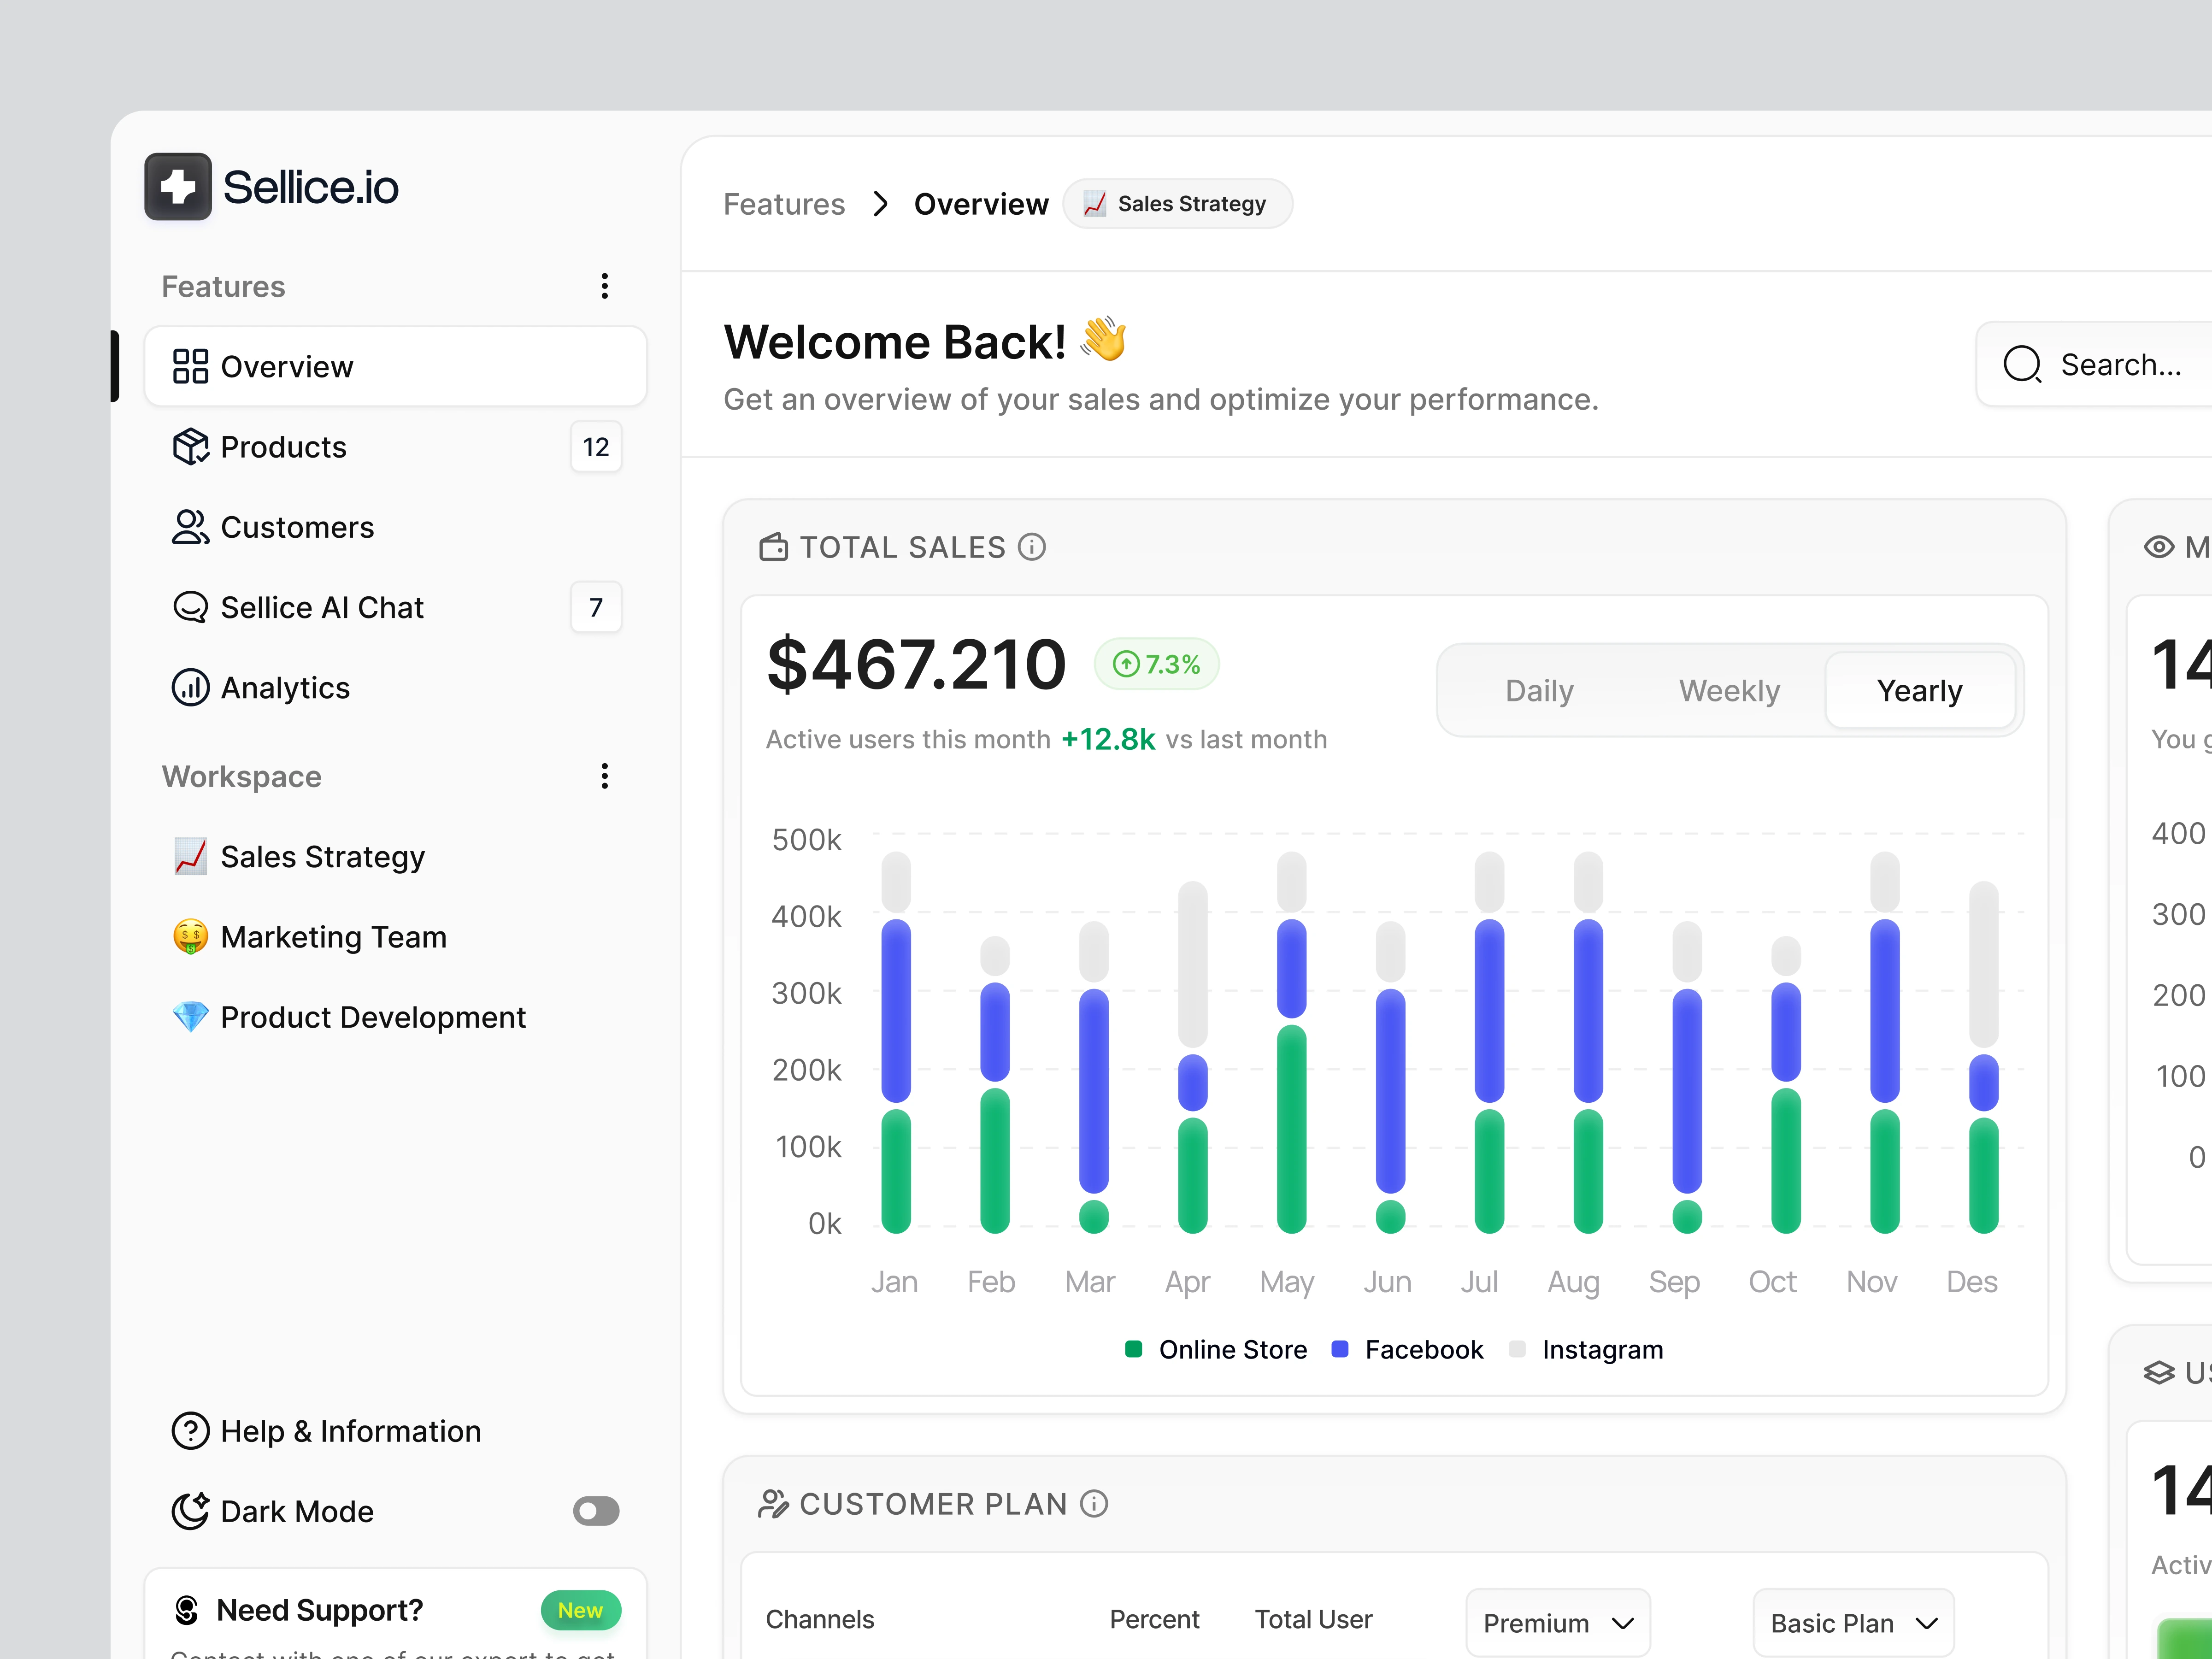
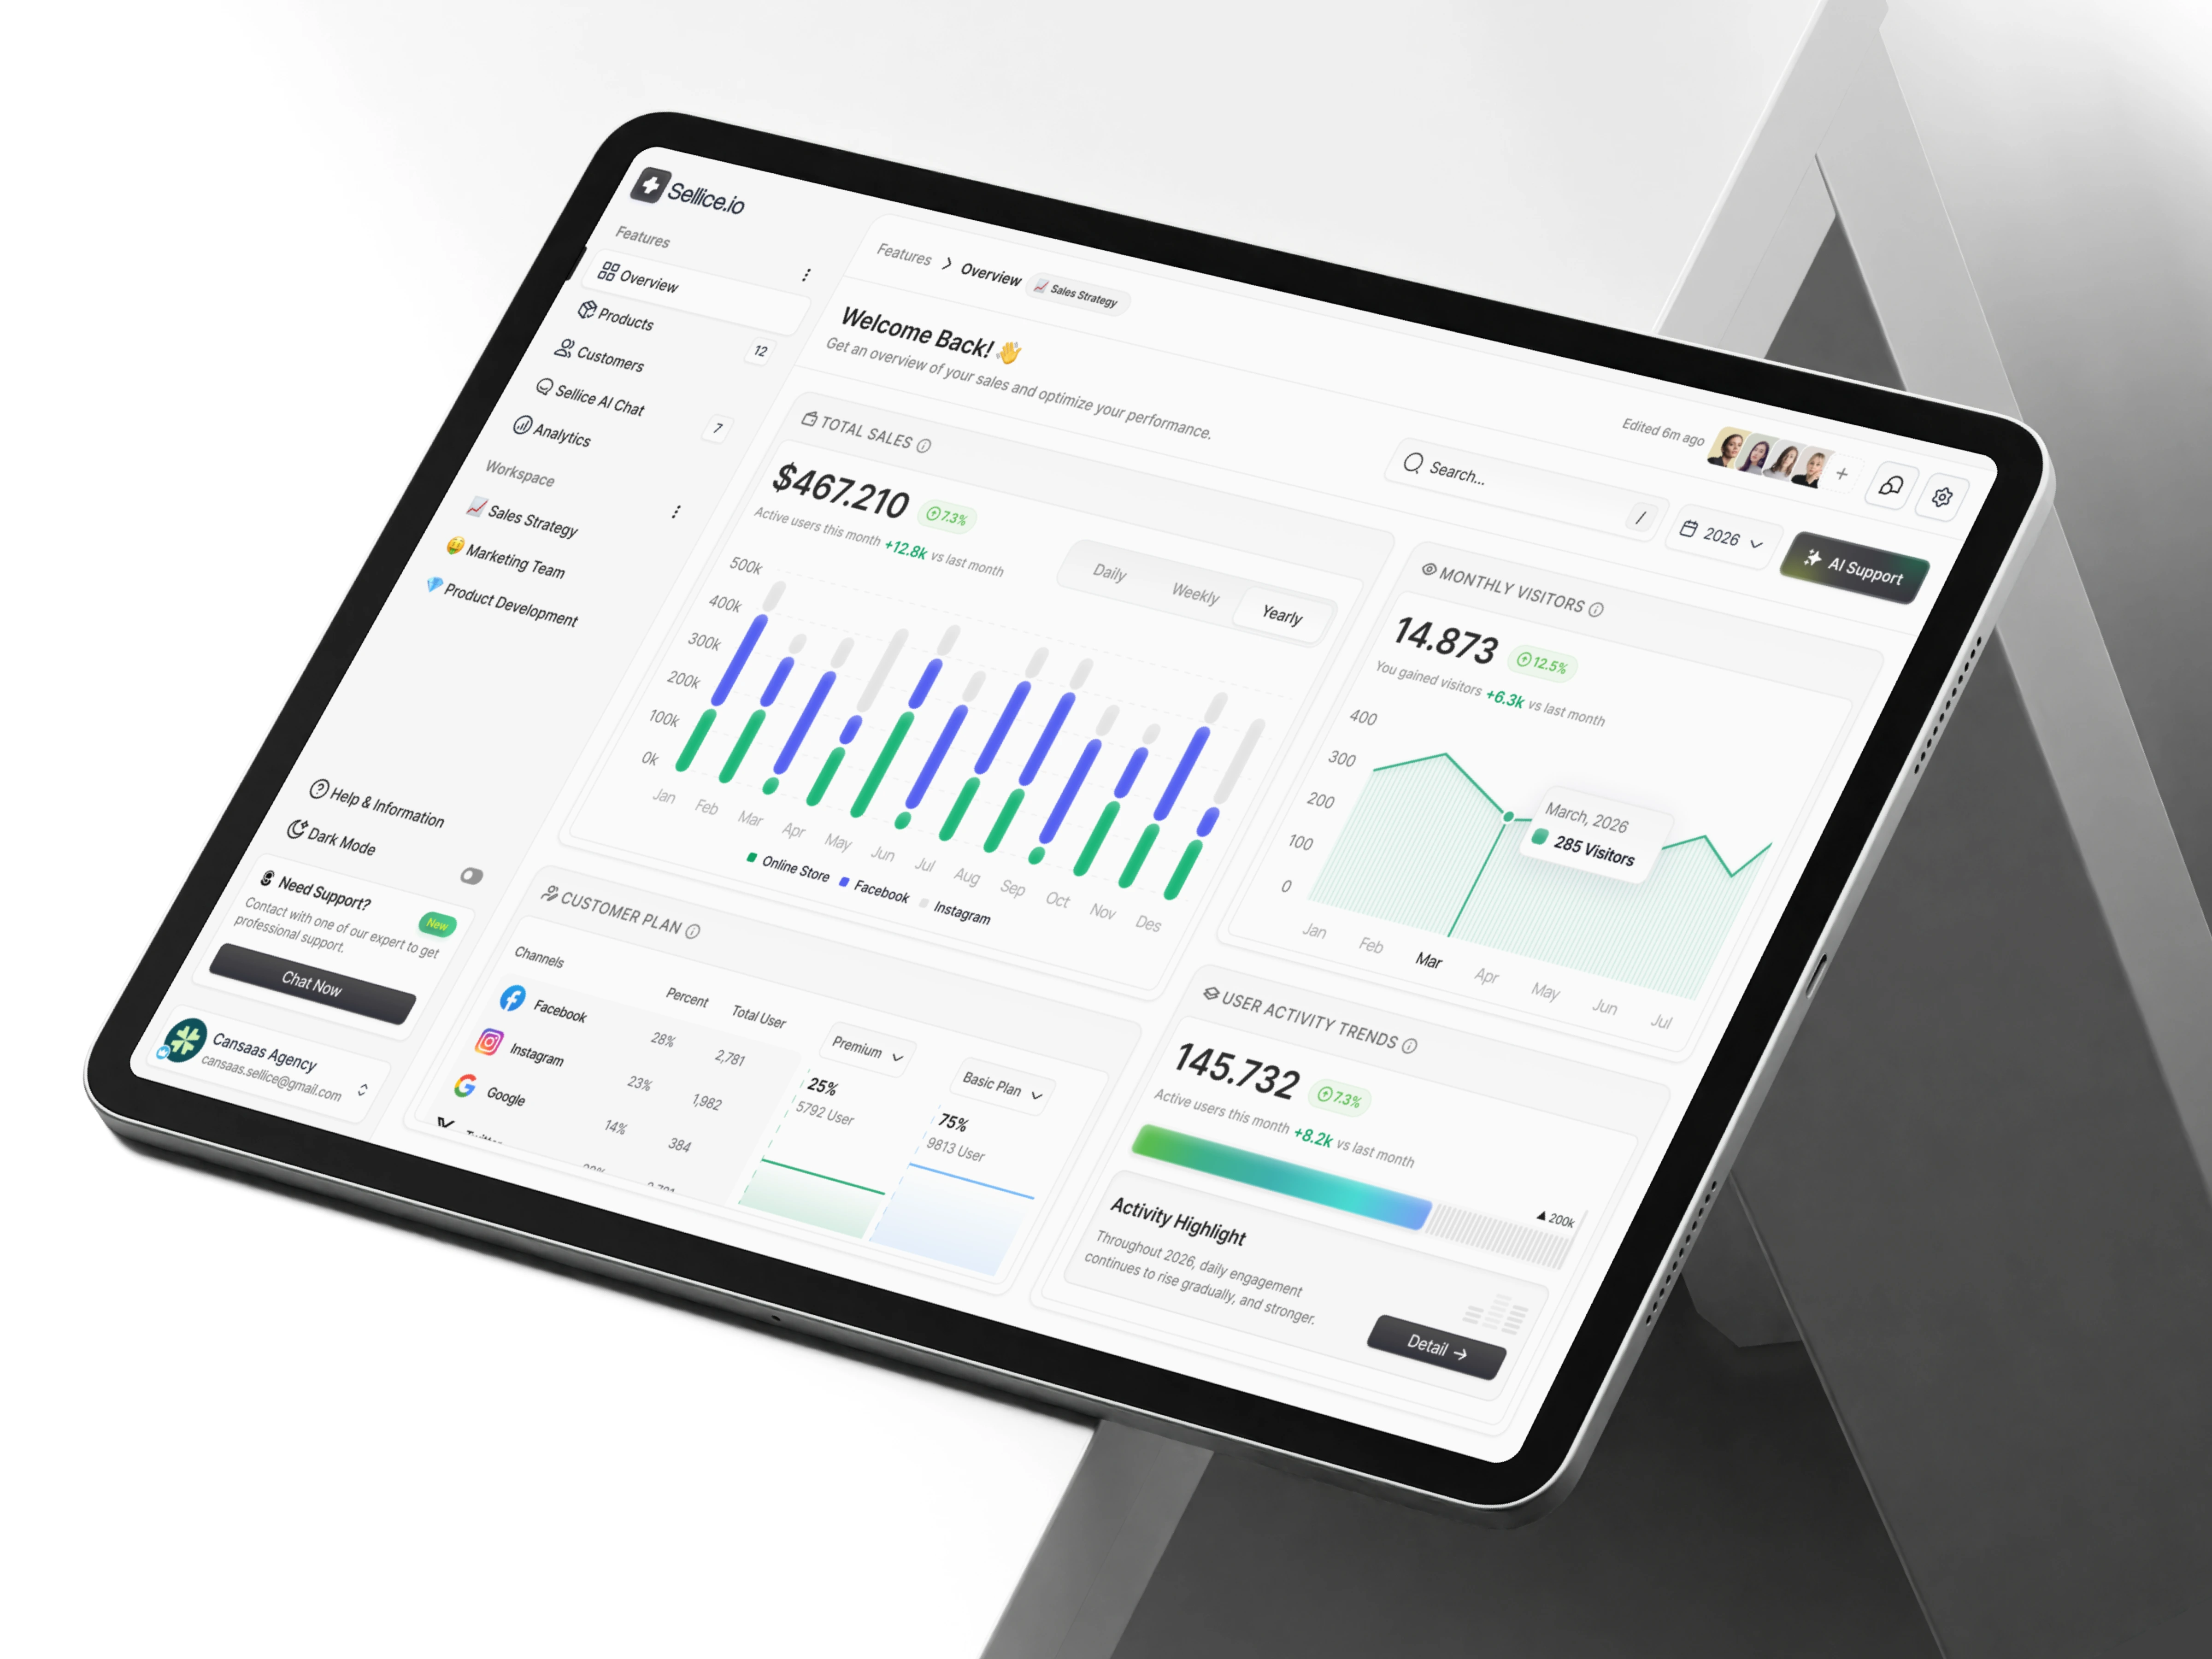
This exploration presents a Sales Dashboard designed to help teams monitor revenue, user activity, and performance trends in a single, structured workspace. The focus is on clarity, real-time insights, and decision-ready data.
The Challenge
Sales teams often deal with fragmented metrics spread across multiple tools. This makes it difficult to quickly understand performance, identify growth opportunities, and respond to changes in user behavior. The challenge was to consolidate key sales and activity data into a dashboard that feels clear and actionable.
Design Approach
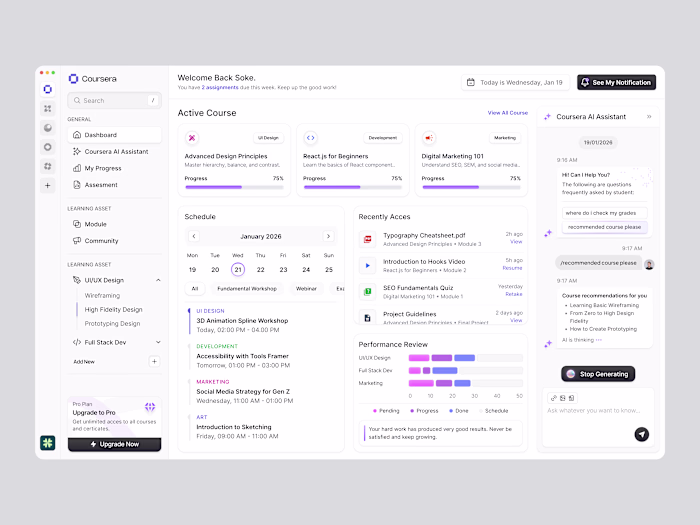
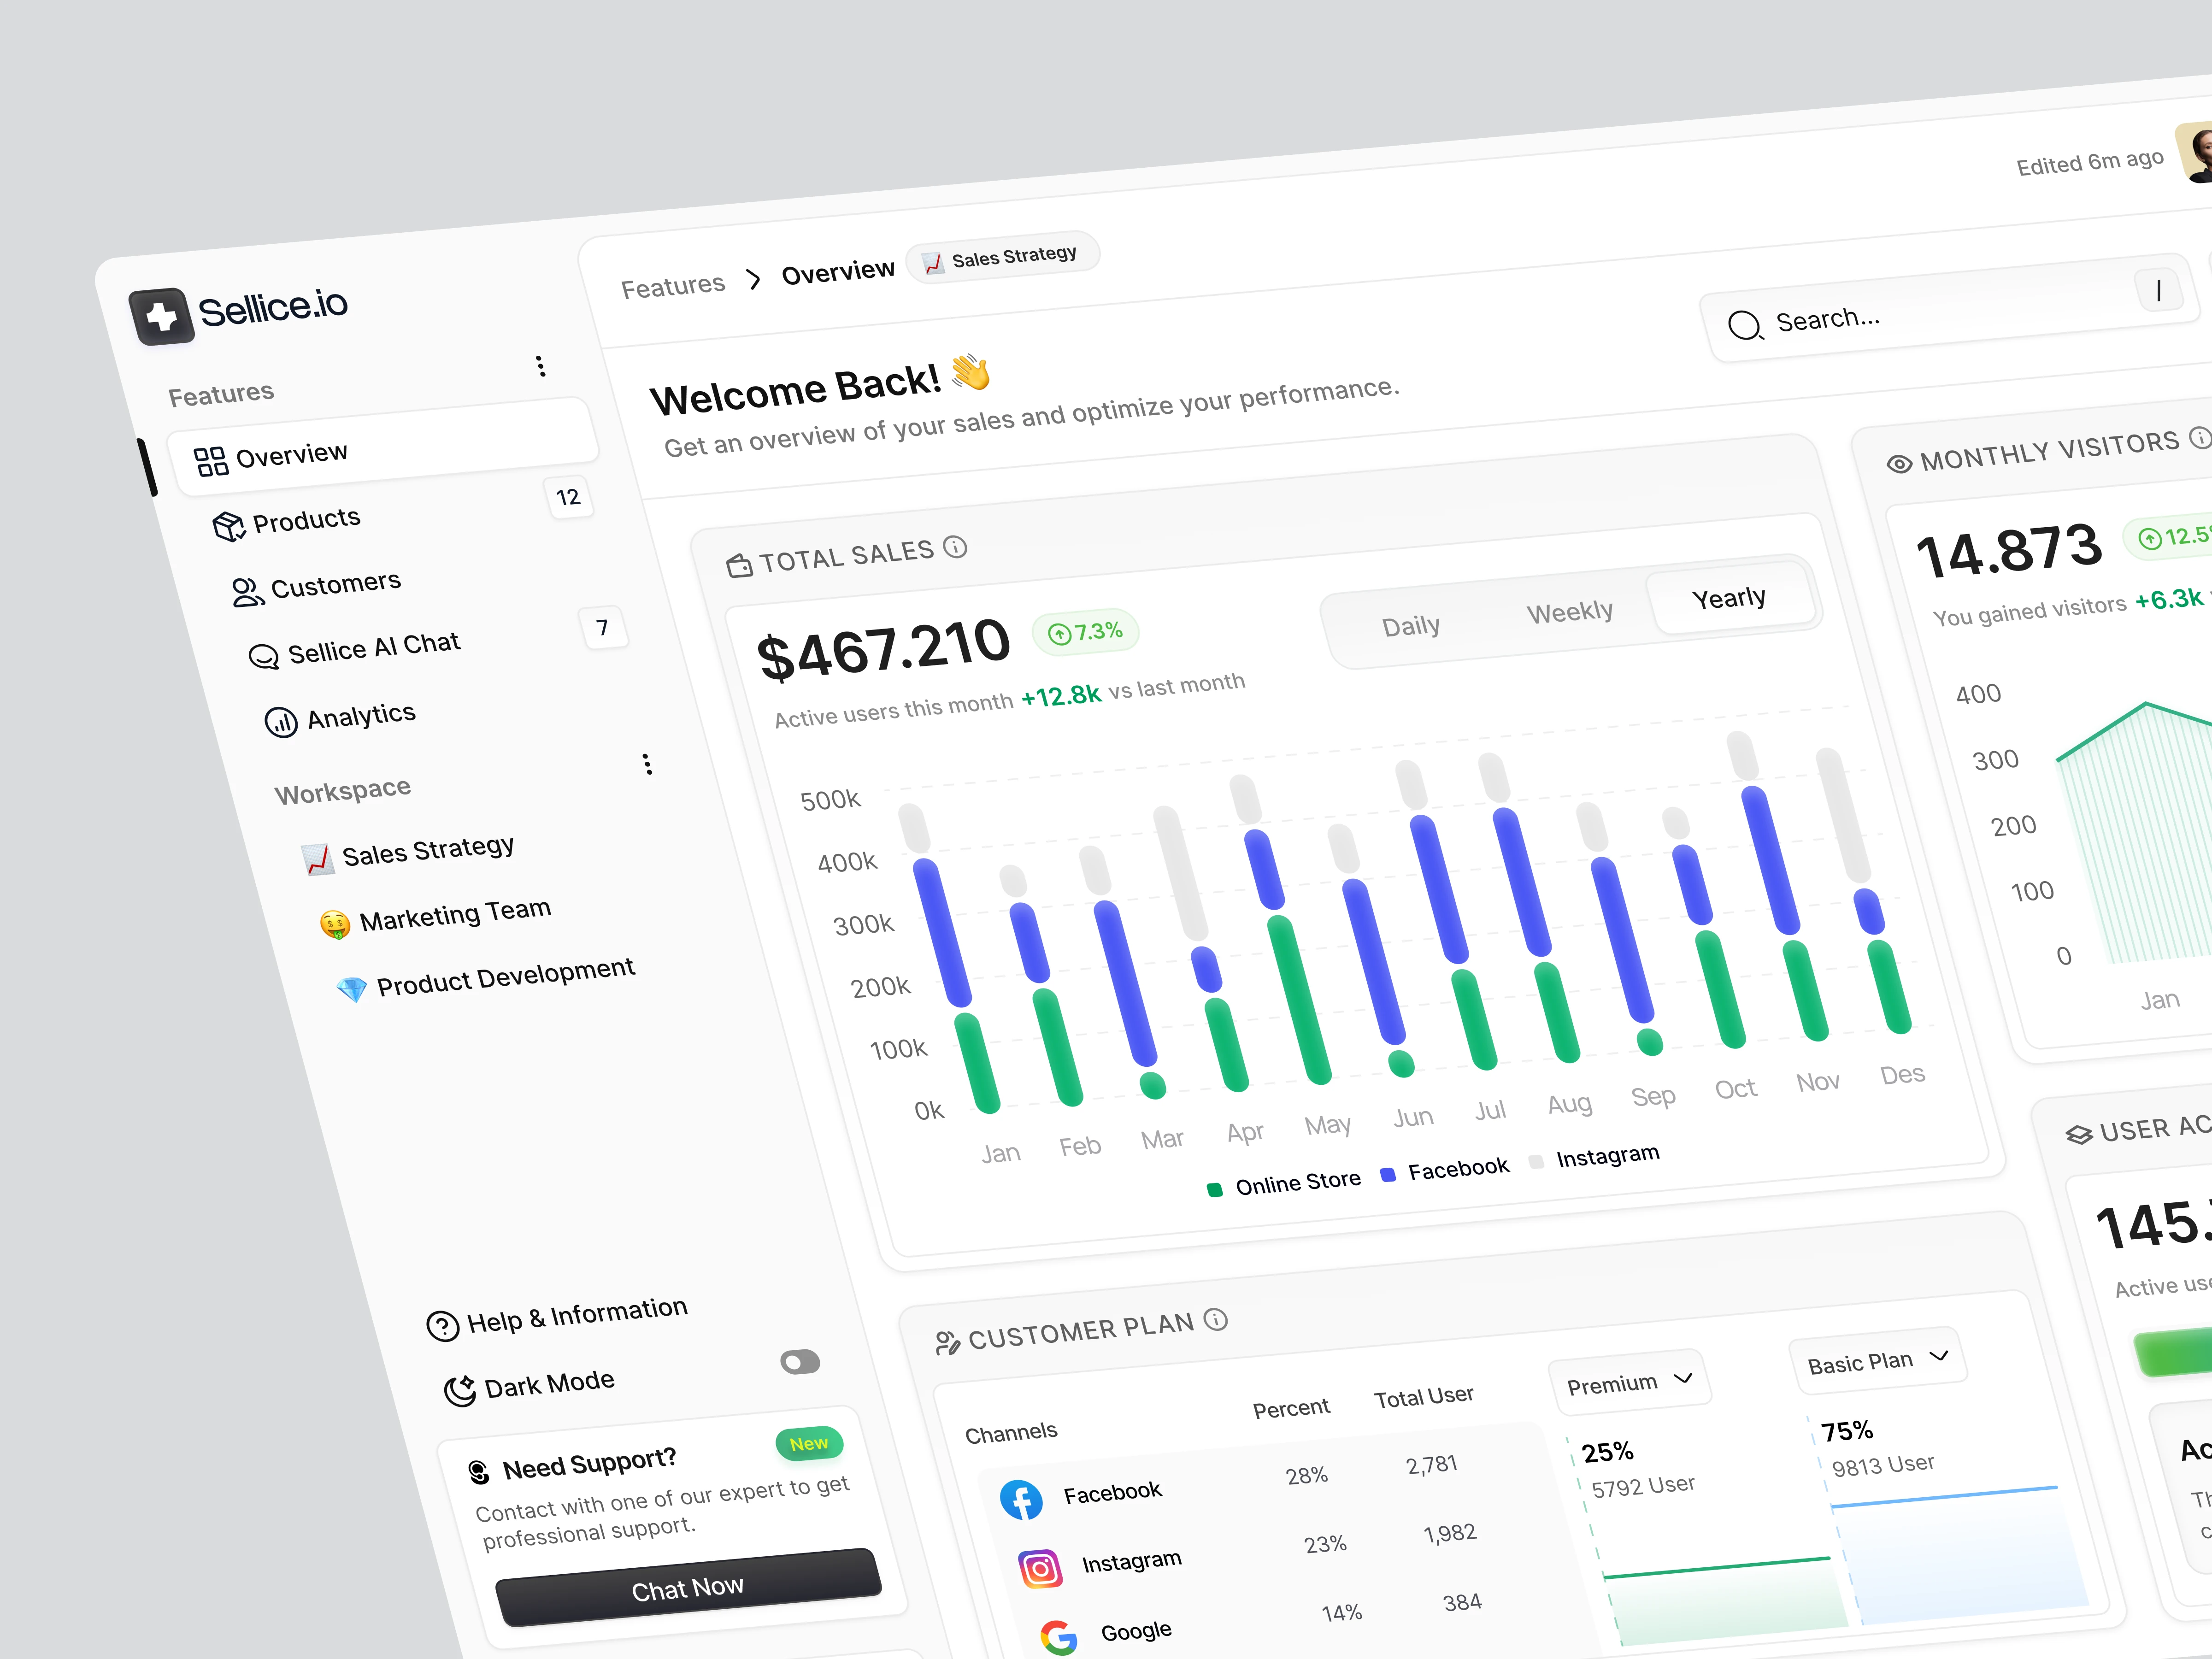
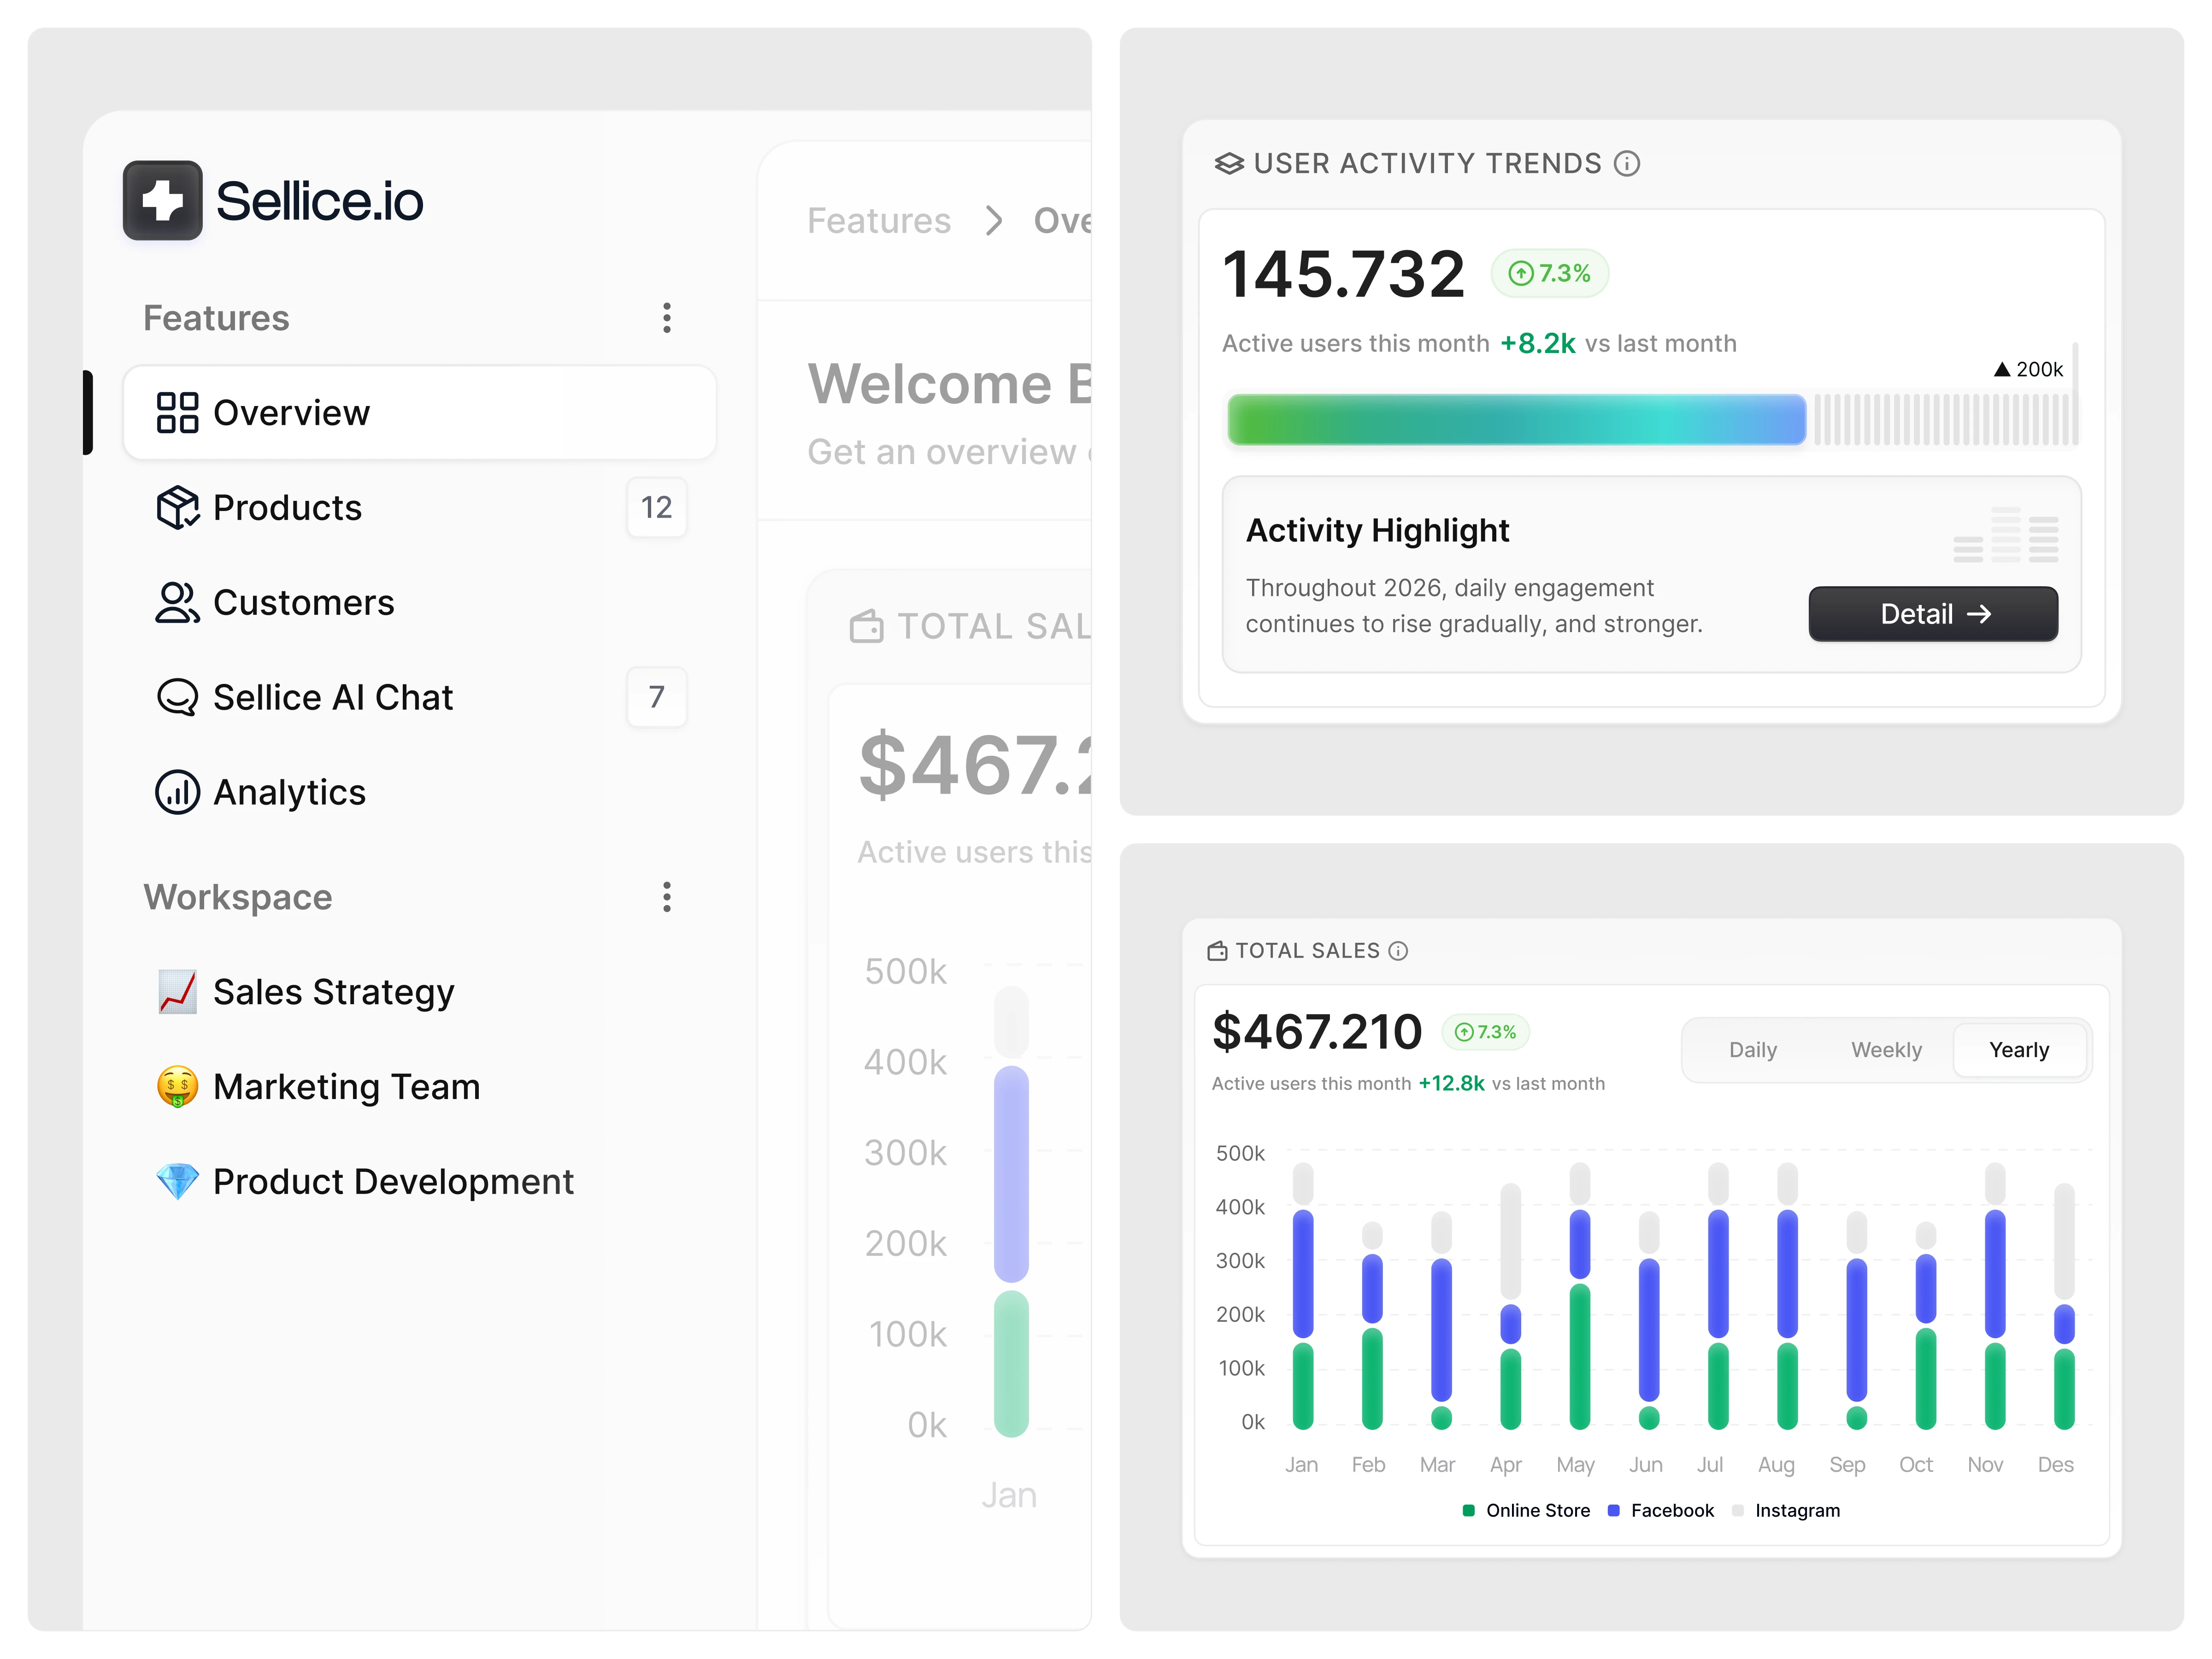
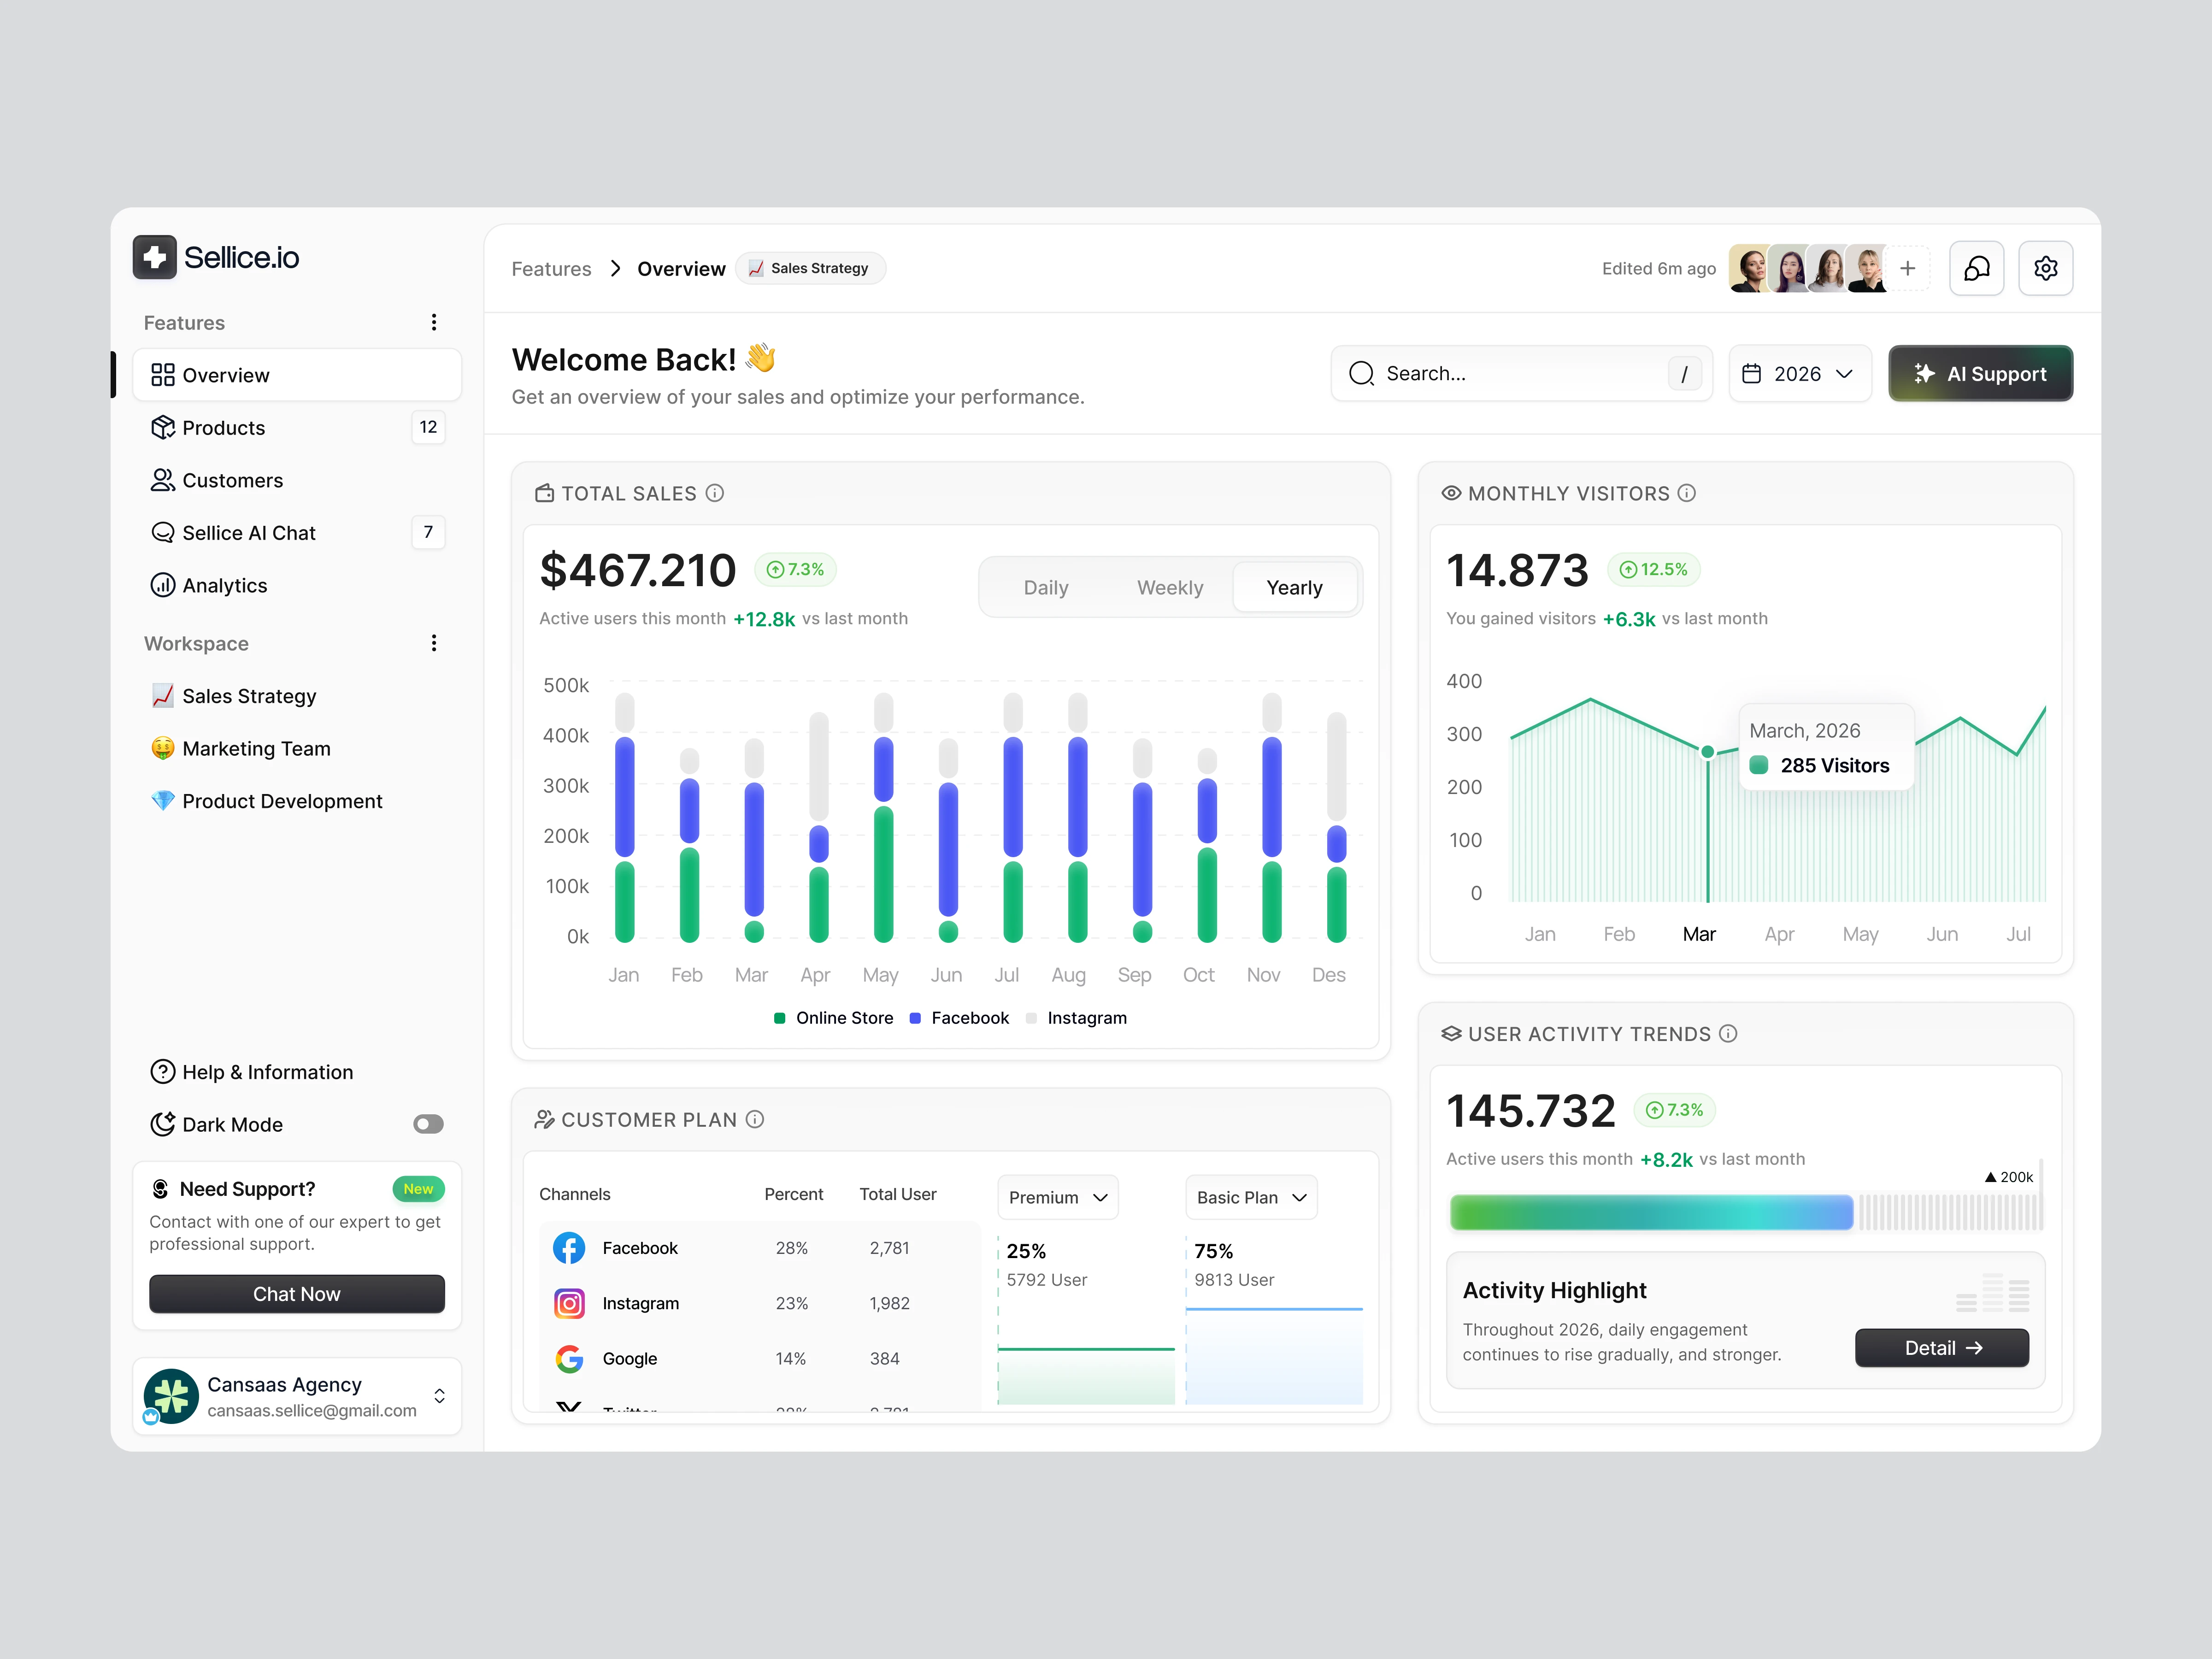
We designed a clean, modular dashboard layout that prioritizes high-impact metrics such as total sales, monthly visitors, and user activity trends. Visual hierarchy, soft color coding, and clear chart labeling help users scan data efficiently without feeling overwhelmed.
Key Features Highlighted
The dashboard highlights revenue performance, traffic growth, customer plans, and activity trends. Interactive charts and comparison indicators make it easier to track progress over time and understand which channels contribute most to growth.
The Solution and Impact
By centralizing sales and user insights into one intuitive dashboard, this experience supports faster analysis and more confident decision-making. The result is a sales dashboard that feels organized, informative, and ready for daily operational use.
Like this project
Posted Jan 21, 2026
Sales dashboard exploration focused on revenue tracking, user activity insights, and performance trends in a clean, data-driven interface.
Likes
2
Views
7