Neighborhood Guide Redesign
Amanda Oliveira
Neighborhood Guide
Product Designer & Front-end Developer
Neighborhood guide redesign to boost user engagement and lead conversion. Built primarily with AI-assisted and low-code tools, reducing time-to-market by ~67% (from ~6 to ~2 months).
Company
Lopes
Year
2024
My Role
Product Designer & Front-End Developer
Skills Applied
UX Research, UI Design, AI, Low Code, Prompt Engineering
Overview
Strategic Context
Finding the “right” neighborhood blends objective signals (safety, schools, transit, amenities) and subjective preferences (vibe, pace, lifestyle). The goal: reduce decision friction and increase confidence by turning fragmented data into a single, explainable score and personalized shortlists.
Real estate platform users frequently struggle to find reliable neighborhood information, a critical factor in buying and renting decisions. Lopes identified this gap as a strategic opportunity to differentiate itself in the competitive market.
The challenge: transform the existing Neighborhood Guide with static content and low engagement into an experience that builds trust and drives conversions, while facing urgent competitive SEO pressure.
Project Objectives
Redesign the Neighborhood Guide to improve user engagement and trust.
Use AI and low code to accelerate development and reduce launch time.
Create scalable framework for national expansion.
Improve SEO visibility to compete with top competitors.
Problem
The existing Neighborhood Guide presented critical problems that impacted both user experience and business results.
User Experience Problems
Static and outdated content: Pages without relevant information for decision making
Poor information architecture: Users couldn't find contextual insights about neighborhoods
Low engagement: Minimal time on pages and high bounce rates
Lack of personalization: Generic content that didn't serve different user profiles
Business Challenges
SEO visibility crisis: Top competitors consistently ranked better on Google
Slow development cycles: Traditional approach would take 6 months, too slow for market needs
Low conversion rates: Pages didn't effectively convert visitors into leads
The Innovation Opportunity
Instead of following the traditional 6 month cycle, I identified an opportunity to pioneer Lopes' first product 100% powered by AI and low code. This approach would allow rapid concept validation, iteration based on real feedback, and establish a new development paradigm.
Process
Research and User Understanding
I conducted targeted research to validate assumptions and discover deeper user needs in neighborhood discovery.
Primary Research
Interviews with recent buyers and renters.
Analysis of existing page performance.
Customer service insights on frequent neighborhood questions.
Workshops with sales and marketing teams.
Competitive Analysis
SEO performance comparison with top competitors.
Content structure and information architecture review.
Gap analysis and feature comparison.
User experience evaluation of leading platforms.
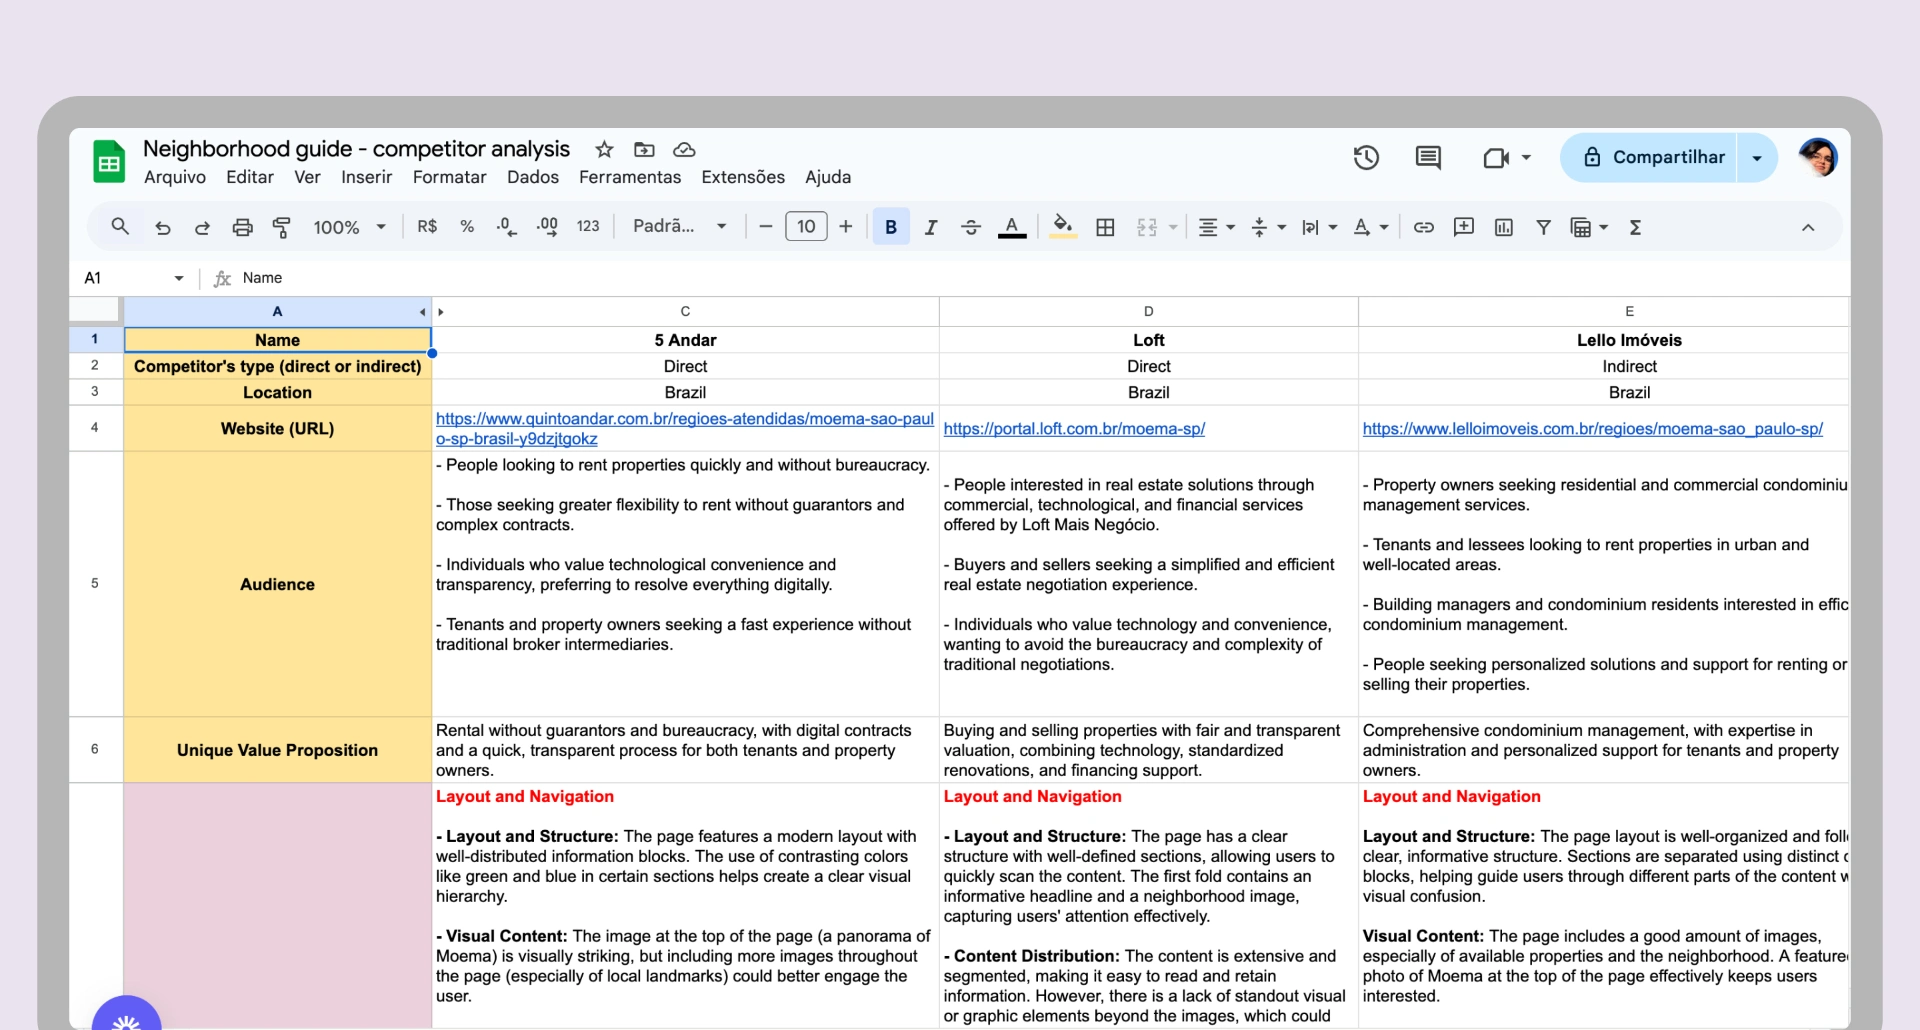
Detailed competitive analysis mapping competitors' strengths, weaknesses, and market positioning.
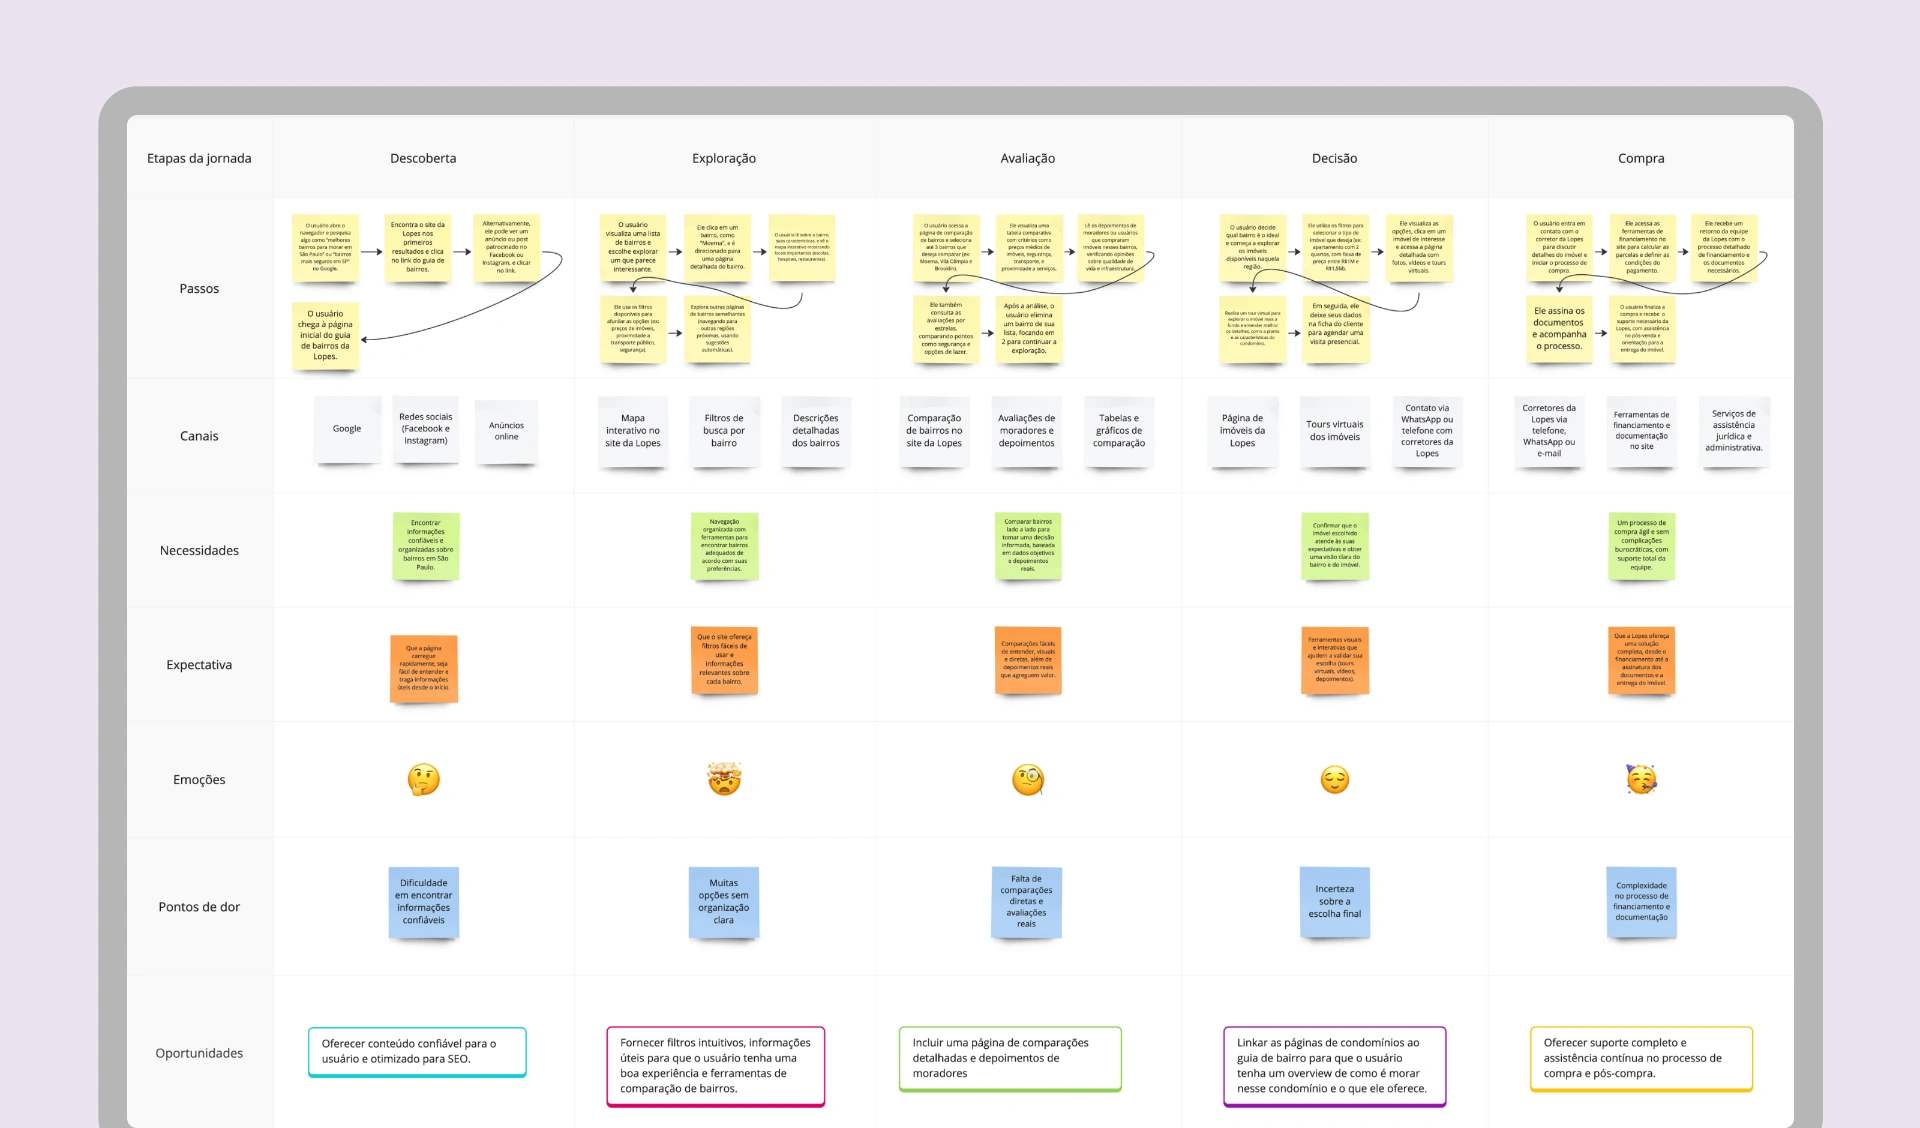
Comprehensive user journey mapping revealing key touchpoints and optimization opportunities.
Key Research Insights
Content Gaps
Users needed contextual information about safety, amenities, and lifestyle factors.
Trust Indicators
Local insights, recent data, and professional presentation were crucial for building trust.
Navigation Patterns
Users wanted to explore nearby neighborhoods and compare areas before deciding.
Data Sources & AI Architecture (Overview)
We designed a modular pipeline to ingest, validate, and normalize heterogeneous signals:
Signals (examples)
points-of-interest density, school quality indices, transit access, commute times, green space, air/noise levels, walkability, price-to-income proxies, listings liquidity, review sentiment, time-of-day activity patterns.
Ingestion & Quality
scheduled pulls with schema contracts, anomaly detection, outlier clipping, and missing-data strategies.
Normalization
min–max/quantile scaling per city, seasonality adjustments, and recency weighting.
Modeling
start with an explainable weighted-sum baseline; graduate to learning-to-rank (e.g., pairwise logistic / LambdaMART) where data density allows.
Personalization
user preference vectors that reweight feature groups; cold-start via guided questions.
Explainability
per-score breakdowns (+/− contributors), feature attributions, and “why this neighborhood” tooltips.
Personas and Strategy
Based on research findings, I defined three main personas that would guide design decisions and content strategy.
Bruno Silva, 42, Investor
"For me, each neighborhood is a strategic bet. I need appreciation data, demand trends, and growth potential."
Needs: ROI data, market trends, rental yield information.
Ana Costa, 35, Family Buyer
"Safety, schools, and family amenities are my priorities when choosing where to live."
Needs: Safety indexes, school quality, parks and recreation.
Rafael Almeida, 29, Professional
"I want a modern place near transportation and work centers, but I struggle to find lifestyle focused information."
Needs: Transportation connections, nightlife, coworking spaces.
AI and Low Code Strategy
I developed a comprehensive strategy to leverage AI and low code tools for rapid development:
AI Implementation
Content generation for neighborhood descriptions.
SEO optimization for better visibility.
Low Code Platform
Rapid prototyping and iteration.
Scalable architecture for national rollout.
Data Sources & AI Architecture (Overview)
We designed a modular data pipeline that ingests, validates, and normalizes heterogeneous signals:
Signals (examples)
points of interest density, school quality indices, transit access, commute times, green space, air/noise levels, walkability, price-to-income proxies, listings liquidity, review sentiment, time-of-day activity patterns.
Ingestion & Quality
scheduled pulls with schema contracts, anomaly detection, outlier clipping, and missing-data strategies.
Normalization
min–max/quantile scaling per city, seasonality adjustments, and recency weighting.
Modeling
start with an explainable heuristic baseline (weighted sum) and graduate to learning-to-rank (e.g., pairwise logistic or LambdaMART) where data density allows.
Personalization
user preference vectors mapped to feature weights; cold-start defaults with guided questions.
Explainability
per-score breakdowns (+/- contributors), feature attributions, and “why this neighborhood” tooltips.
Ranking & Scoring Framework
We optimized for explainability first, then for predictive lift:
Baseline (explainable)
NeighborhoodScore = Σ (w_i * normalized_feature_i)
with expert-calibrated defaults and city-specific bounds.
Personalization
Preferences (e.g., quiet streets, near metro, parks) reweight feature groups with guardrails to avoid extreme skew.
Learning-to-Rank (when applicable)
Pairwise labels from user actions (saves, compares, dwell).
Offline: NDCG@k, MAP; Online: CTR, Save rate, Shortlist completion.
Guardrails
Monotonicity (e.g., more transit access must not lower score, ceteris paribus).
Fairness constraints (avoid proxies of protected attributes).
Stability checks (prevent rank swings from minor jitter).
Privacy, Ethics & Safety
Data minimization & consent: collect only what’s necessary; explicit consent for location/personal data; opt-outs supported.
Anonymization & aggregation: neighborhood-level stats; no exposure of individual records.
Bias & fairness: exclude protected attributes; audit features that may proxy socioeconomic status; periodic fairness reviews on rank shifts.
Transparency: “why” explanations, data-freshness indicators, and high-level source disclosure.
Compliance: GDPR-aligned practices (lawful basis, DSR handling, retention); DPIA for high-risk signals.
Experimentation Framework (Hypotheses → Experiments)
Primary metrics
Card CTR, Shortlist completion, Save rate, “Contact agent / learn more” starts.
Guardrails
Bounce rate, time-to-first-result, latency p95, complaint rate.
Representative hypotheses & tests:
H1 (Explainability): Showing top 3 positive/negative contributors increases shortlist completion. Test: A/B — with vs. without “why this score”; Success: directional ↑ shortlist completion; Guardrail: ≤ latency impact.
H2 (Personalization): Preference onboarding (3–5 choices) increases CTR on top-5 neighborhoods. Test: A/B — onboarding vs. default; Success: directional ↑ CTR; Guardrail: no loss in discovery breadth.
H3 (Cold Start): City-specific defaults beat global defaults. Test: multi-cell; Success: directional ↑ save rate; Guardrail: bounded variance.
H4 (Stability): Recency-weighted signals reduce week-over-week rank churn. Test: shadow experiment; Success: directional ↓ churn; Guardrail: no KPI degradation.
H5 (Fairness): Applying fairness constraints keeps engagement within acceptable deltas. Test: A/B; Success: engagement Δ within bounds; Guardrail: fairness metrics improve.
Design: preregistered metrics, sample-size calculators, city stratification, and a drift holdout.
UI Design and Development
The UI design focused on creating a clean and trustworthy experience that guides users through their neighborhood discovery journey, addressing specific needs of different personas.
User Experience Improvements
For Investors (Bruno)
Access to structured market insights and neighborhood analyses that support investment decisions.
For Families (Ana)
Clear information about safety, schools, and family friendly amenities in each neighborhood.
For Professionals (Rafael)
Lifestyle focused content highlighting transportation, work hubs, and modern amenities.
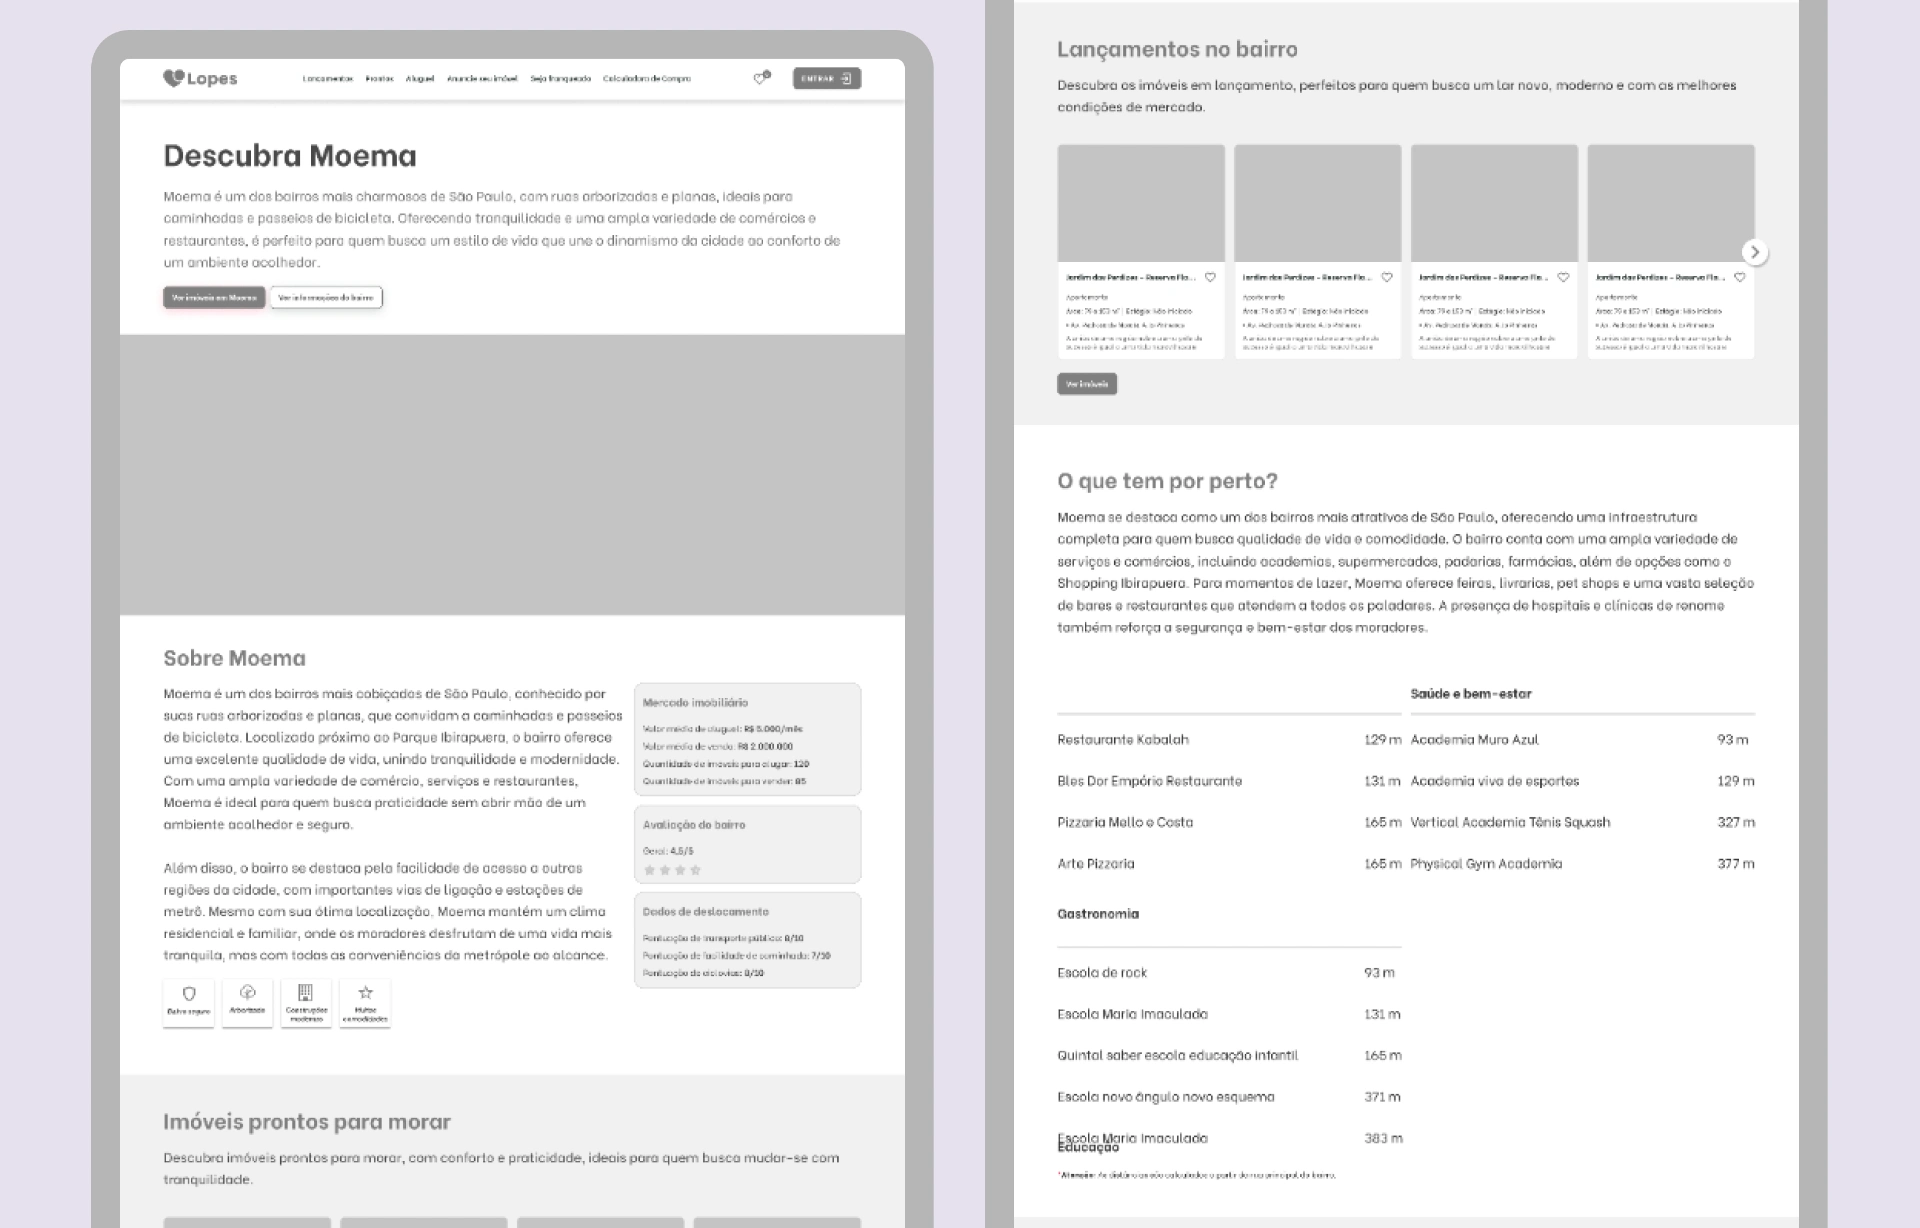
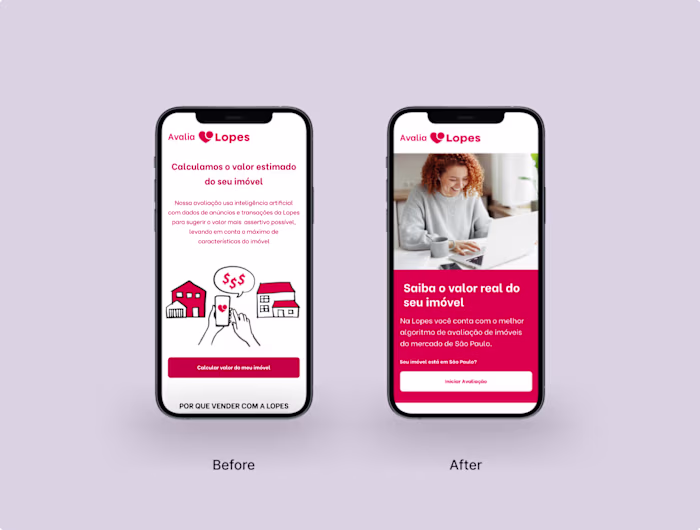
Design wireframe: Early iteration exploring content structure and layout before defining the final V1 implementation.
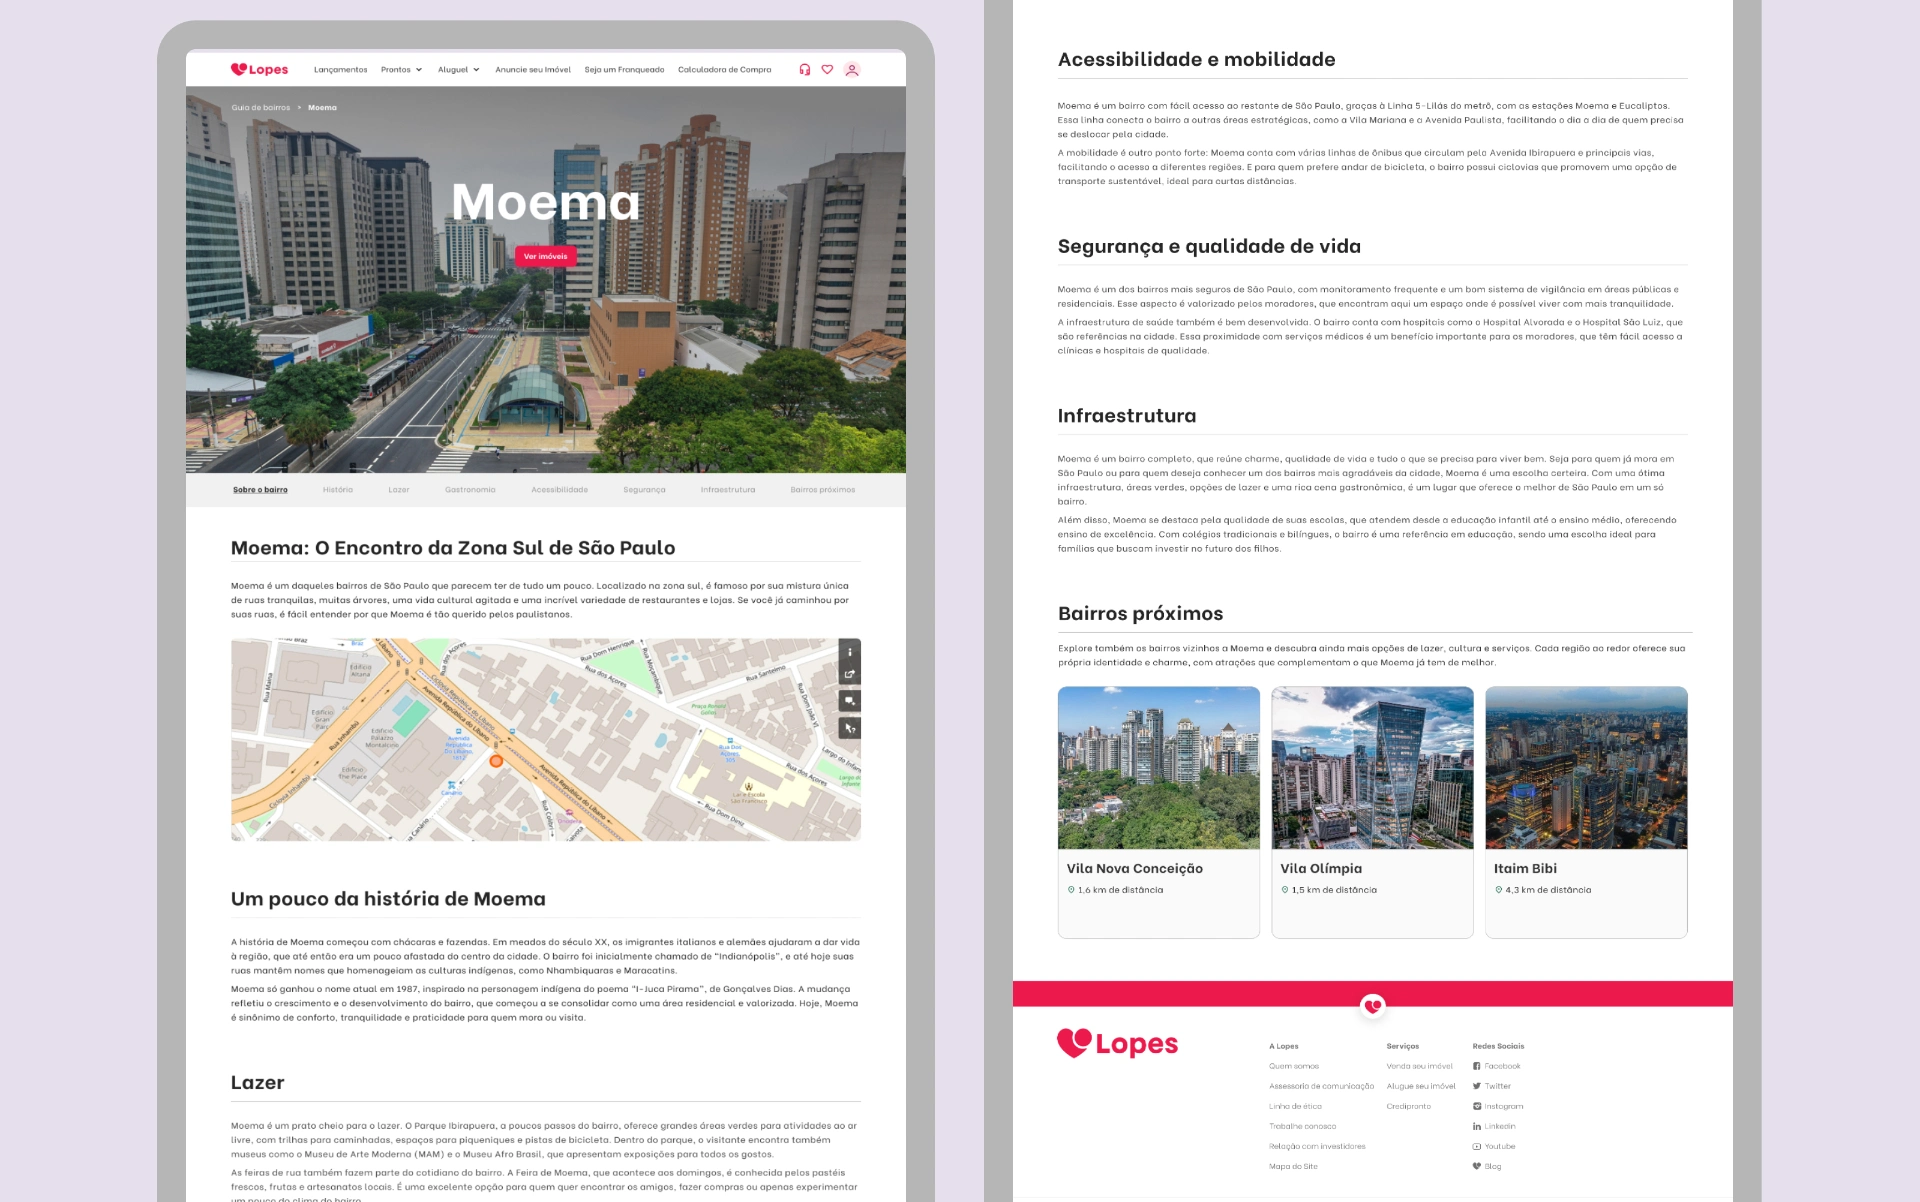
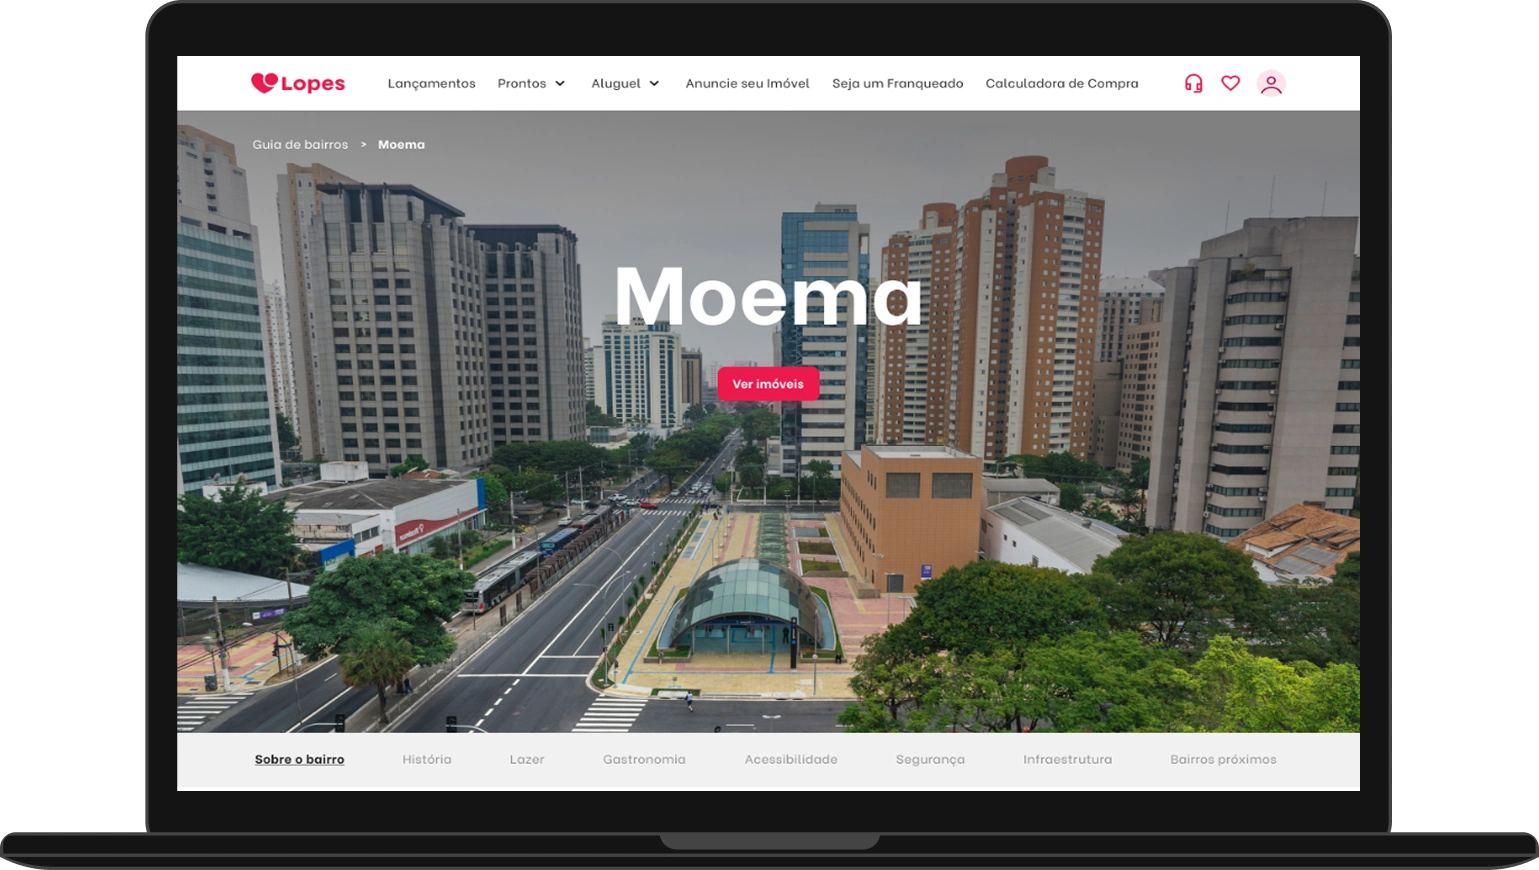
Final V1 implementation: Live version with rich, contextual content and improved user experience.
Applied Design Principles
Content first approach: Information hierarchy based on research insights.
Trust indicators: Professional presentation with current and reliable data.
Contextual navigation: Easy exploration of nearby areas and comparisons.
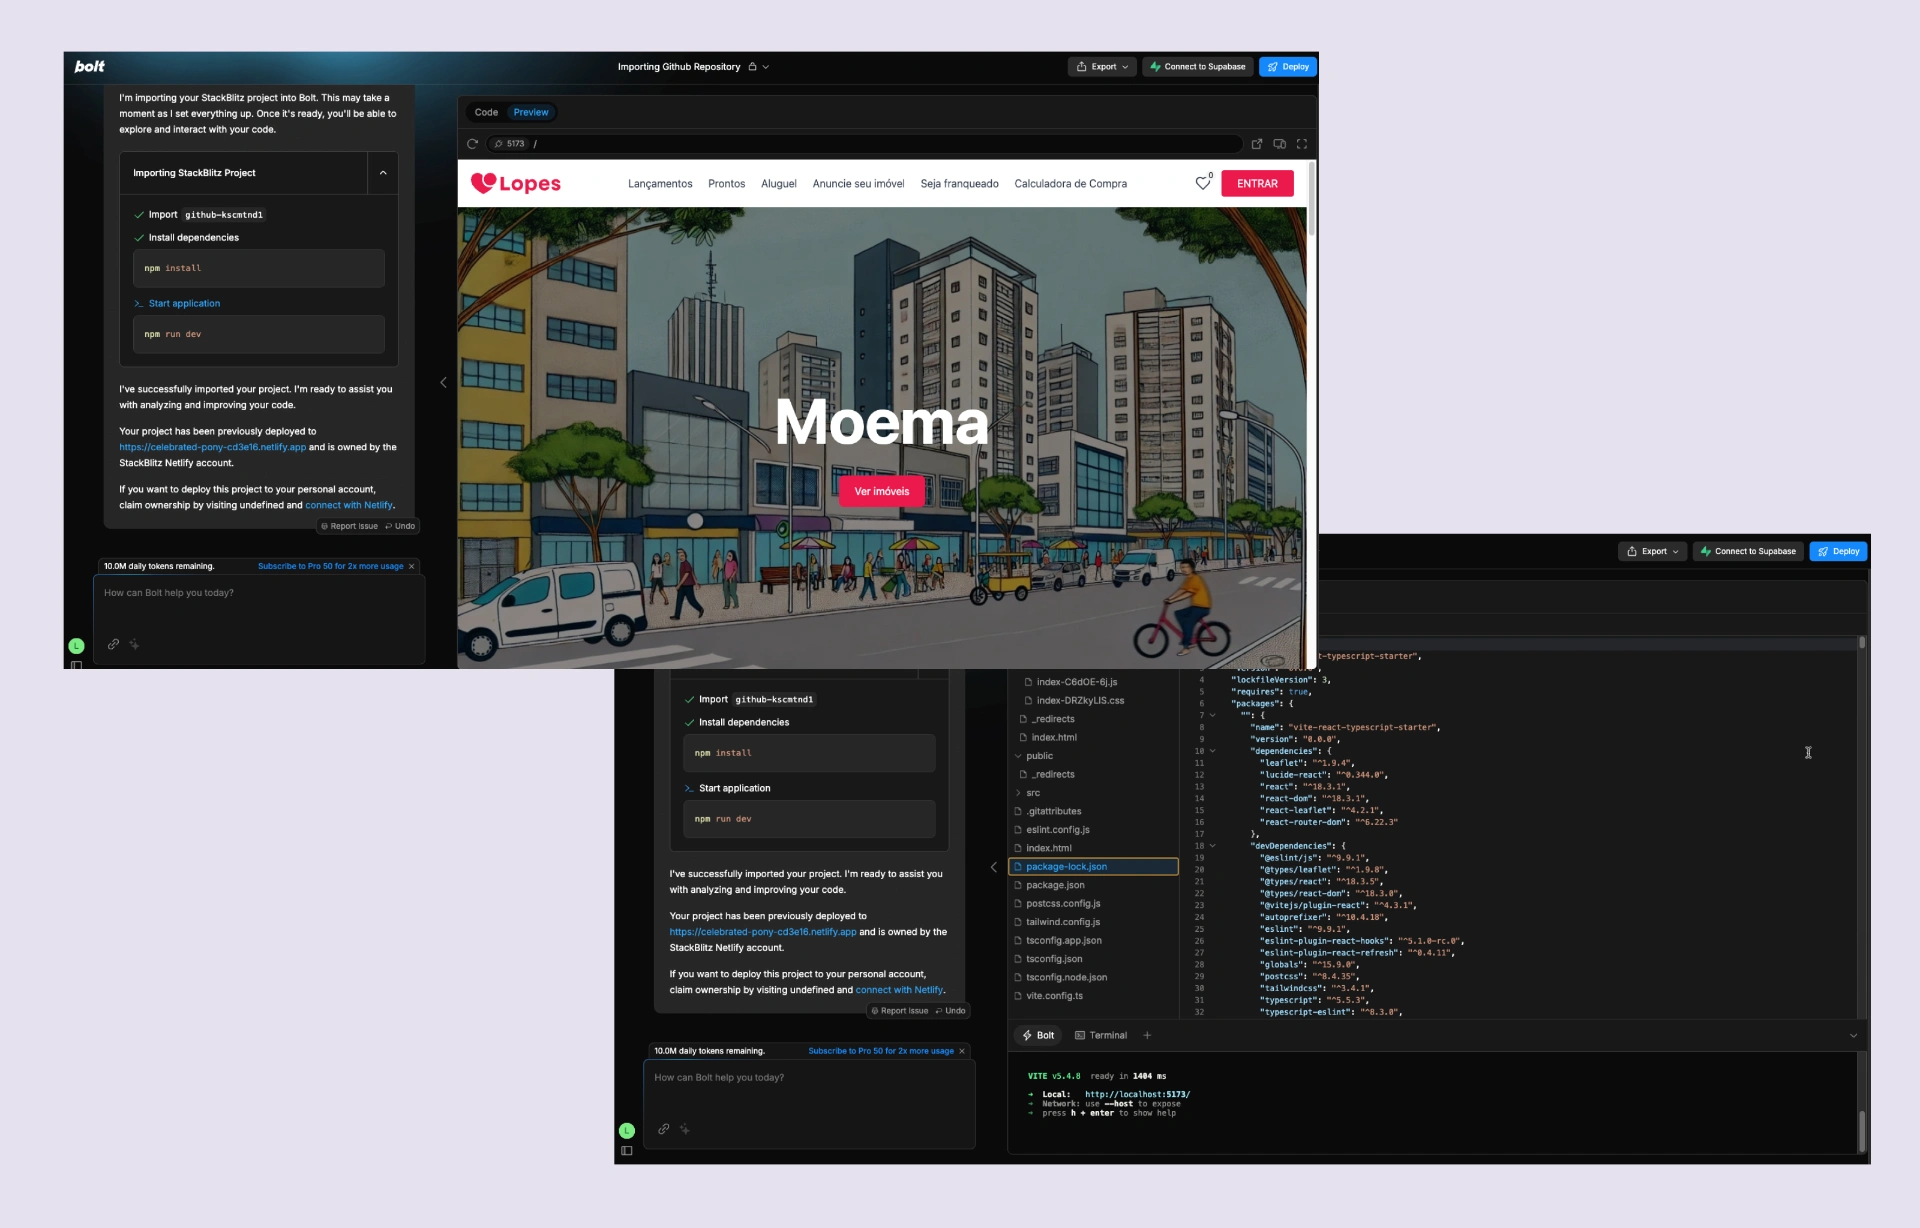
Development environment: Using Bolt platform to build and iterate on the neighborhood guide, demonstrating the power of AI-assisted product development.
Results and Strategic Impact
I created a scalable, content driven platform that transforms static neighborhood pages into engaging and trustworthy resources, guiding users through their real estate decision journey.
Solution Framework
User Centered Design
Structured content hierarchy addressing specific persona needs with clear navigation and contextual information.
AI Powered Content
Automated generation of relevant and SEO optimized descriptions about neighborhoods and insights.
The new Neighborhood Guide was successfully launched and is actively serving users, establishing a new development paradigm for Lopes while addressing critical competitive challenges.
Business Impact: At a Glance
Directional outcomes from pilots and early cohorts (city-dependent):
Higher decision confidence (self-reported) after adding explainability panels.
Increased shortlist completion with preference onboarding.
Improved engagement on top-5 recommendations after ranking calibration.
Stable rankings over time with recency-weighted signals and jitter controls.
Measurement Framework (Deep Dive)
For each metric we track Result (directional) → Time Window → Method → Business Outcome:
Card CTR / Save Rate — Result: ↑ directional in pilots → Window: 4–8 weeks → Method: product analytics → Outcome: higher discovery & intent.
Shortlist Completion — Result: ↑ directional with explainability & onboarding → Window: 4–8 weeks → Method: funnel tracking → Outcome: reduced decision friction.
Ranking Stability — Result: ↓ churn week-over-week → Window: 8+ weeks → Method: rank distance metrics → Outcome: trust & predictability.
Latency p95 — Result: within SLA after caching/precompute → Window: continuous → Method: observability → Outcome: UX quality protected.
Data Sources & Limitations
Results reflect pilot and early rollout cohorts. Absolute figures remain confidential; methodology, cohorts, and time windows are disclosed for transparency. City mix and data availability can influence outcomes.
Key Results
Speed & Innovation
~67%faster development using AI-assisted and low-code (from ~6 to ~2 months).
100%AI-powered product, first of its kind at Lopes.
Scale & Impact
40+neighborhoods launched successfully.
~100Lighthouse SEO score ~100 on representative pages (PageSpeed Insights at launch); scores may vary by page/time.
Performance Results
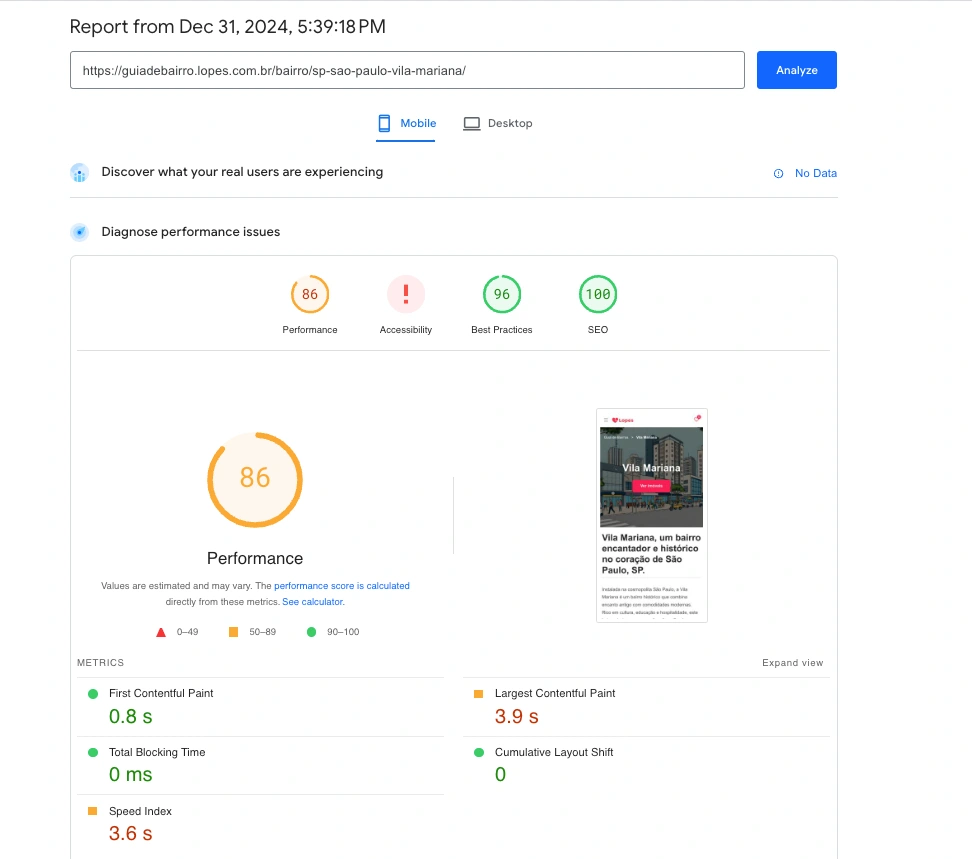
Sample PageSpeed Insights report at launch — Best Practices 96, Performance 86; SEO ~100 on representative pages (scores may vary by page/time).
Learnings
1
AI as UX Enabler
Beyond content automation. AI becomes a powerful UX tool when combined with intelligent data structuring and user centered design principles.
2
Low Code Innovation
Validation acceleration. Low code platforms drastically reduced iteration cycles, enabling rapid hypothesis testing and user feedback integration.
3
Strategic UX Impact
Friction removal + relevance addition. Successful transformation of static pages into guided digital experiences that build trust and generate action.
What's Next
The Neighborhood Guide success established a foundation for continuous product evolution, with planned features focused on enhancing user decision-making through comparative insights and property visualization.
Planned Evolution
Neighborhood Comparison Tool
Side-by-side comparison functionality allowing users to evaluate multiple neighborhoods across key factors like safety, amenities, transportation, and lifestyle characteristics.
Enhanced decision-making support.
Property Visualization
Interactive maps and listings showing available properties for sale and rent within each neighborhood, providing real-time inventory visibility.
Direct property discovery.
Strategic Impact
These enhancements will transform the Neighborhood Guide from an informational resource into a comprehensive decision platform, further strengthening Lopes' competitive position in the digital real estate market.
Like this project
Posted Apr 5, 2026
Redesign of the Neighborhood Guide to enhance user engagement and conversion using AI and low-code tools.