Data Analytics Case Study

Angad Singh


Problem
Build visualization to show the most common projects on Contra
Solution
Project by Budgets
Approach & Visualization
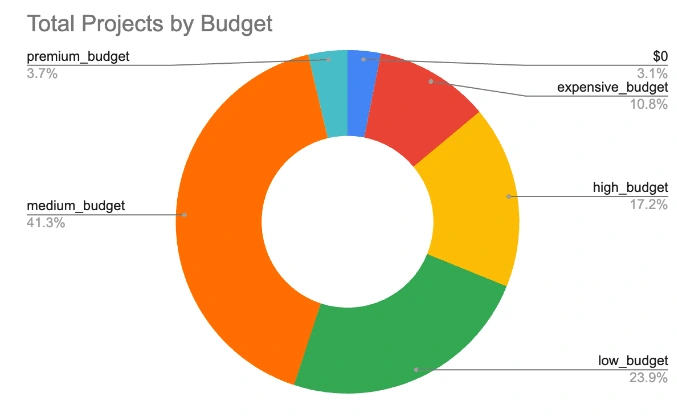
I started with running a simple analysis on understanding the distribution of how much each project costs. I initially assumed that using the total fee in cents column for the cost of the project is feasible. Although after finding out that there was a large portion of projects costing $0, I realized that only projects on the ‘completion’ payment cycle would have a total amount in that column. Therefore I decided to come up with a new logic for finding out the total cost of the project.
I noticed that in ongoing projects, there is a fee type of rate or fixed price and my assumption here is that if a fixed price fee type is selected, the rate is then actually the entire cost of the project. When selecting a rate, there is no indication of how many hours the project took since the ends_at column is null. I chose to remove these types of rate fee types from this analysis and proceed to create a budget.
After creating the column, I wanted to look at the distribution of the fee. The mean of $1377 is not close to the median of $550 which means that the cost is being skewed by high value projects. Based on the distribution and a little bit of business context of categorizing fees, I came up with the following budget.
Like this project
Posted Apr 29, 2024
Analyzed project costs, adjusted for $0 fees, and categorized budgets based on distribution: $0, Low, Medium, High, Expensive, Premium.
Likes
0
Views
4
Clients
Contra


Ad Funnel Understanding & Implementation
Data Analytics Case Study