Built with Anything
Real-time Competitive Intelligence
Anuke Ganegoda
Transforming Manual Freight Quotation into Real-Time Competitive Intelligence
The Quick Look
Product: A strategic freight analytics engine and automated scraping infrastructure.
Core Goal: To eliminate the "Quotation Bottleneck" by transforming manual, week-long RFQ processes into real-time market intelligence.
Key Deliverables: Automated multi-source freight scraper, GraphQL analytics platform, and an executive strategic dashboard.
Scale: Monitoring ~300 global shipping routes with daily updates and <1s query response times.

The Challenge: The Quotation Bottleneck
In the global paper export industry, freight cost is a primary driver of competitiveness. However, the client’s existing process was reactive and manual.
The Hurdles:
Stale Data: Manual Request for Quotations (RFQs) took 2–5 business days, meaning rates were often outdated by the time analysis was complete.
Blind Spots: High manual overhead limited analysis to only 5–10 routes per month, leaving emerging markets unexplored.
Pricing Disadvantage: Without regional benchmarks (India, Indonesia, Thailand), the client was overpaying by 15–30% on several key routes.
Resource Drain: Sales teams were losing 40+ hours per month on spreadsheet-based comparisons instead of closing deals.

The Solution: Automation + Intelligence Platform
We didn't just build a dashboard; we built a complete data acquisition ecosystem that turned freight rates into a proprietary data advantage.
The Invisible Engine: Automated Freight Scraper
Instead of waiting for emails, we built a "silent" infrastructure that gathers fresh rates every night.
Automation: Eliminated 160+ hours/month of manual data entry.
Competitive Depth: Expanded tracking from 3–5 competitors to 15+ international regional rivals.
Reliability: Implemented automated validation to ensure data consistency across disparate source formats.
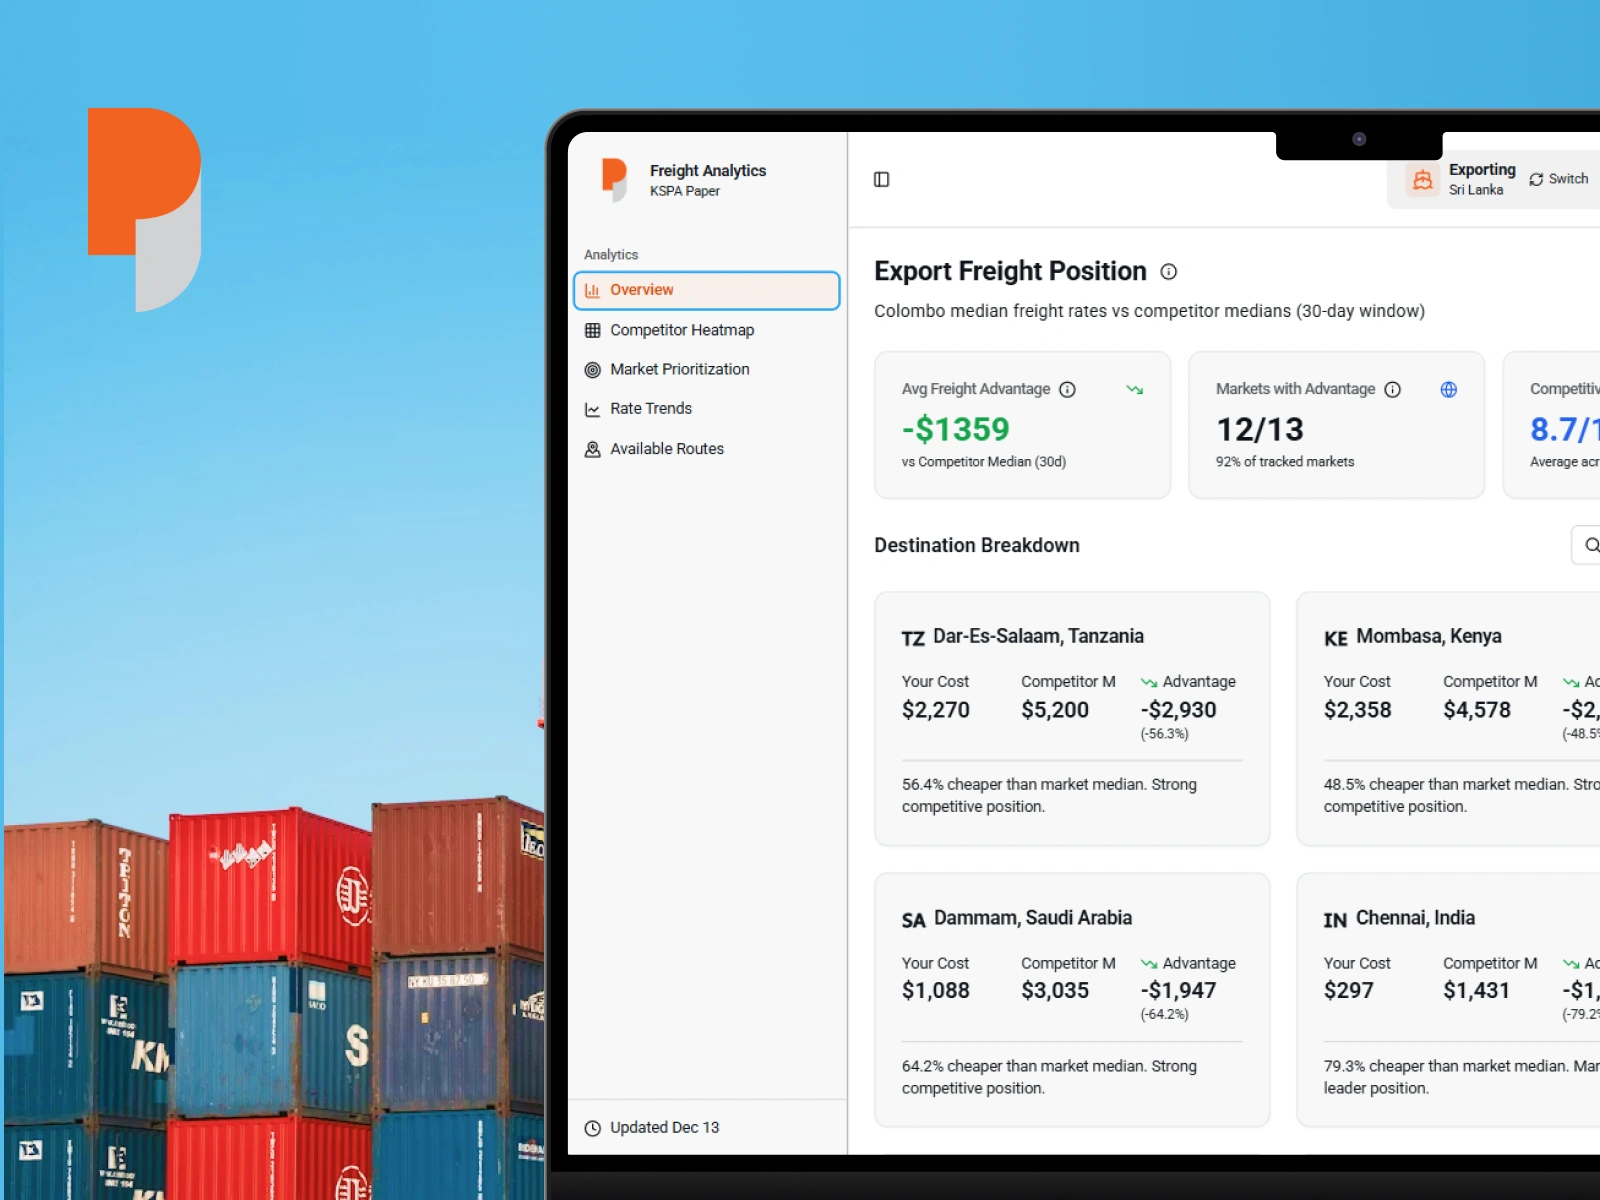
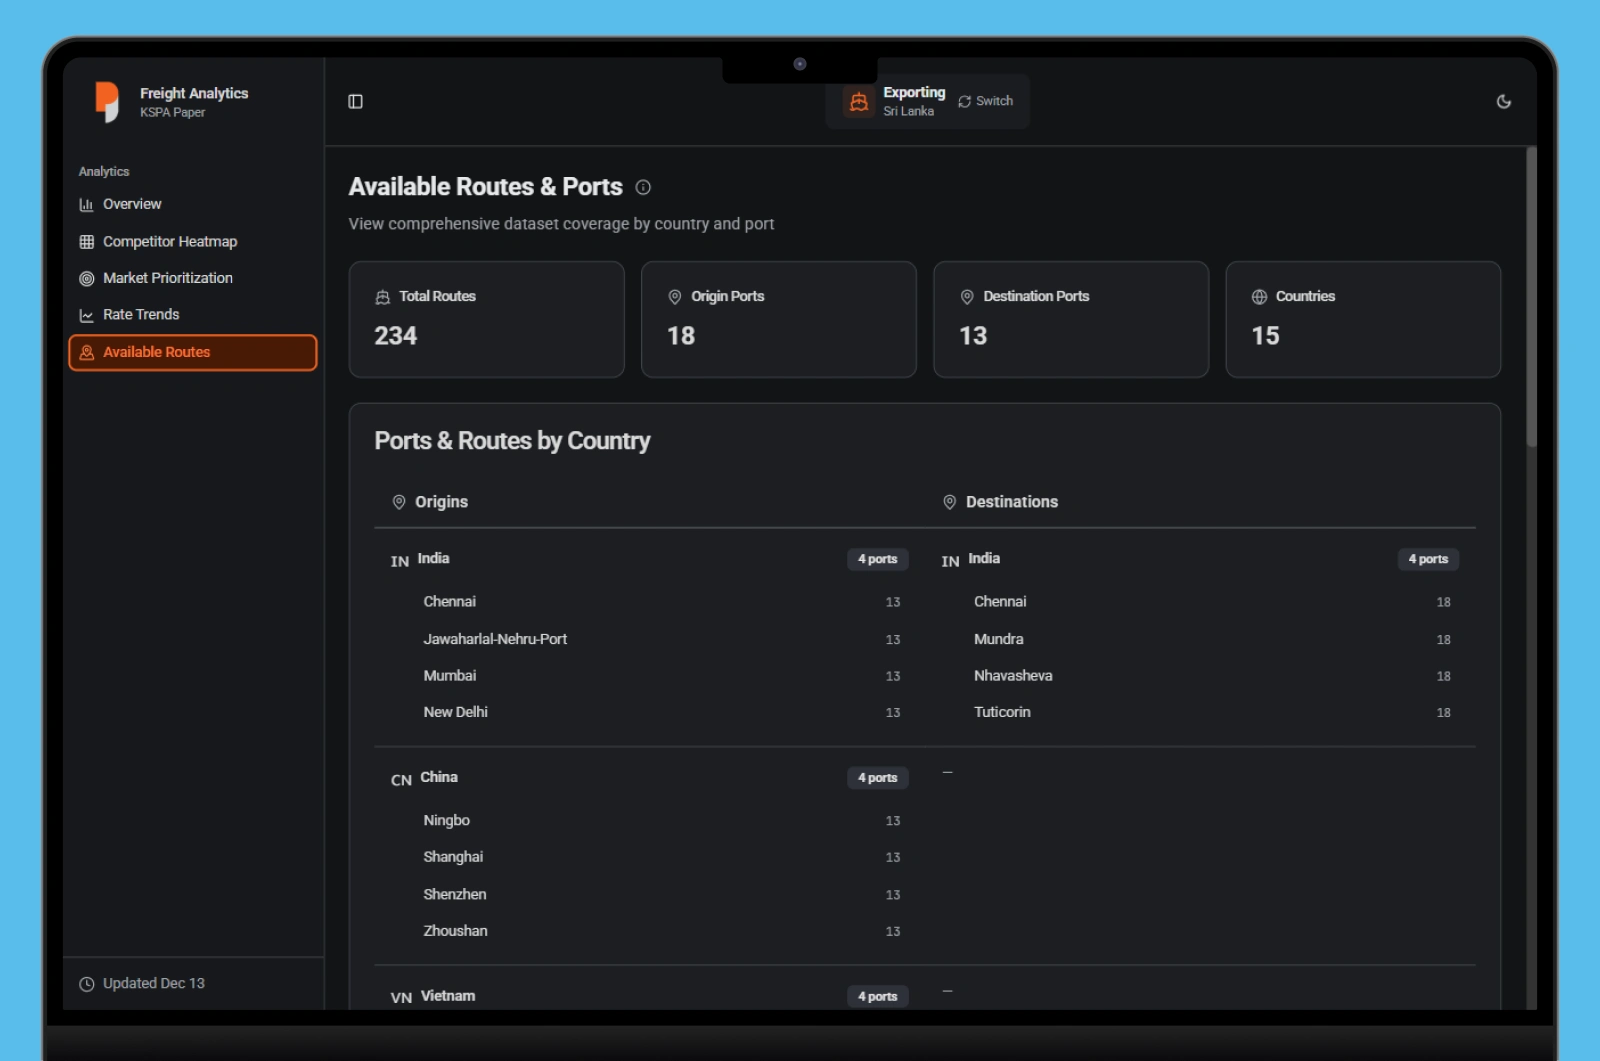
The Strategic Command Center: Analytics Dashboard
We translated raw logistics data into a high-level business interface designed for decision-makers.
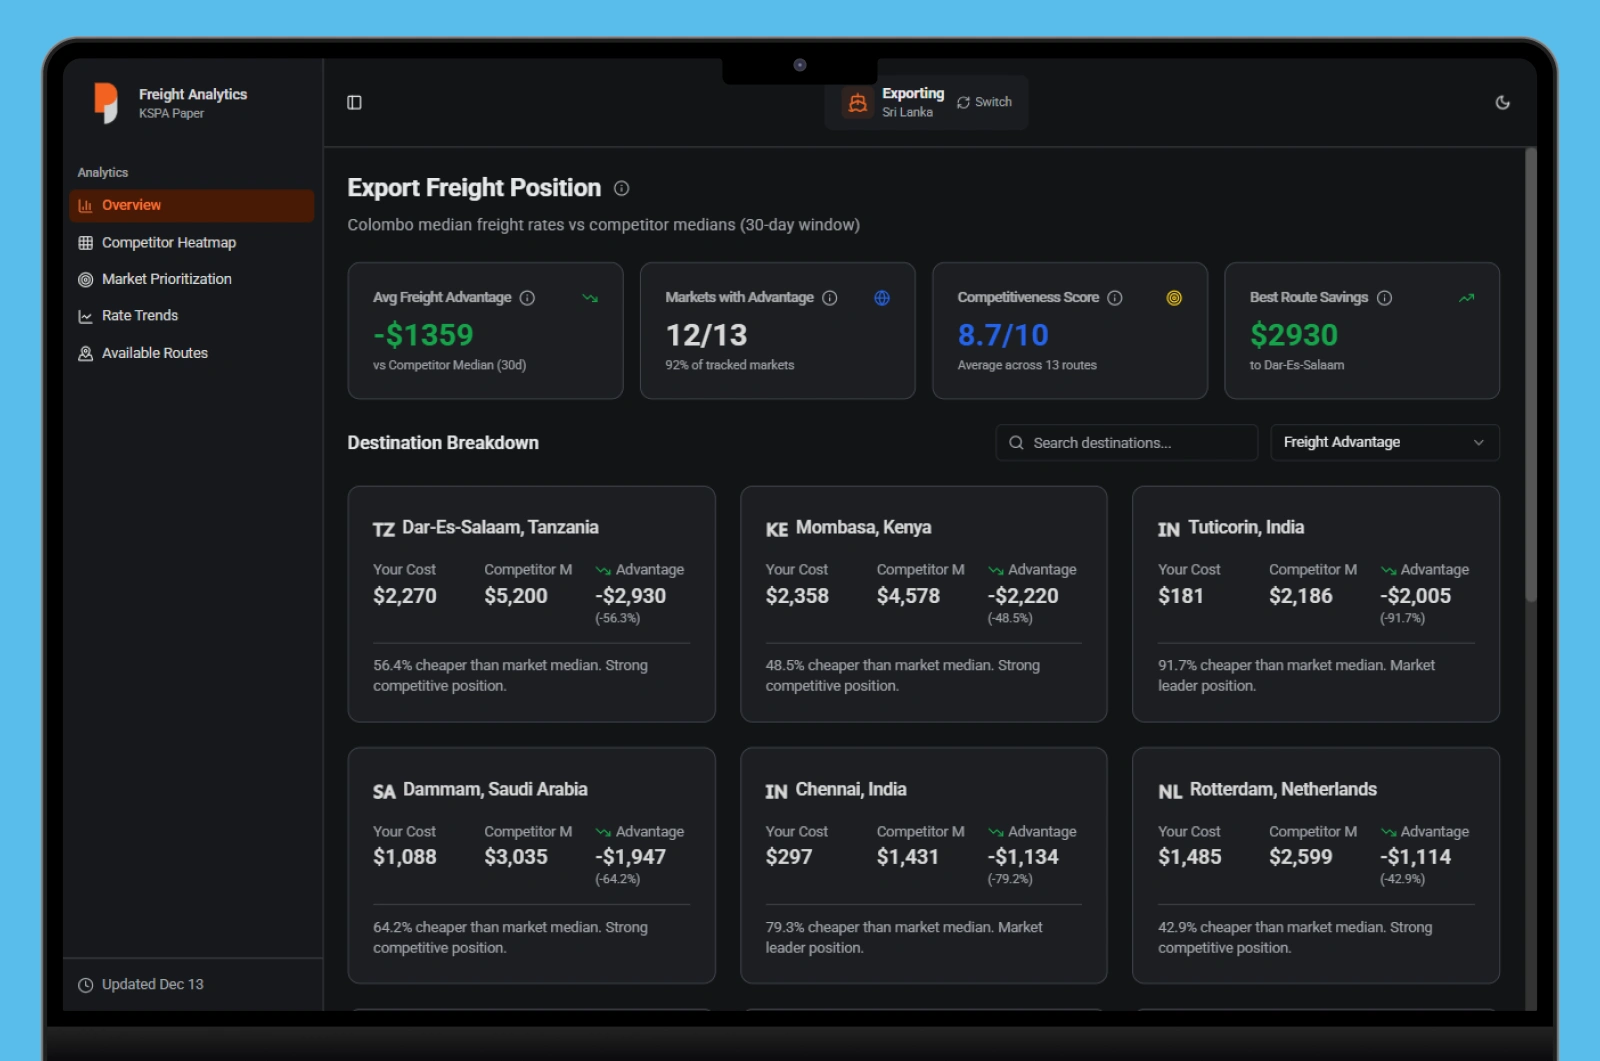
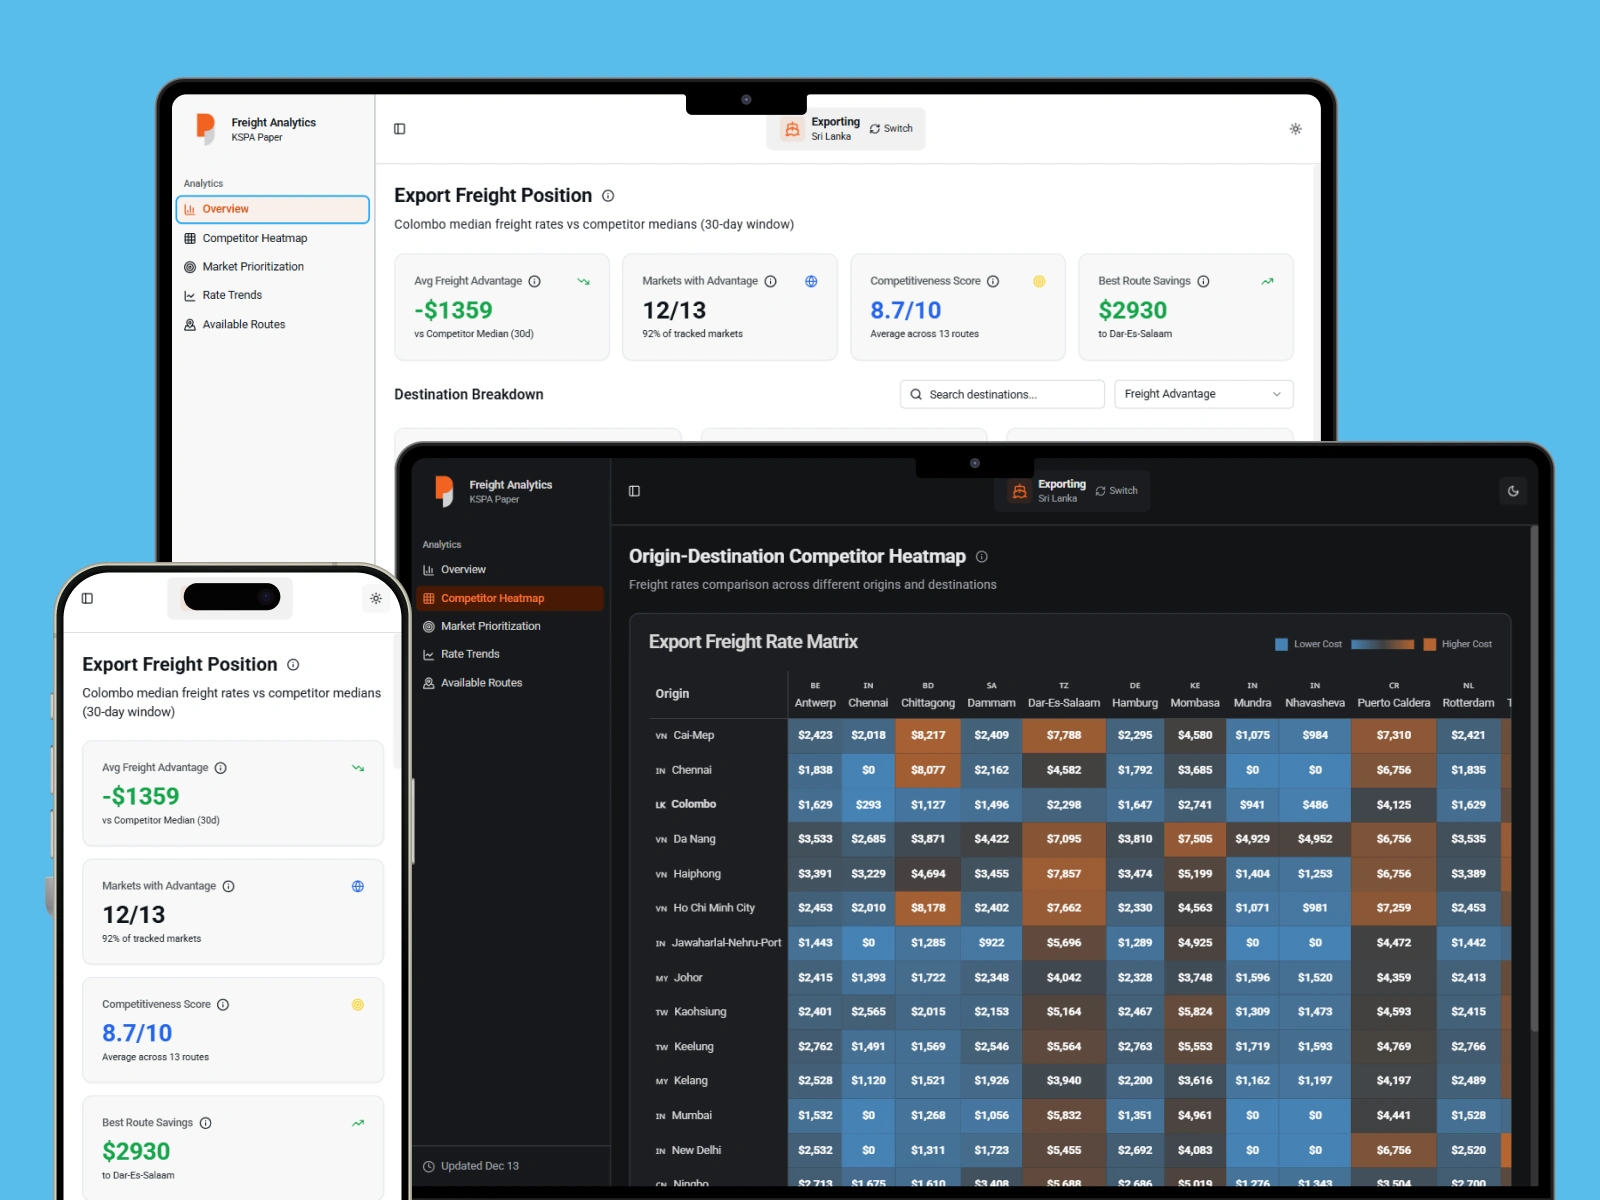
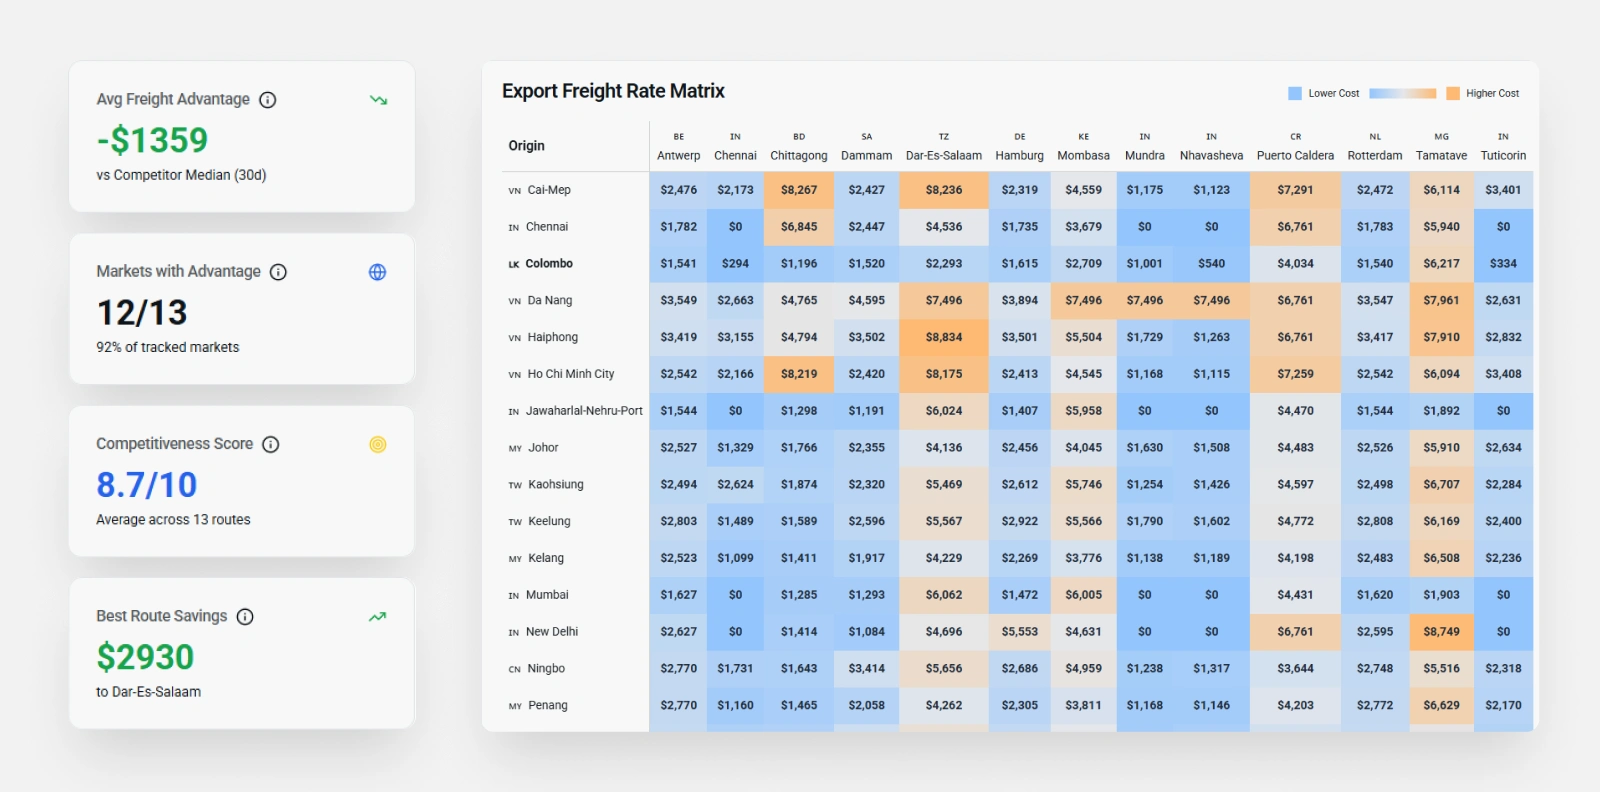
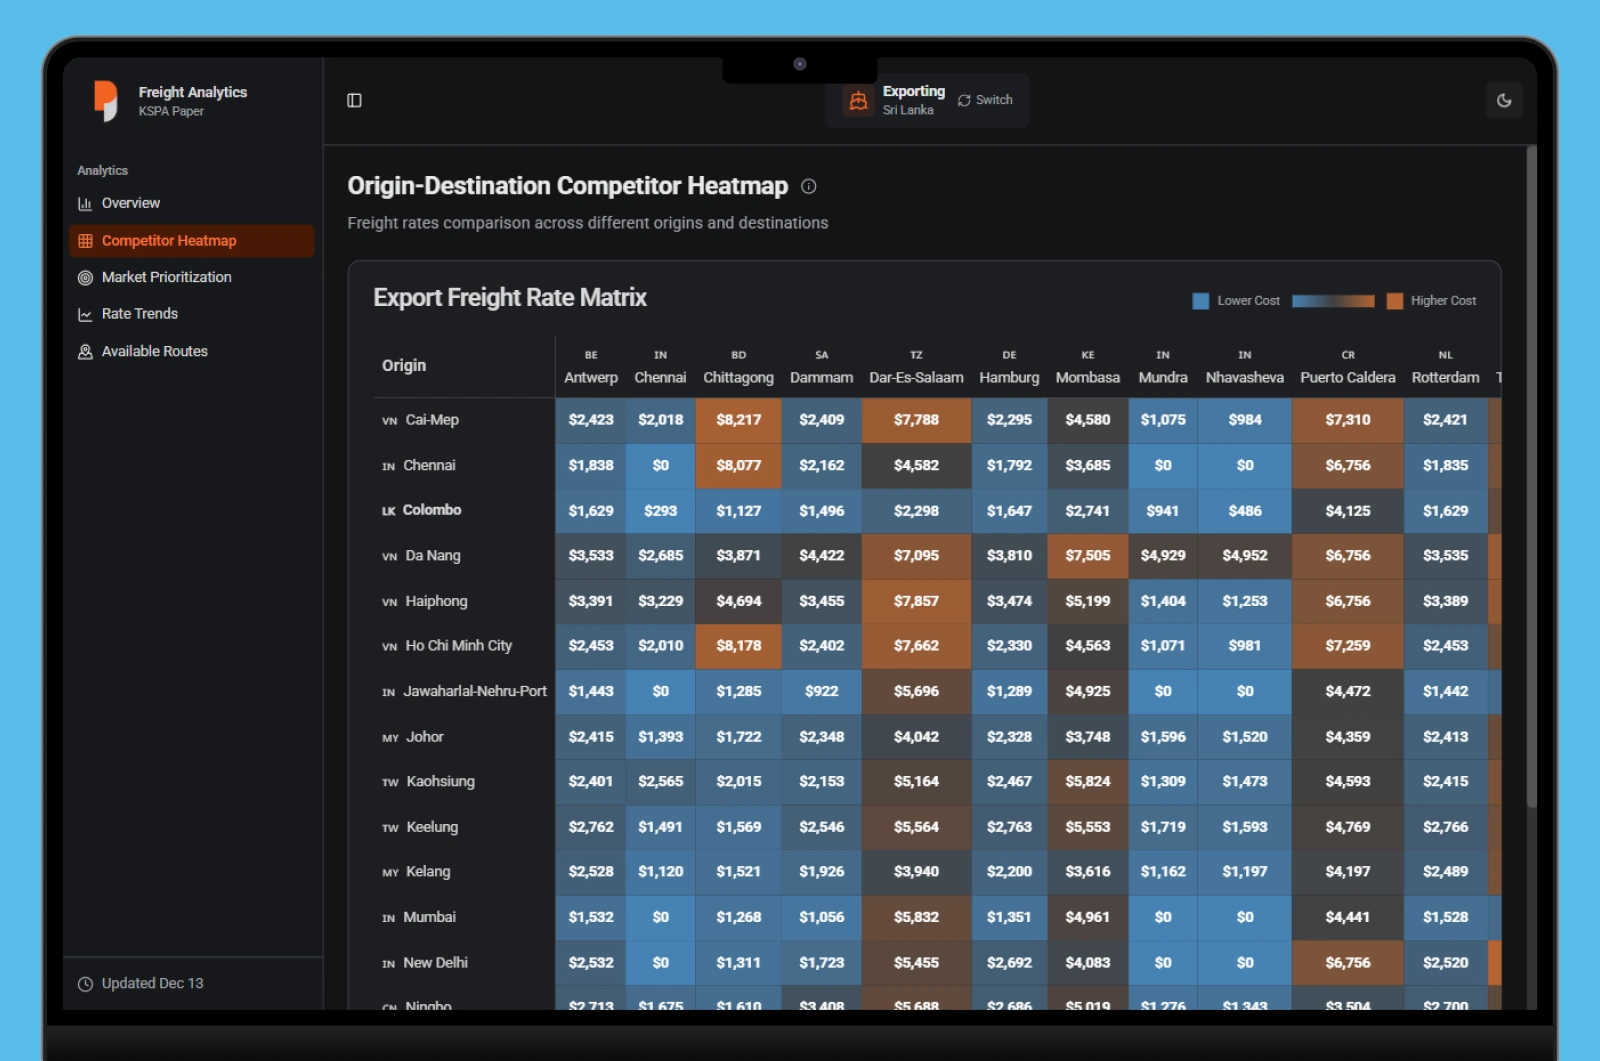
Market Heatmaps: An intuitive UI that instantly highlights which global destinations offer the best "landed-price" competitiveness.
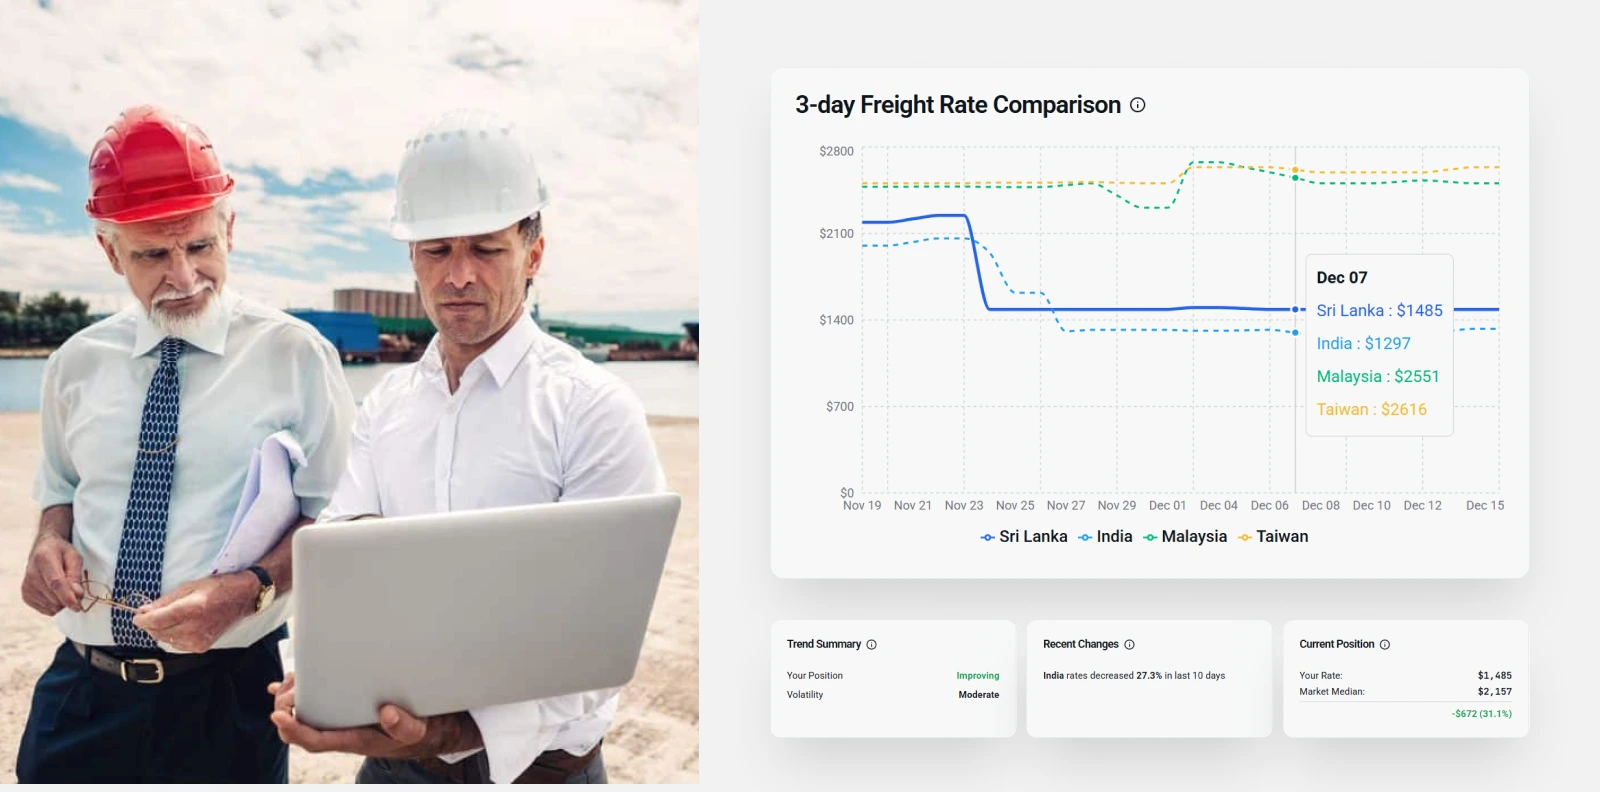
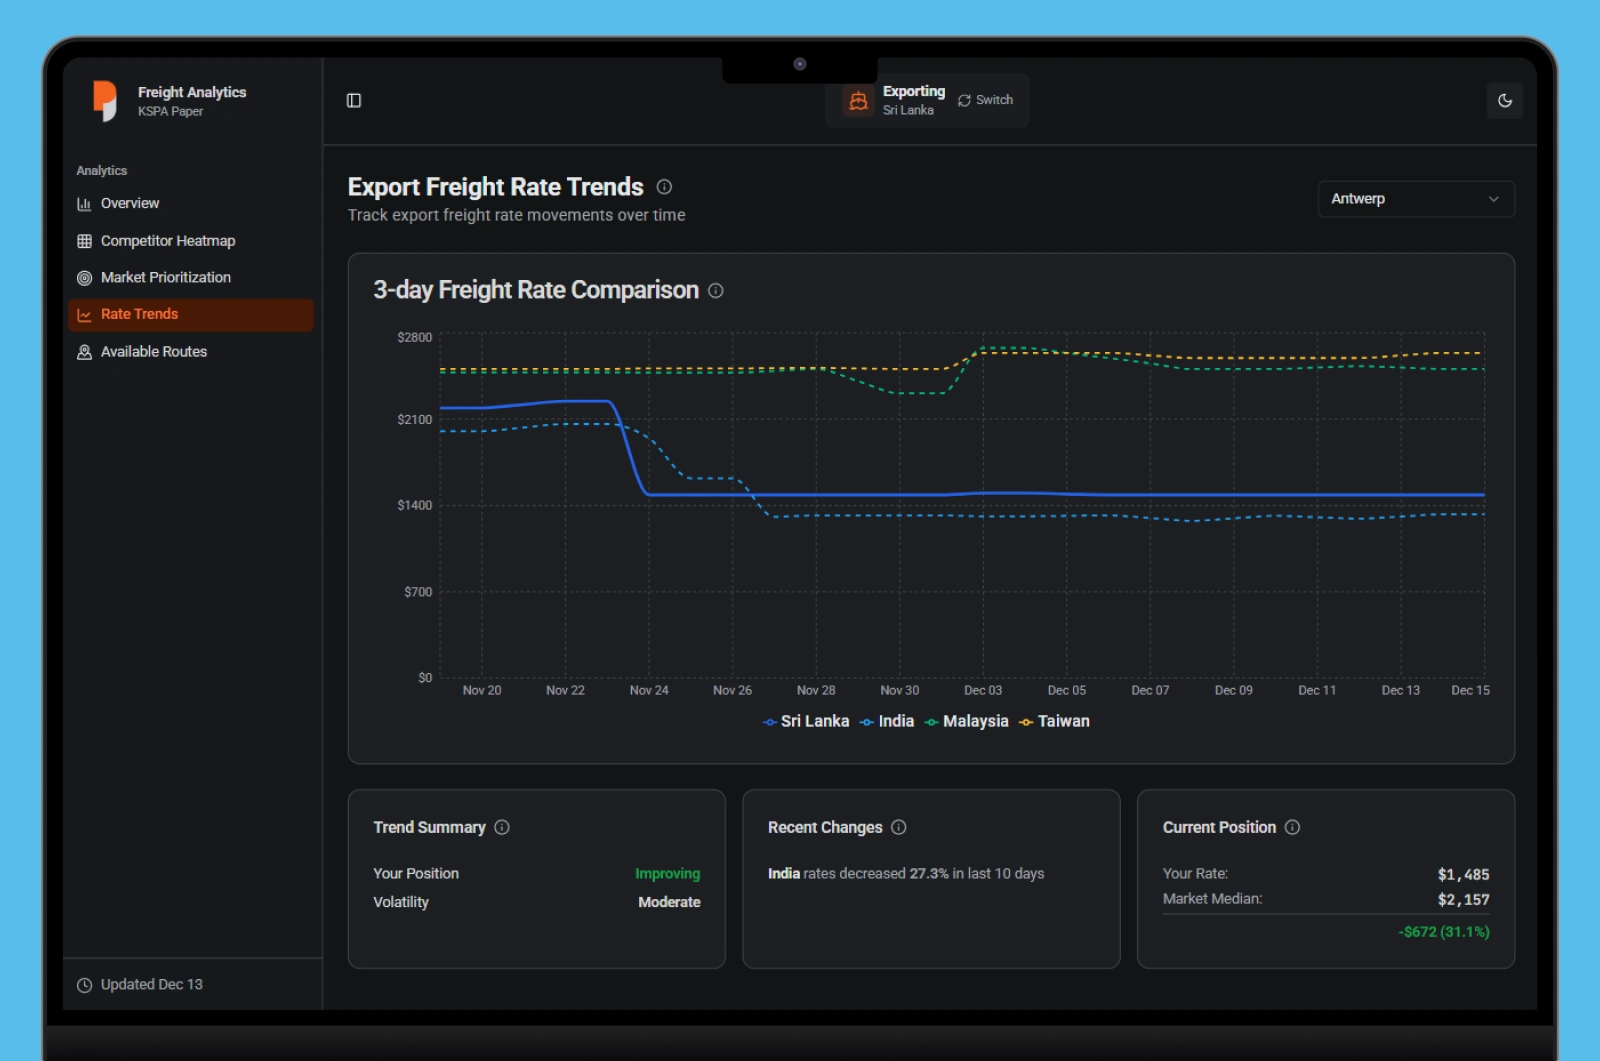
Trend Analysis: Users can view 90-day price trajectories to predict market shifts before they happen.
Dual-Perspective Toggle: A one-click switch between Export (sales focus) and Import (raw material procurement focus) modes.
Engineering for Longevity
GraphQL Architecture: Built to support future mobile app expansions or 3rd-party ERP integrations without backend rewrites.
Performance Scaling: Utilized a materialized view strategy, ensuring that adding 100+ more routes would not degrade system speed.
The Impact
Massive Efficiency Gains: Saved 160+ labor hours per month, redirecting the sales team toward high-value negotiations.
Direct Cost Savings: Identified three specific routes where the client was overpaying by 20–35%, uncovering ~$47k in annual optimization potential.
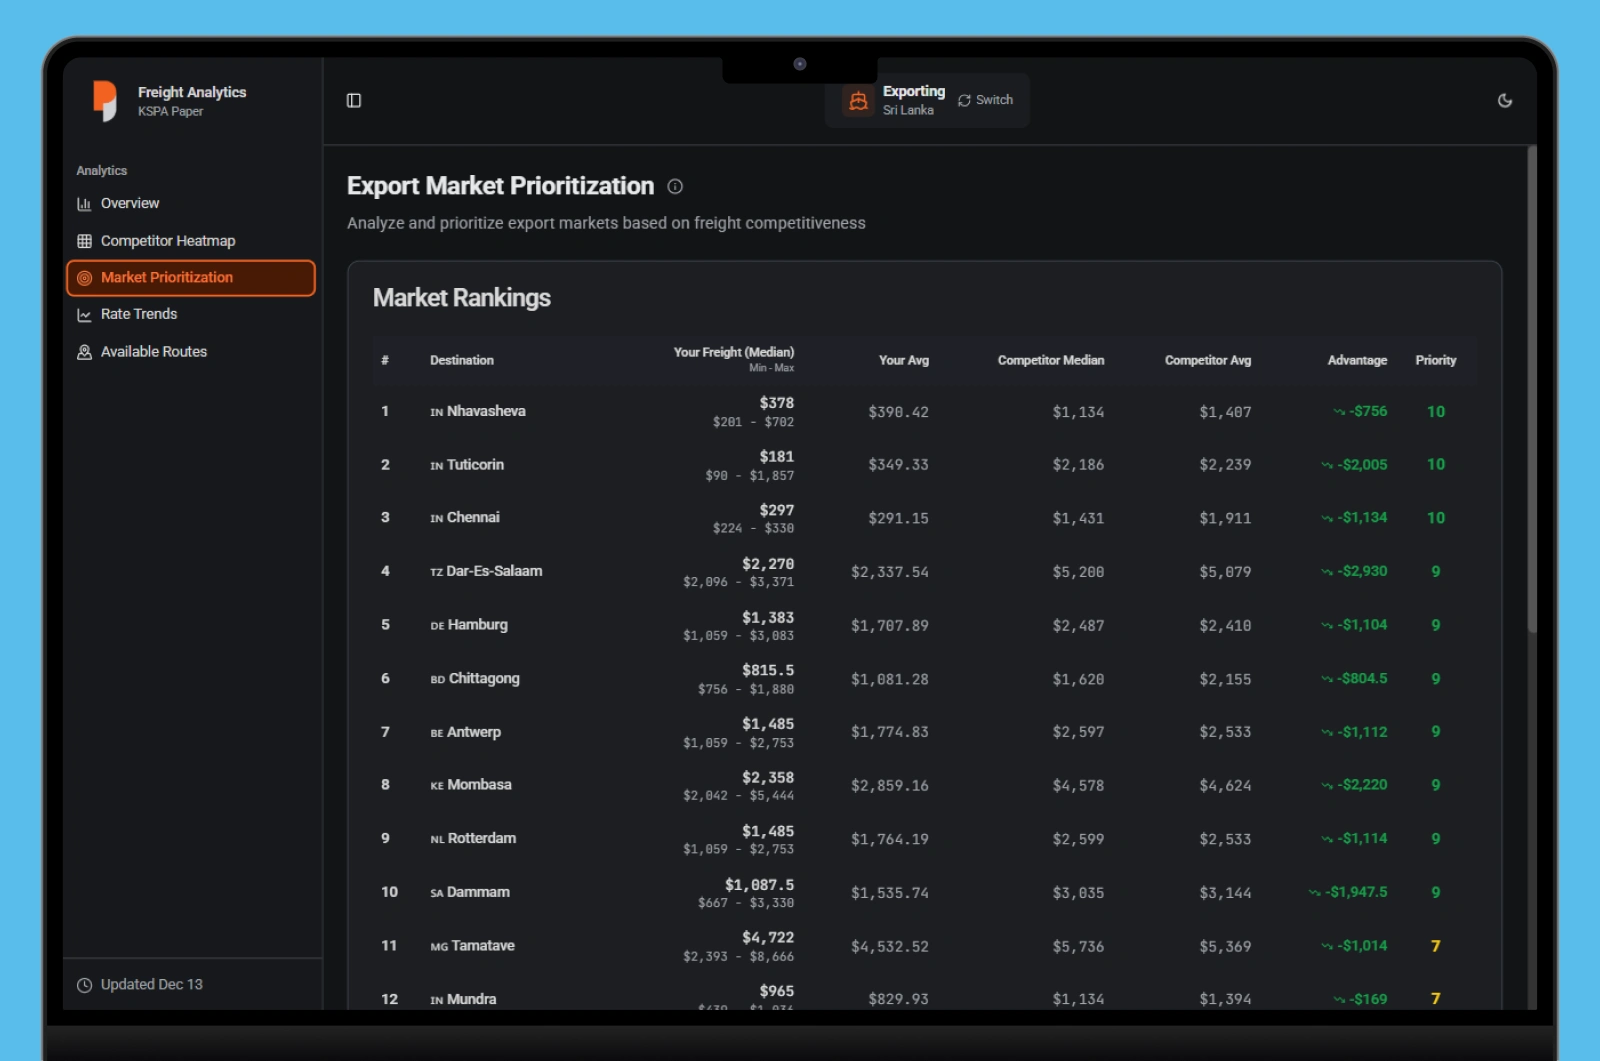
Strategic Advantage: The team now enters negotiations armed with precise competitive rankings, allowing for proactive price adjustments.
Complete Visibility: Transitioned from monitoring 10 routes monthly to 300 routes daily.
Like this project
Posted Jan 2, 2026
The KSPA Paper Freight Analytics Dashboard represents a strategic transformation of how a Sri Lankan paper exporter approaches global market competitiveness.
Likes
0
Views
1