HR Analytics / Performance / Satisfaction - Dashboard
Daniel van Dongen
HR Analytics Dashboard for Employee Performance and Satisfaction
This project showcases an HR analytics dashboard designed to provide valuable insights into employee performance, productivity, and satisfaction across various metrics. The dataset includes essential employee information such as job roles, education levels, performance scores, and satisfaction ratings, making it ideal for conducting in-depth churn analysis, performance evaluation, and workforce optimization.
🔍 Key Features
Interactive Design: The dashboard spans two pages, each dedicated to specific aspects of HR analytics:
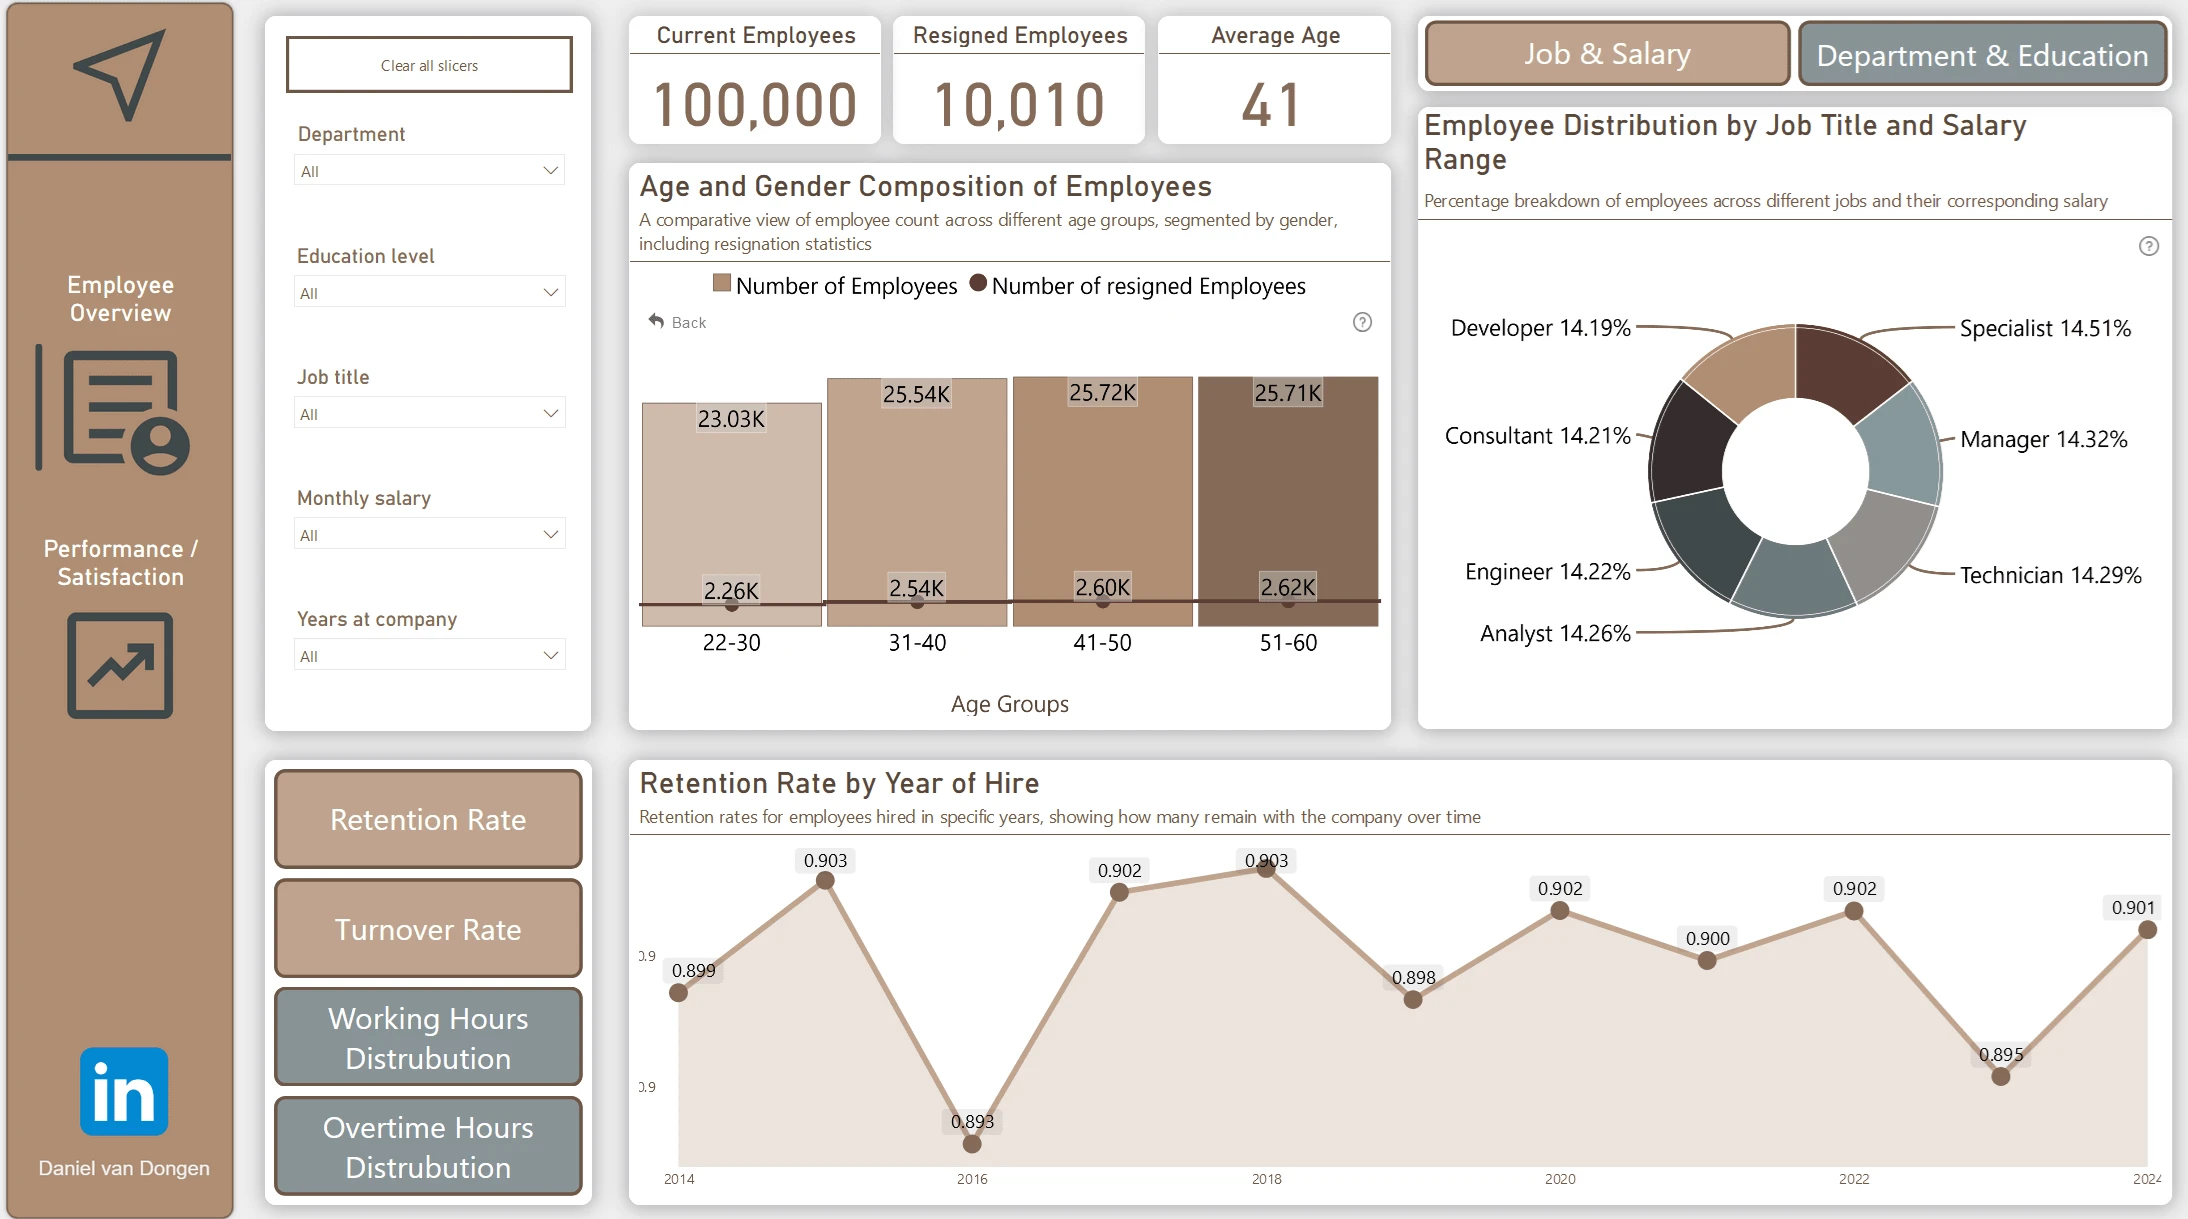
Page 1: Employee Overview
Offers a comprehensive view of employee demographics, turnover rates, retention trends, and working hours distribution. This section helps HR managers understand the composition of the workforce and identify areas for retention improvement.
Page 2: Performance and Satisfaction Analysis
Delves into the factors influencing employee performance and satisfaction. It includes breakdowns by salary groups, team size, remote work patterns, and the number of promotions, allowing for data-driven decision-making.
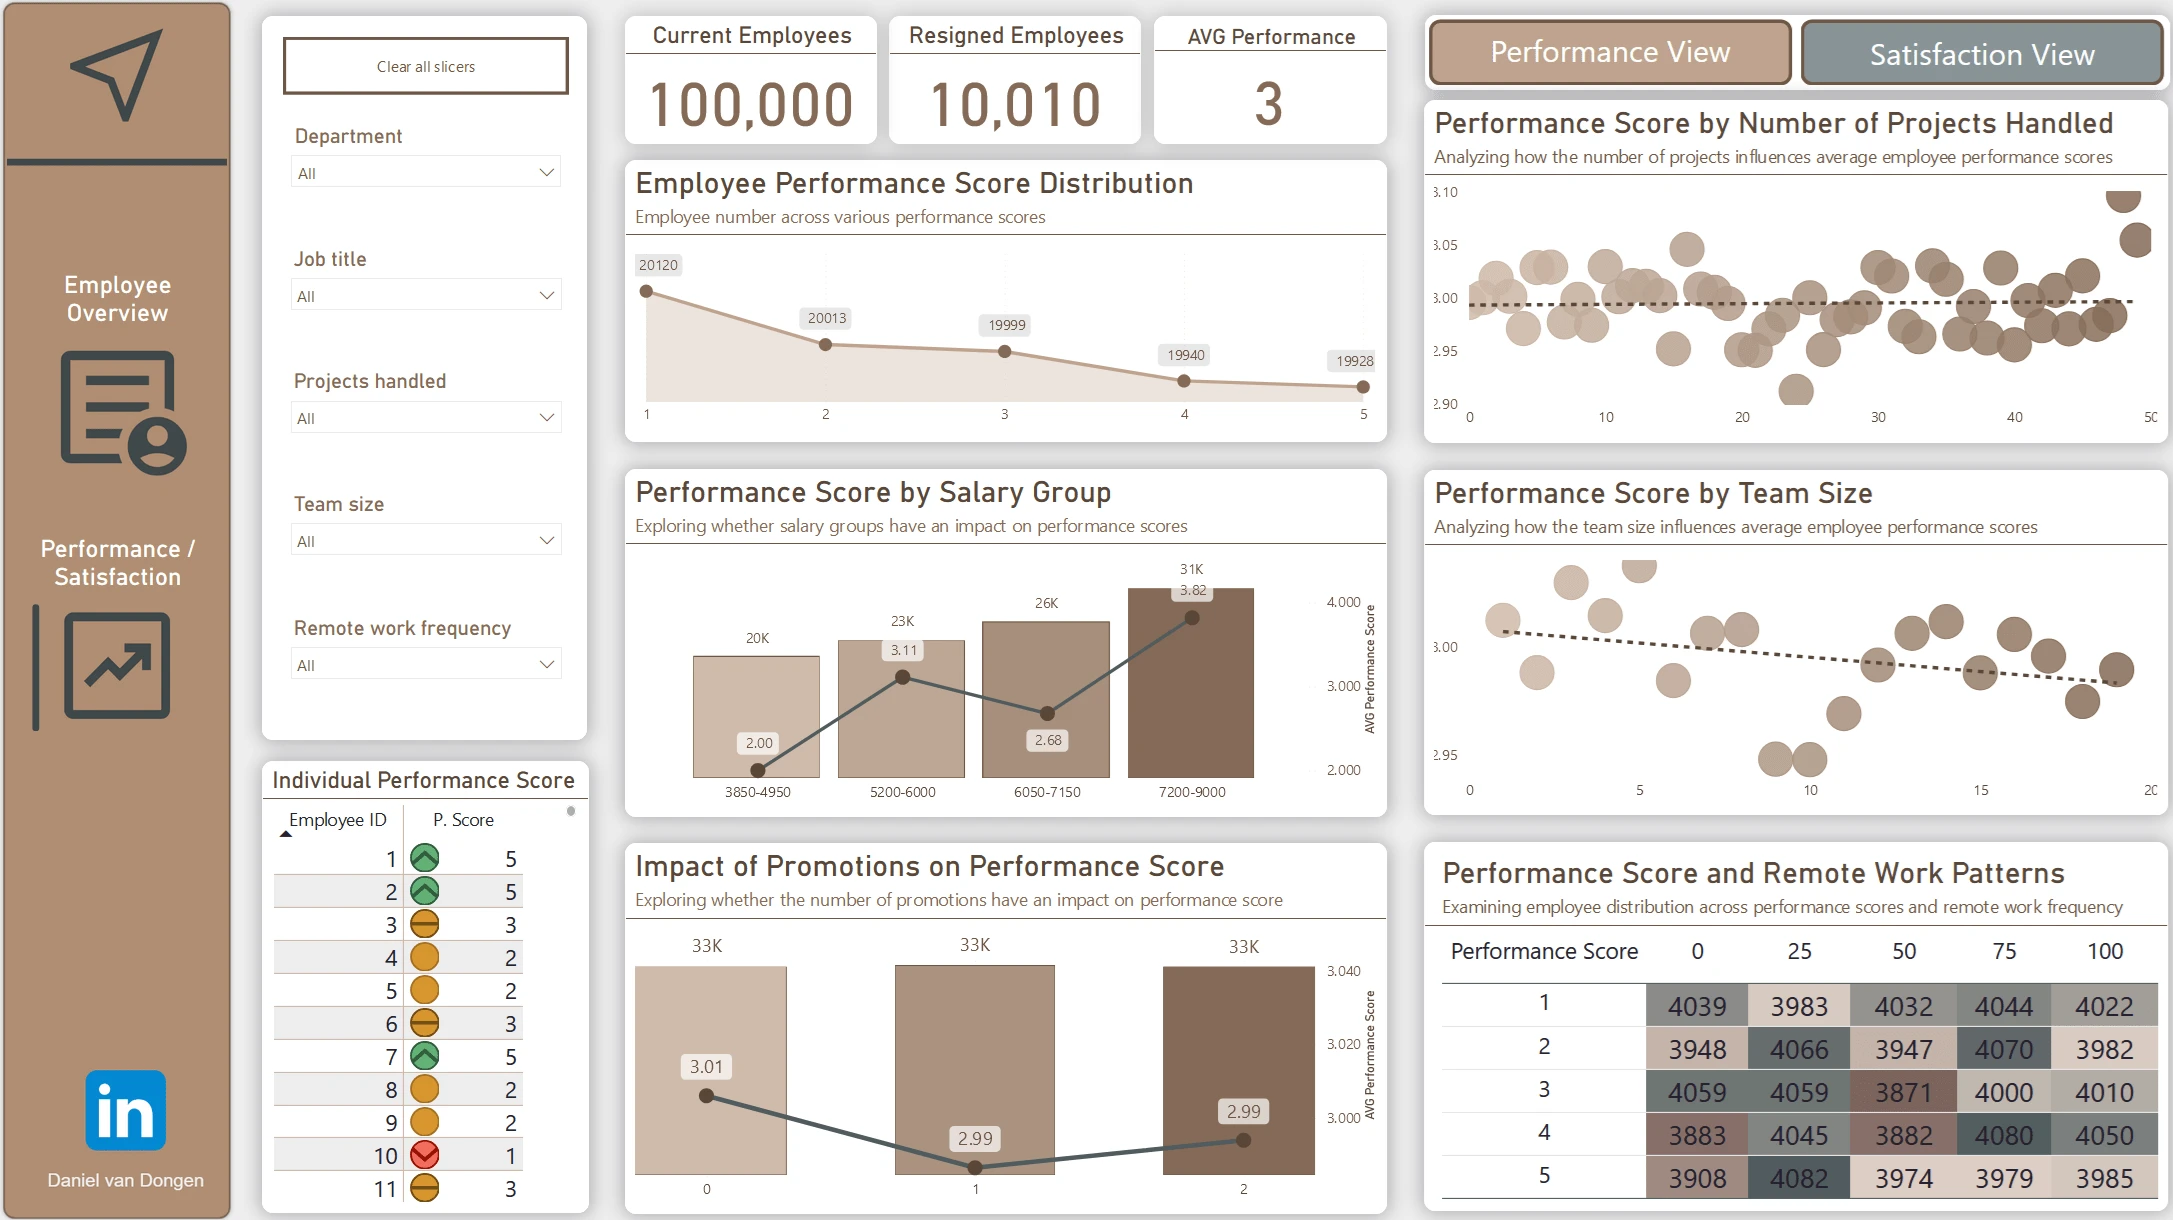
Performance View
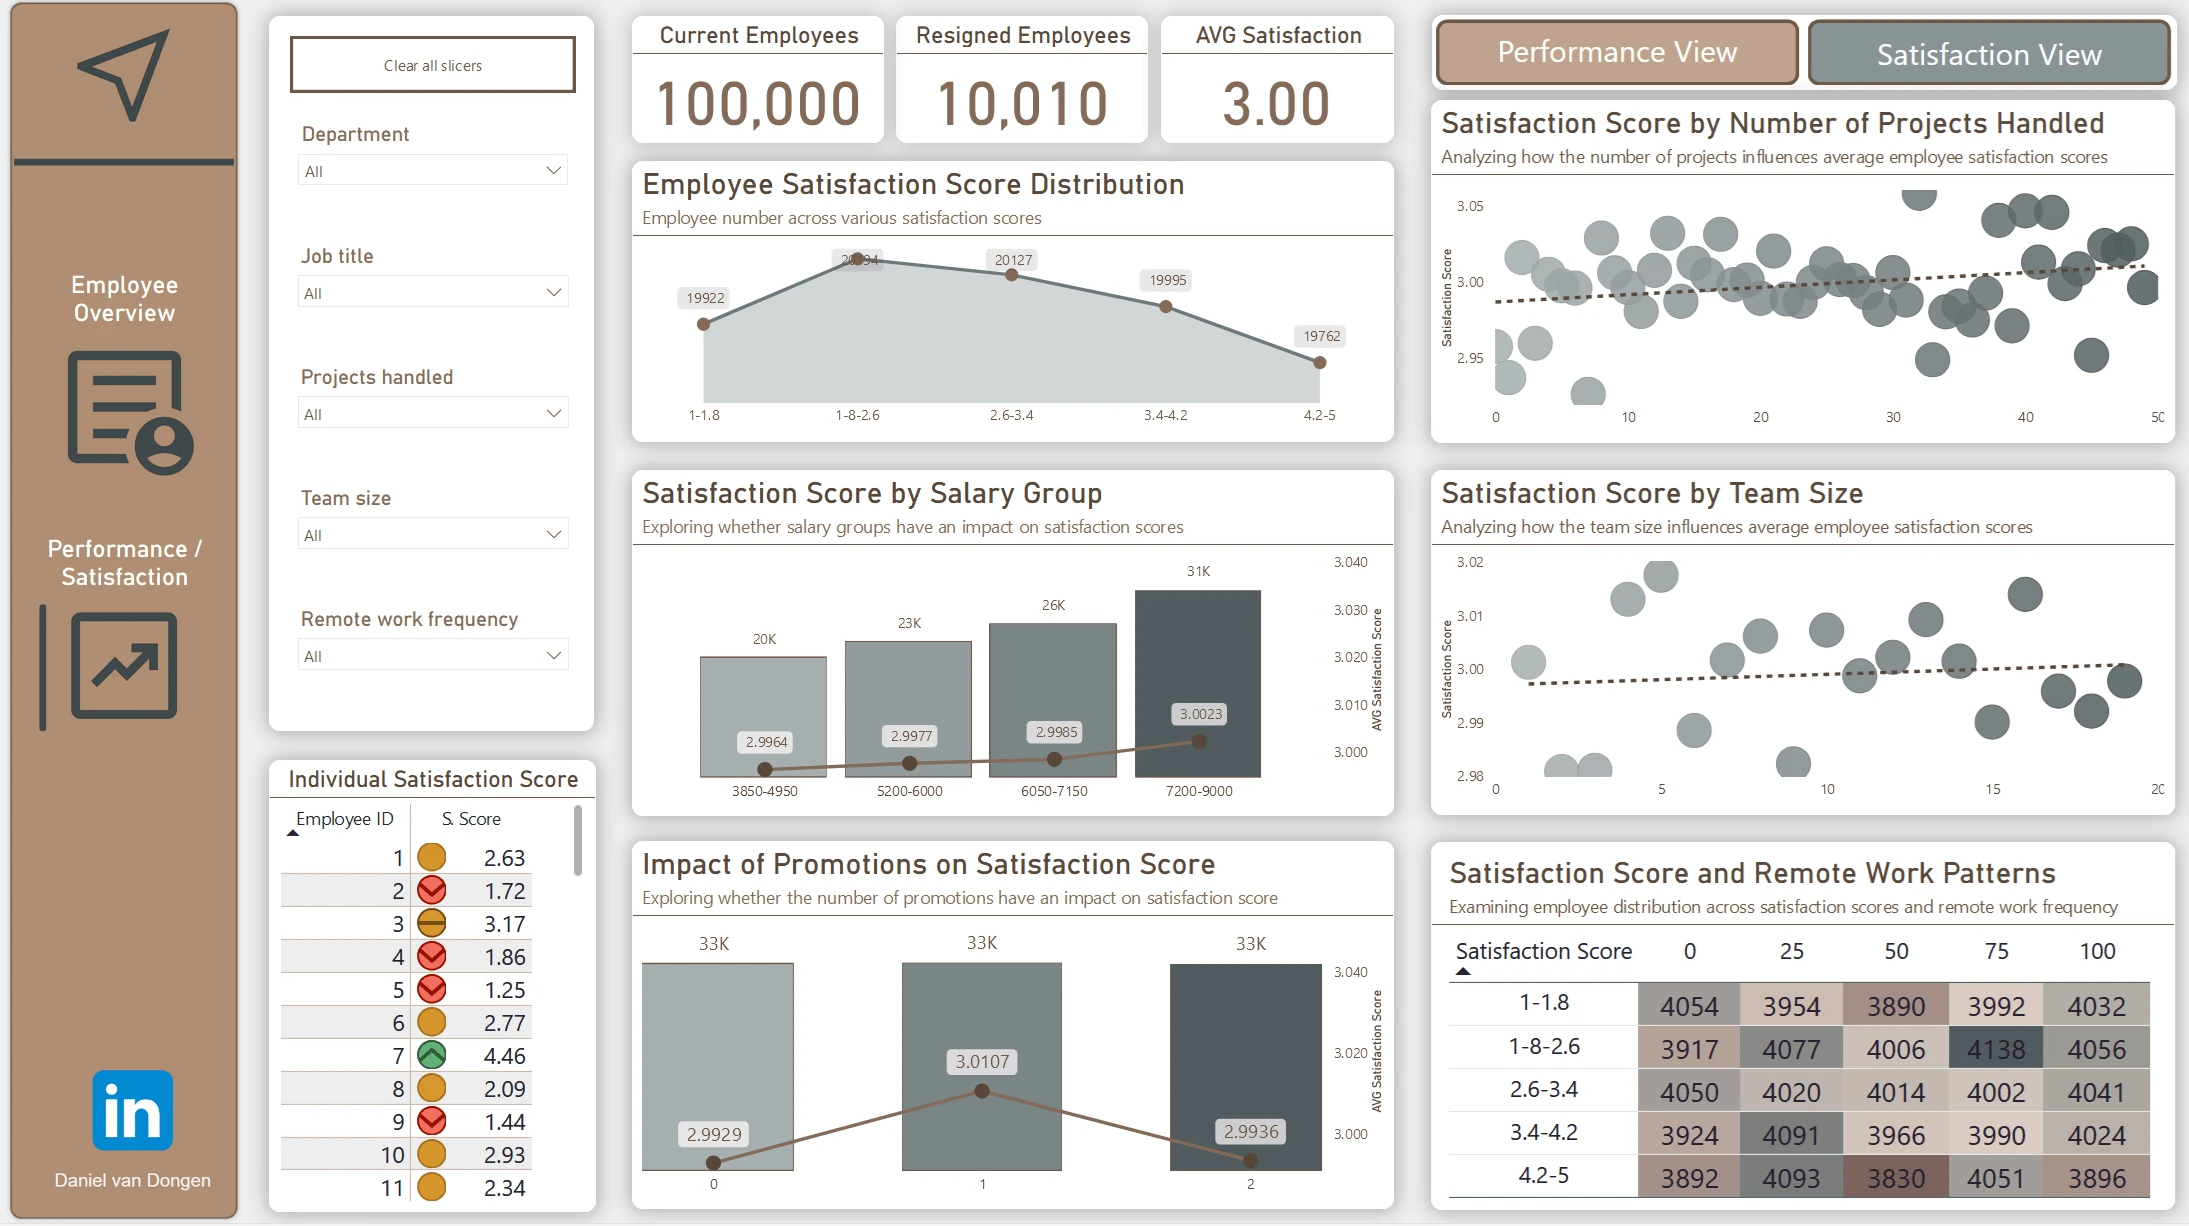
Satisfaction view
User-Friendly Navigation:
The dashboard includes intuitive filtering options and interactive buttons, making it easy to explore different data segments without overwhelming the user. The navigation is designed to facilitate a seamless user experience, encouraging exploration of key metrics.
📊 Analysis Capabilities
Employee Demographics:
Provides visualizations of employee age distribution, gender composition, and job titles, offering insights into the diversity and structure of the workforce.
Retention and Turnover Trends:
Displays historical retention rates and turnover patterns, aiding in the identification of potential risks and areas for strategic HR interventions.
Performance Metrics:
Analyzes the impact of factors like salary group, number of projects handled, and team size on employee performance scores. This section is crucial for recognizing high-performing teams and optimizing resource allocation.
Satisfaction Insights:
Examines employee satisfaction levels across various dimensions, including workload, promotion frequency, and work environment, to identify drivers of employee engagement and areas for improvement.
🎨 Design Philosophy
The dashboard was designed with a focus on clarity and actionable insights. By presenting complex data in a structured, easy-to-understand format, the dashboard enables HR professionals to quickly identify trends and take informed actions. The use of color-coding and interactive elements further enhances the user's ability to interpret data and uncover key insights.
🚀 Results
This dashboard not only streamlines the process of HR reporting but also empowers organizations to make data-driven decisions, ultimately leading to improved employee satisfaction, higher productivity, and reduced turnover.
Like this project
Posted Oct 28, 2024
HR dashboard offering insights into employee performance, satisfaction, and trends to boost data-driven HR decisions.