Ecommerce / Engagement - Dashboard
Daniel van Dongen
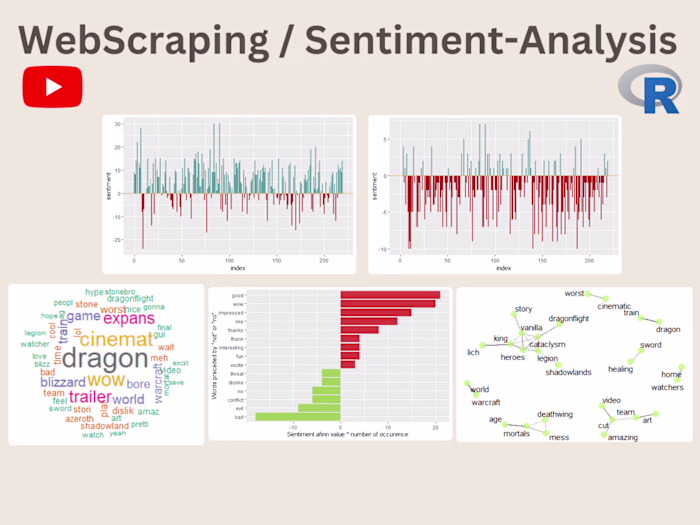
E-commerce and Follower Engagement Dashboards / PowerBI
Overview
This project contains two interactive dashboards designed to visualize key metrics for an E-commerce Sales Dashboard and a Follower Engagement Dashboard. These dashboards provide insights into various business performance indicators, including sales trends, profit breakdowns, follower growth, and engagement statistics.
E-commerce Sales Dashboard
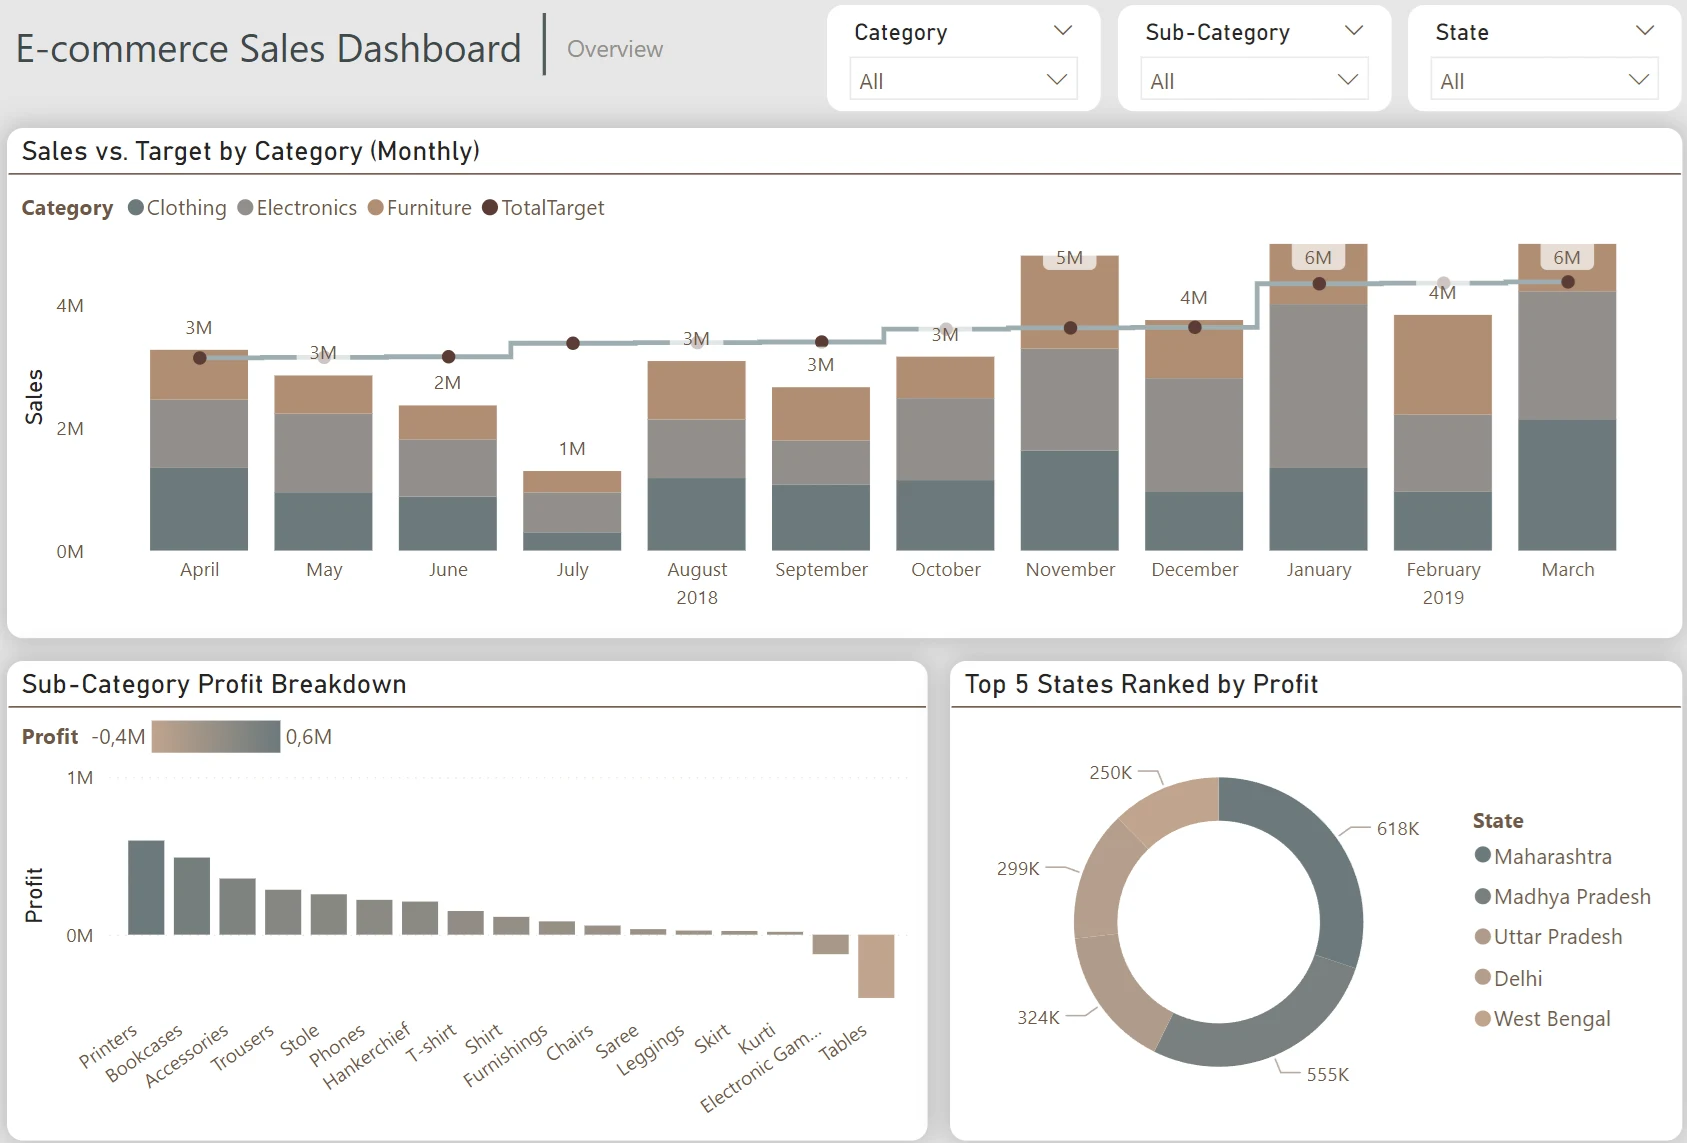
This dashboard tracks monthly sales performance, providing clear comparisons between target sales and actual sales across multiple product categories. Key features include:
Sales vs. Target by Category (Monthly): Visual representation of sales performance for categories like Clothing, Electronics, and Furniture, benchmarked against target values.
Sub-Category Profit Breakdown: Detailed profit margins across sub-categories such as printers, bookcases, and electronic games.
Top 5 States Ranked by Profit: Pie chart displaying the most profitable states (e.g., Maharashtra, Madhya Pradesh) in terms of sales and profits.
Follower Engagement Dashboard
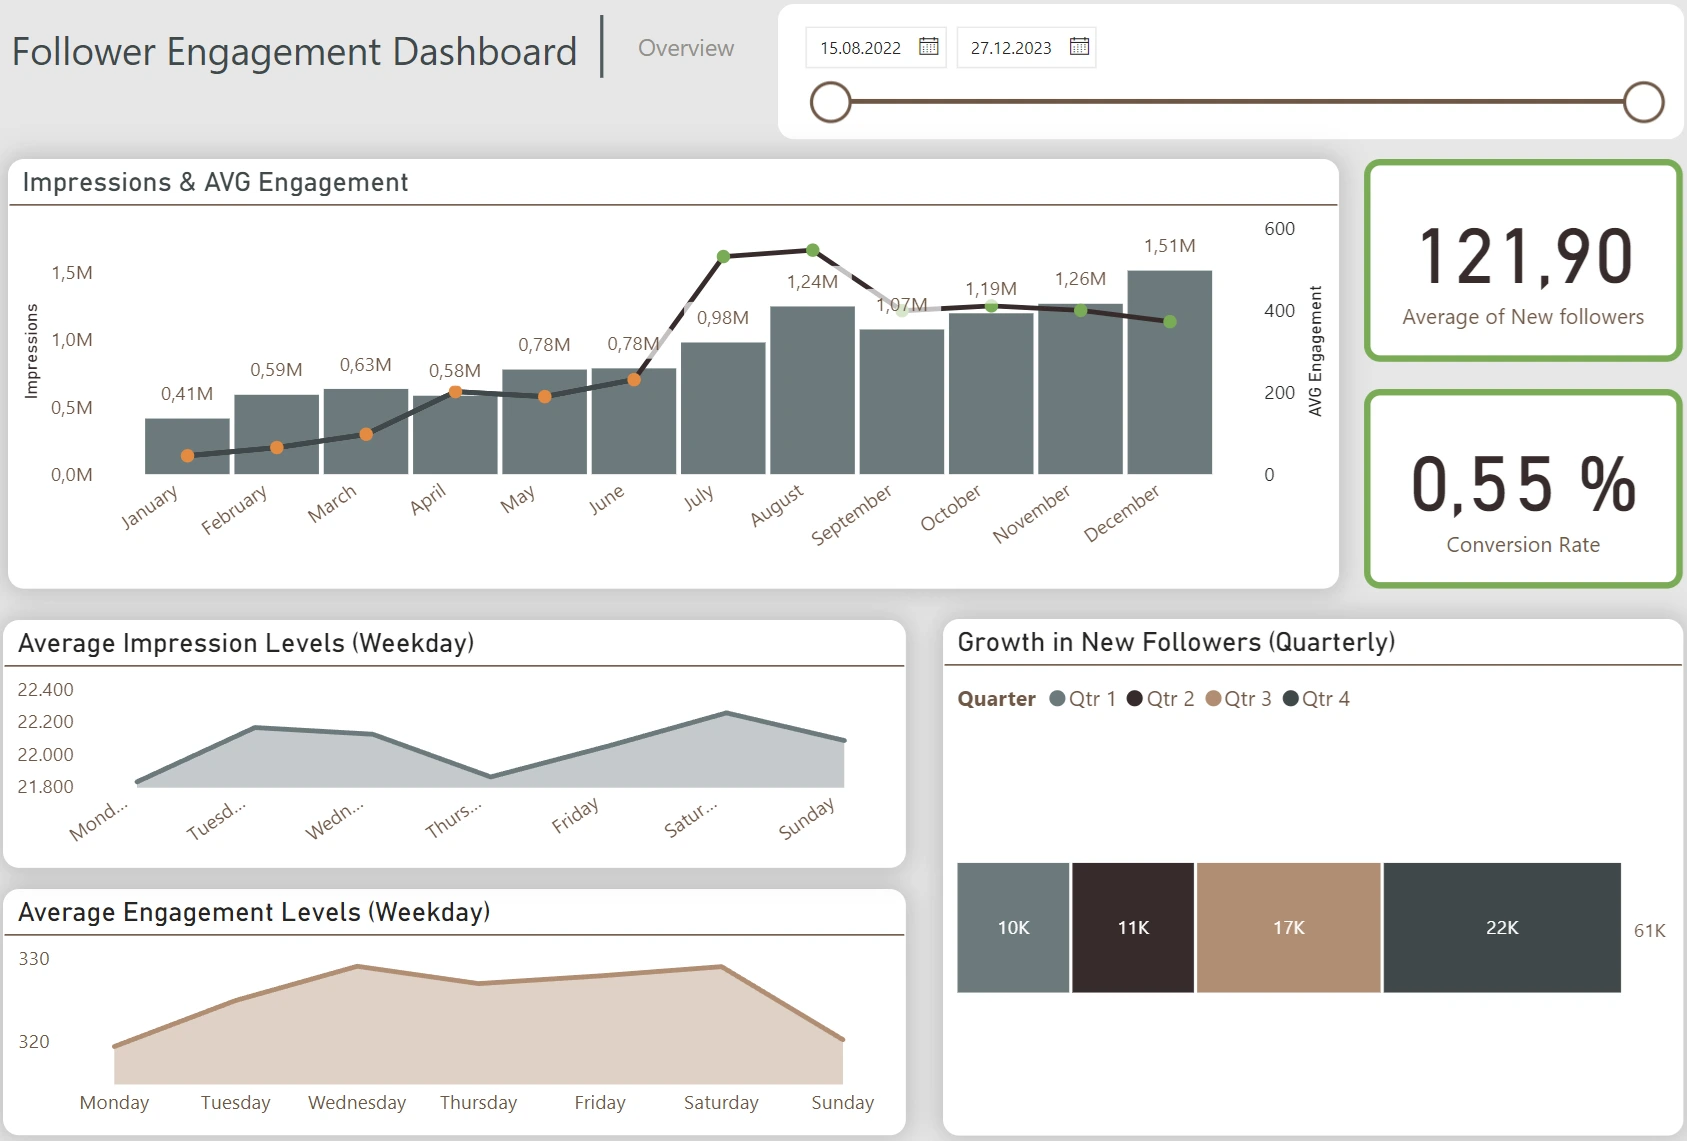
This dashboard provides valuable metrics for social media engagement and growth, ideal for tracking audience interaction over time. Key features include:
Impressions & AVG Engagement: Monthly trendline showcasing the number of impressions and the average engagement level of followers.
Growth in New Followers (Quarterly): Bar graph illustrating the quarterly growth in follower numbers.
Average Impression and Engagement Levels (Weekday): Line charts displaying average impressions and engagement across different weekdays.
Thought Process and Insights
The E-commerce Sales Dashboard effectively visualizes critical sales and profit metrics. It allows for quick comparisons between actual sales and target goals, helping businesses identify performance gaps. The inclusion of both category and sub-category breakdowns offers a more granular view, essential for strategic decision-making.
The Follower Engagement Dashboard provides actionable insights into social media performance. The graphs are well-organized, clearly presenting follower growth trends and engagement statistics. Such insights are crucial for optimizing content strategies and improving engagement rates.
Both dashboards are user-friendly, with clear visualizations that make it easy to track performance over time. These designs are ideal for data-driven decision-making in both e-commerce and social media marketing domains.
Demo Video
Here’s a demonstration of the dashboards in action:
Like this project
Posted Oct 13, 2024
Dashboard for Ecommerce and Engagment
Likes
0
Views
6