
Mohamed Ghanem
Data Analyst | SQL, Python, Power BI & Machine Learning
New to Contra
Mohamed is building their profile!
Project Overview
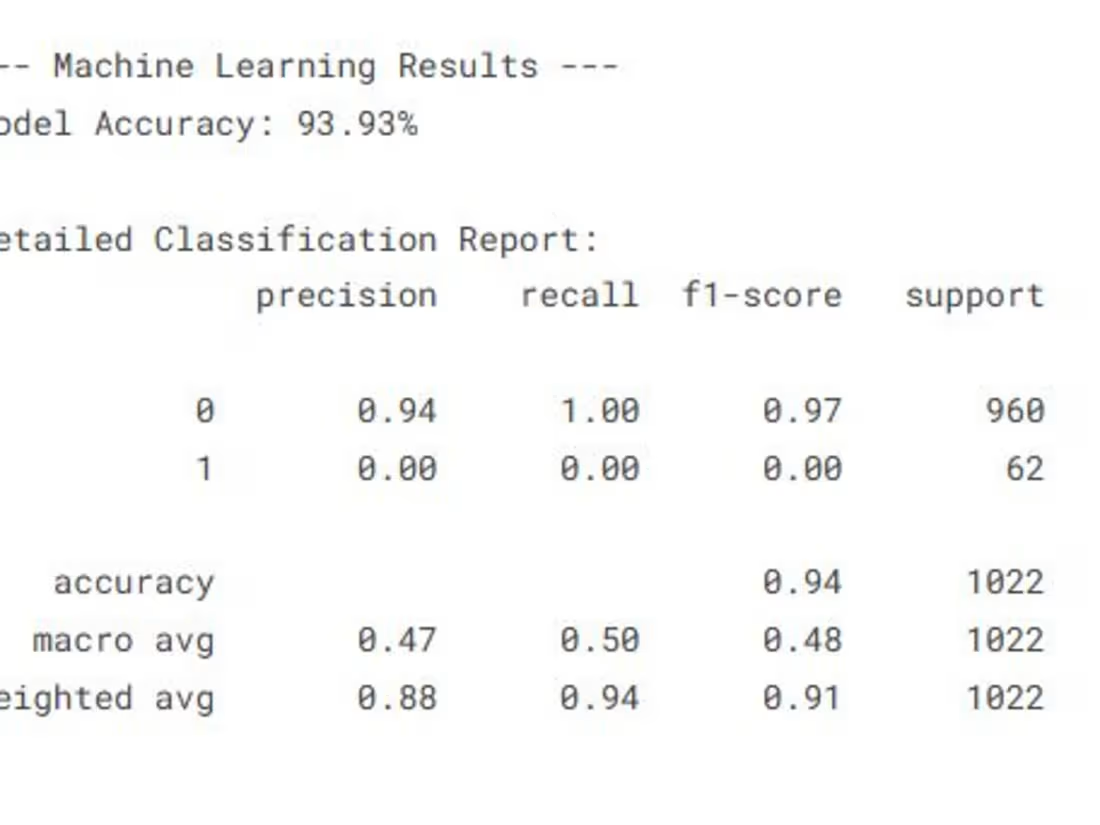
Developed a clinical data analytics and predictive machine learning project to identify key risk factors for stroke prediction. Combined healthcare domain knowledge with data science workflows to enable early risk detection using real patient datasets.
Key Insights & Features
Data Cleaning & Clinical EDA: Processed missing values and conducted exploratory data analysis on critical medical indicators including BMI, blood glucose levels, and hypertension status.
Predictive Machine Learning: Trained a Random Forest Classifier model to evaluate patient risk factors and predict stroke occurrence.
Model Performance: Achieved a predictive model accuracy of 94% in identifying high-risk clinical profiles.
Tools & Technologies
Programming & Libraries: Python (Pandas, NumPy, Scikit-learn)
Algorithms & Techniques: Random Forest Classifier, Feature Engineering, Exploratory Data Analysis (EDA)
0
8
Project Overview
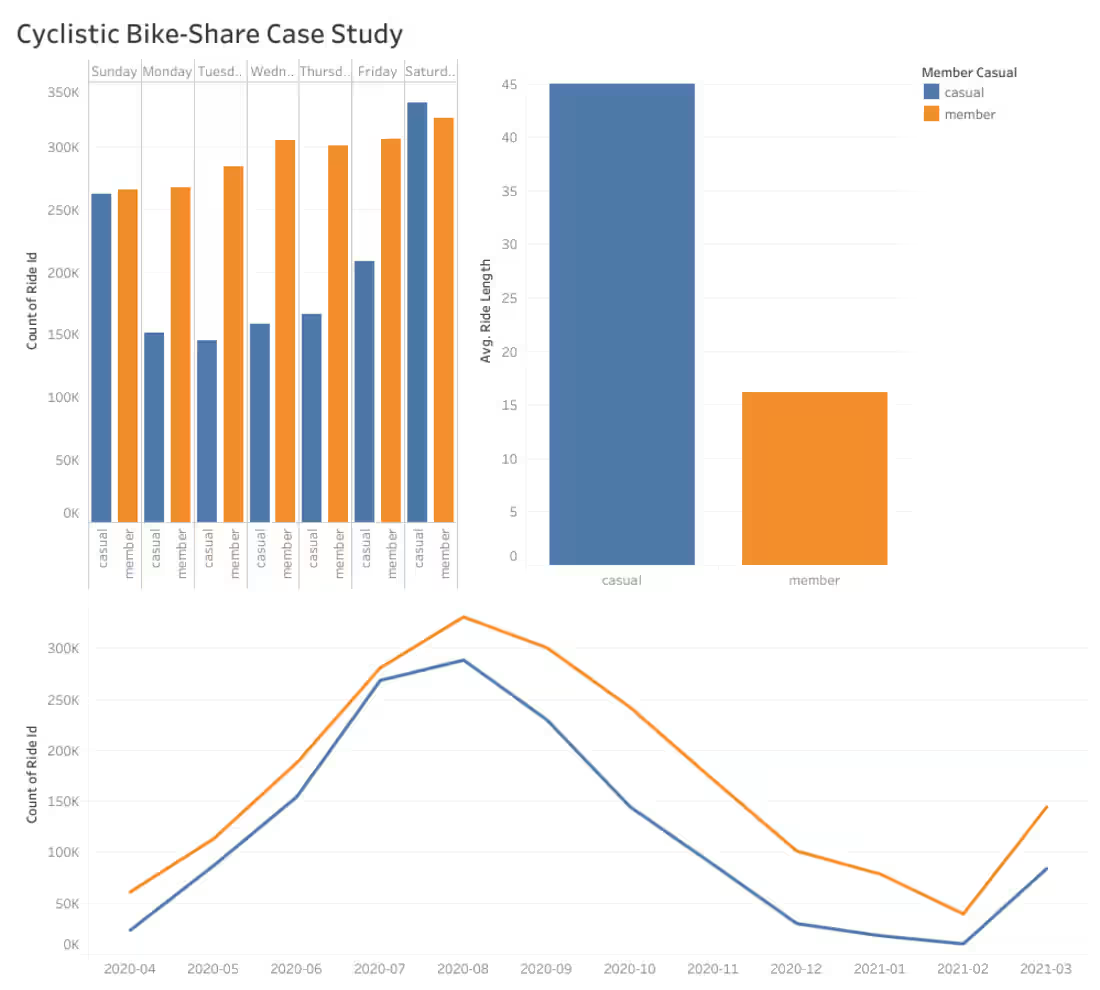
Processed and analyzed over 3.48M bike-share trip records using Python (Pandas) to evaluate behavioral differences between annual members and casual riders. Built an interactive Tableau dashboard to uncover usage patterns across days, ride durations, and seasonal trends.
Key Insights & Dashboard Features
Rider Behavior Comparison: Discovered that casual riders cycle 179% longer on weekends compared to annual members.
Temporal & Seasonal Trends: Mapped trip volume distributions throughout the week and across seasons to identify peak usage windows.
Strategic Conversion Recommendations: Formulated 3 data-driven marketing strategies to convert casual riders into annual subscribers.
Tools & Technologies
Data Processing & Feature Engineering: Python (Pandas)
Data Visualization & Dashboarding: Tableau
0
15
Project Overview
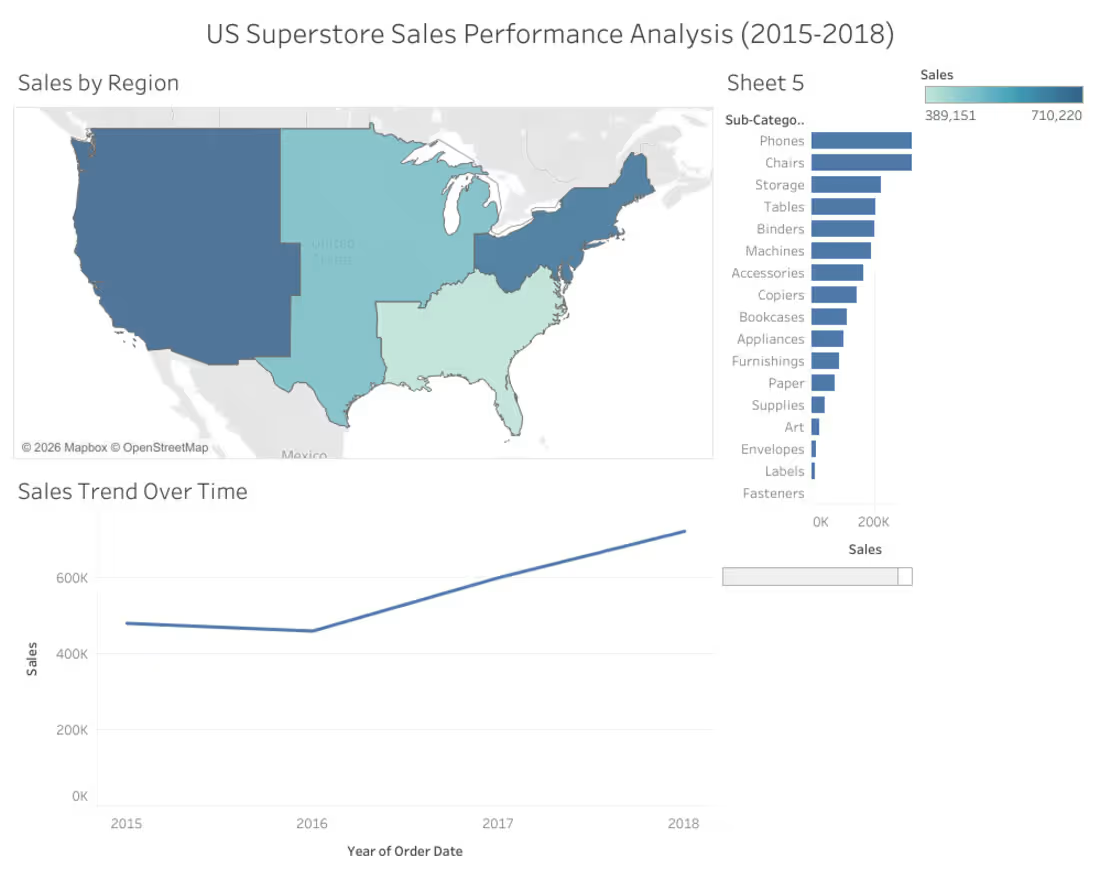
Analyzed 9,800+ transaction records using BigQuery SQL to evaluate regional sales performance and identify top revenue drivers across product categories. Designed an interactive Tableau dashboard showcasing sales trends and geographical revenue distribution from 2015 to 2018.
Key Insights & Dashboard Features
Regional Revenue Mapping: Highlighted top-performing territories, with the West region leading total revenue at $710K.
Category Performance: Identified top revenue-generating product sub-categories, led by Phones ($327K revenue).
Historical Trend Analysis: Visualized sales trajectory over time to support data-driven decisions for inventory allocation and targeted marketing campaigns.
Tools & Technologies
Data Querying & Processing: SQL (Google BigQuery)
Data Visualization & BI: Tableau
0
19
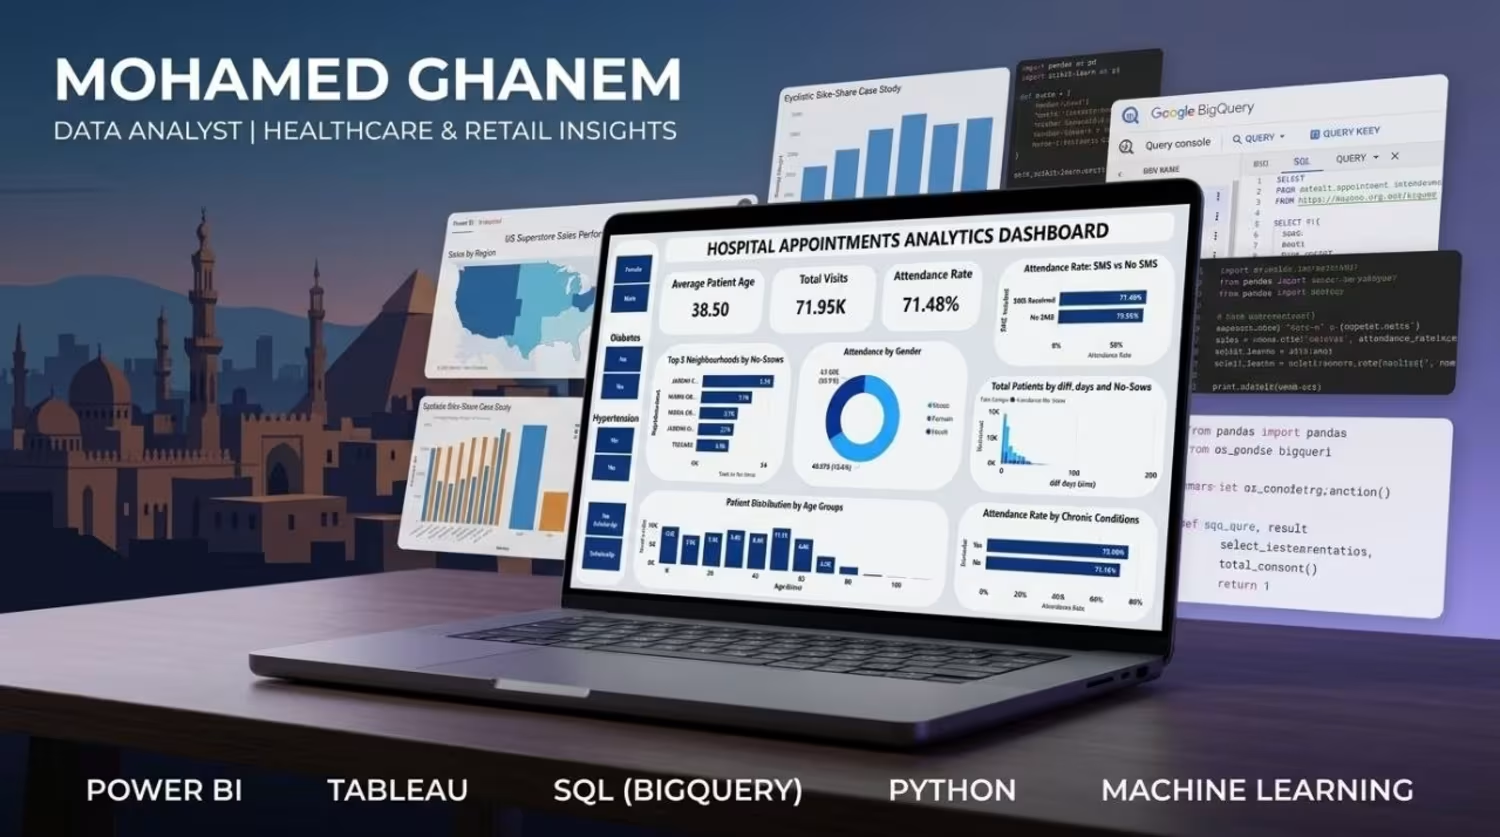
Project Overview
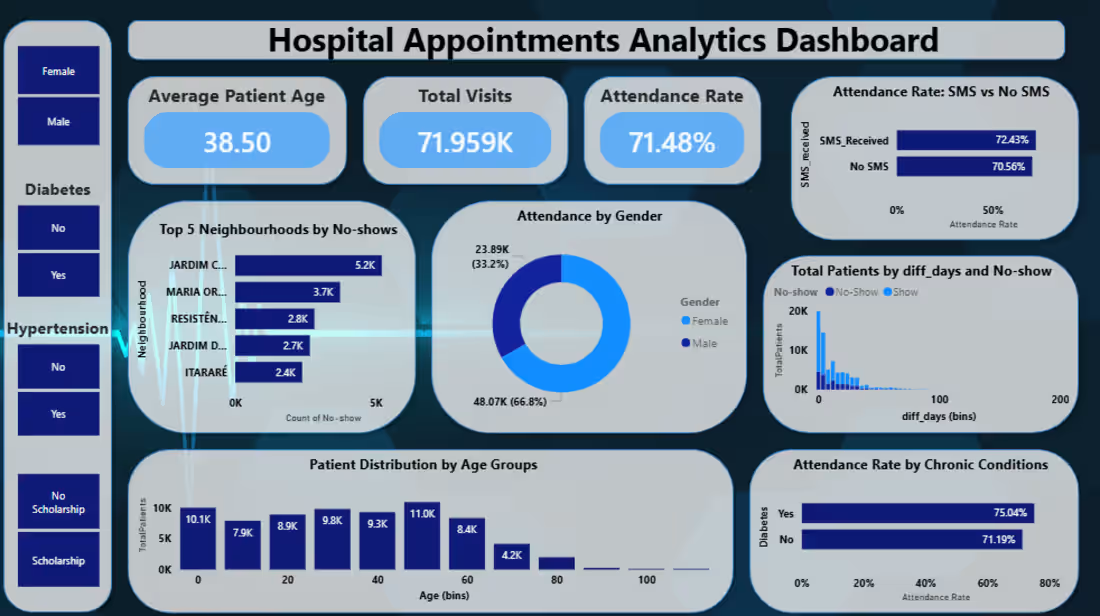
Analyzed 110K+ patient appointment records to identify key demographic and behavioral drivers behind clinic attendance and no-shows. Designed an interactive Power BI dashboard tracking a 71.48% baseline attendance rate across 71.95K+ recorded clinic visits.
Key Insights & Dashboard Features
Demographic Drivers: Identified attendance trends across age groups (average patient age: 38.50 years) and gender distribution (66.8% female vs. 33.2% male).
SMS Reminder Impact: Evaluated notification efficiency, revealing higher attendance rates among patients receiving SMS reminders compared to non-recipients.
Geographic & Chronic Risk Profiling: Mapped top neighborhoods with highest no-show counts and evaluated attendance correlation with chronic conditions like Diabetes and Hypertension.
Predictive Modeling: Built machine learning classification models (CatBoost, XGBoost, SMOTE) in Python to predict high-risk no-shows and optimize reminder schedules.
Tools & Technologies
Data Processing & ML: Python (Pandas, Scikit-learn), SMOTE, XGBoost, CatBoost
Visualization & BI: Power BI, DAX, Power Query
you can see the job here[https://www.kaggle.com/code/mohamedmoustfaghanem/hospital-operations ]
0
21