The network for creativity
Join 1.25M professional creatives like you
Connect with clients, get discovered, and run your business 100% commission-free
Creatives on Contra have earned over $150M and we are just getting started
Back to feedPost
Project Overview
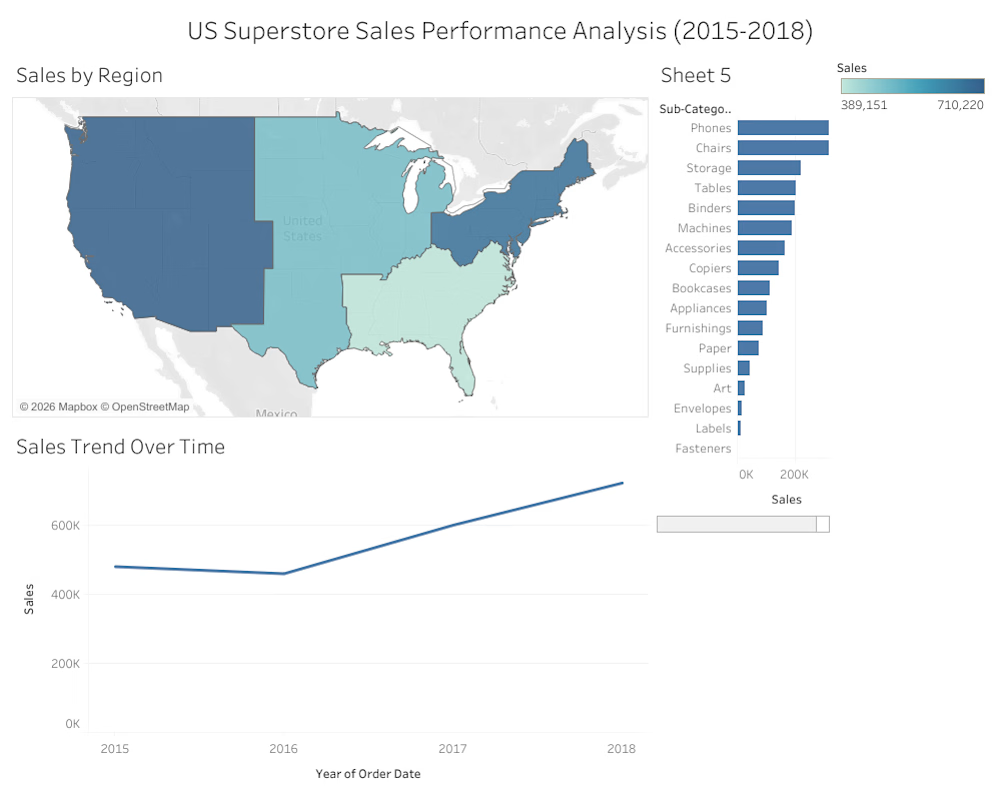
Analyzed 9,800+ transaction records using BigQuery SQL to evaluate regional sales performance and identify top revenue drivers across product categories. Designed an interactive Tableau dashboard showcasing sales trends and geographical revenue distribution from 2015 to 2018.
Key Insights & Dashboard Features
Regional Revenue Mapping: Highlighted top-performing territories, with the West region leading total revenue at $710K.
Category Performance: Identified top revenue-generating product sub-categories, led by Phones ($327K revenue).
Historical Trend Analysis: Visualized sales trajectory over time to support data-driven decisions for inventory allocation and targeted marketing campaigns.
Tools & Technologies
Data Querying & Processing: SQL (Google BigQuery)
Data Visualization & BI: Tableau


The network for creativity
Join 1.25M professional creatives like you
Connect with clients, get discovered, and run your business 100% commission-free
Creatives on Contra have earned over $150M and we are just getting started
Trending
retrofuturism
Share your favorite designs from the past exploring the distant future. Or your own take on the aesthetic 🚀
halftone
Dots. Texture. Grain. Let's see your designs using the halftone technique.

Midjourney
Creatives are showing off what they're making with Midjourney.
colorgrade
Video editors sound off: How do you enhance the mood of your video in color grading?



Related posts



One thing I’ve learned from working with data is that the numbers are only the beginning. The real value comes from understanding the story behind them and turning that into action.

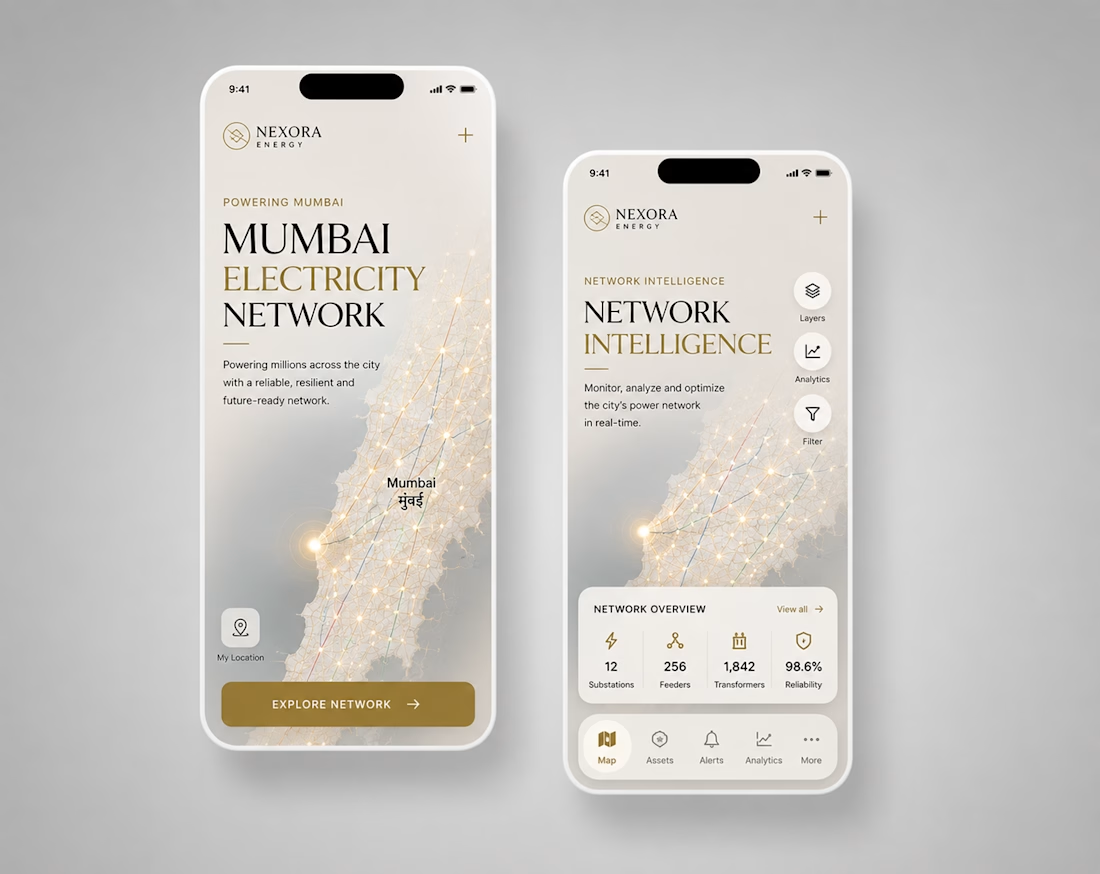
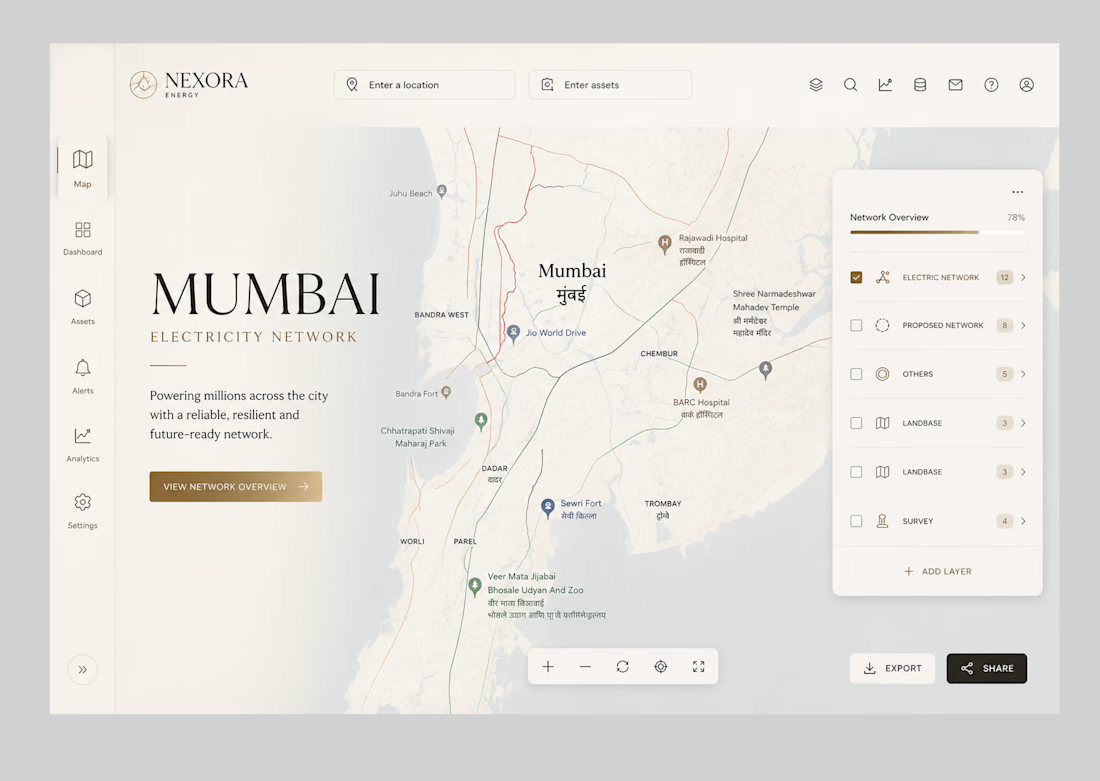
Designed a smarter way to understand complex energy networks.
A UX/UI and product design exploration for Adani Electricity, bringing network mapping, infrastructure data, alerts and analytics into a clearer experience across mobile and web.
A project focused on enterprise UX, data visualization and scalable product thinking.
Open to product design collaborations and long-term design partnerships.




Project Overview
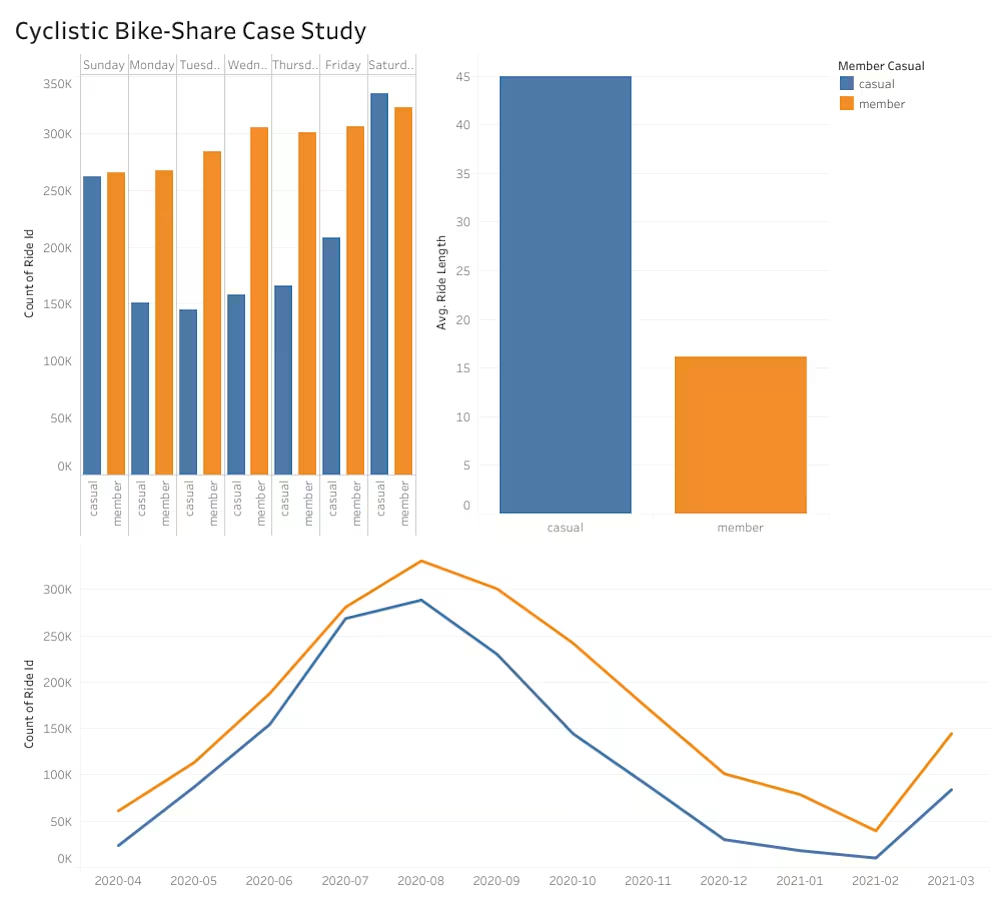
Processed and analyzed over 3.48M bike-share trip records using Python (Pandas) to evaluate behavioral differences between annual members and casual riders. Built an interactive Tableau dashboard to uncover usage patterns across days, ride durations, and seasonal trends.
Key Insights & Dashboard Features
Rider Behavior Comparison: Discovered that casual riders cycle 179% longer on weekends compared to annual members.
Temporal & Seasonal Trends: Mapped trip volume distributions throughout the week and across seasons to identify peak usage windows.
Strategic Conversion Recommendations: Formulated 3 data-driven marketing strategies to convert casual riders into annual subscribers.
Tools & Technologies
Data Processing & Feature Engineering: Python (Pandas)
Data Visualization & Dashboarding: Tableau