The network for creativity
Join 1.25M professional creatives like you
Connect with clients, get discovered, and run your business 100% commission-free
Creatives on Contra have earned over $150M and we are just getting started
Back to feedPost

Project Overview
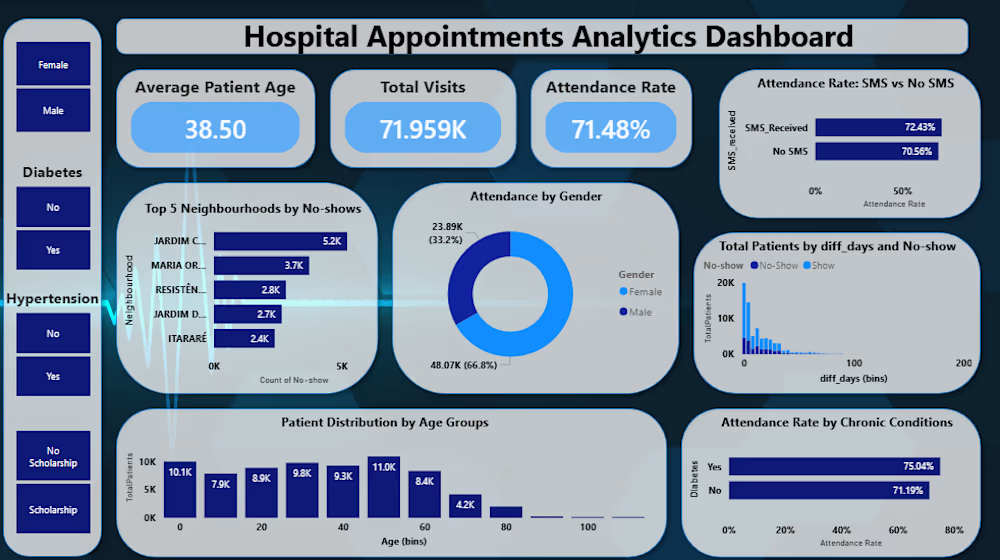
Analyzed 110K+ patient appointment records to identify key demographic and behavioral drivers behind clinic attendance and no-shows. Designed an interactive Power BI dashboard tracking a 71.48% baseline attendance rate across 71.95K+ recorded clinic visits.
Key Insights & Dashboard Features
Demographic Drivers: Identified attendance trends across age groups (average patient age: 38.50 years) and gender distribution (66.8% female vs. 33.2% male).
SMS Reminder Impact: Evaluated notification efficiency, revealing higher attendance rates among patients receiving SMS reminders compared to non-recipients.
Geographic & Chronic Risk Profiling: Mapped top neighborhoods with highest no-show counts and evaluated attendance correlation with chronic conditions like Diabetes and Hypertension.
Predictive Modeling: Built machine learning classification models (CatBoost, XGBoost, SMOTE) in Python to predict high-risk no-shows and optimize reminder schedules.
Tools & Technologies
Data Processing & ML: Python (Pandas, Scikit-learn), SMOTE, XGBoost, CatBoost
Visualization & BI: Power BI, DAX, Power Query
you can see the job here[https://www.kaggle.com/code/mohamedmoustfaghanem/hospital-operations ]


The network for creativity
Join 1.25M professional creatives like you
Connect with clients, get discovered, and run your business 100% commission-free
Creatives on Contra have earned over $150M and we are just getting started
Trending
retrofuturism
Share your favorite designs from the past exploring the distant future. Or your own take on the aesthetic 🚀
halftone
Dots. Texture. Grain. Let's see your designs using the halftone technique.

Midjourney
Creatives are showing off what they're making with Midjourney.
colorgrade
Video editors sound off: How do you enhance the mood of your video in color grading?



Related posts

📊 HR Employee Attrition Dashboard | Power BI
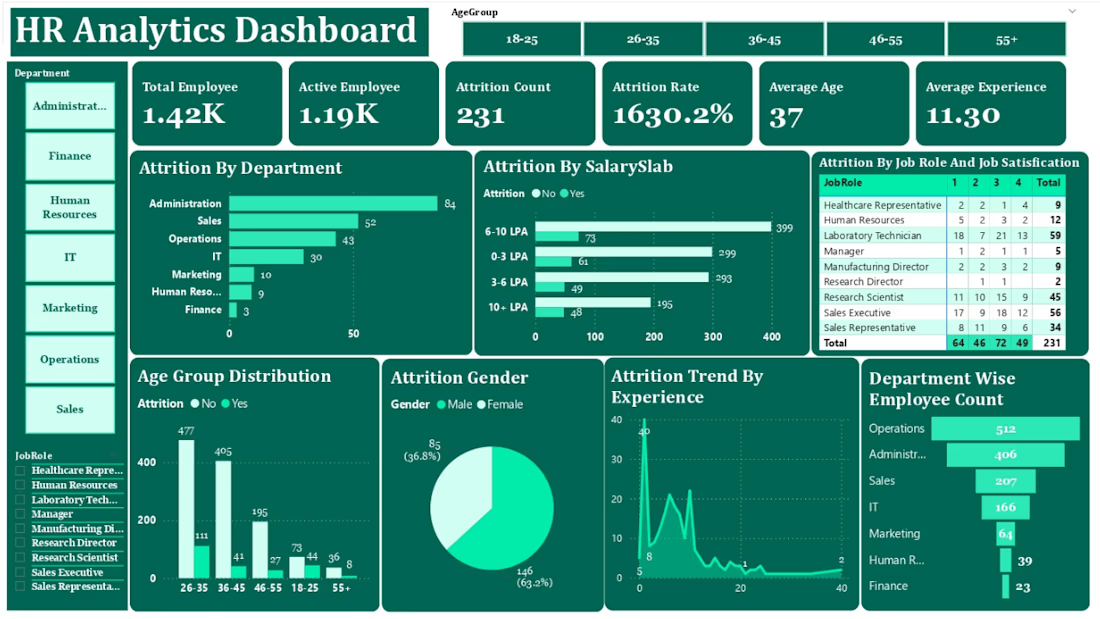
Just completed another Power BI project focused on HR Employee Attrition Analysis.
I worked with employee data to understand attrition patterns across different areas such as:
• Department
• Age Group
• Job Role
• Gender
• Business Travel
• Overtime
• Job Satisfaction
• Years at Company
The dashboard includes KPIs, interactive slicers, charts, and a summary table to make HR data easier to understand and analyze.
🛠️ Tools Used:
Power BI | Power Query | DAX | Data Cleaning | Data Visualization
This project helped me improve my skills in HR analytics, data cleaning, dashboard development, and business insights.
More projects coming soon. 🚀
#PowerBI #DataAnalytics #DataAnalyst #HRAnalytics #EmployeeAttrition #PowerQuery #DAX #DataVisualization #BusinessIntelligence #Dashboard

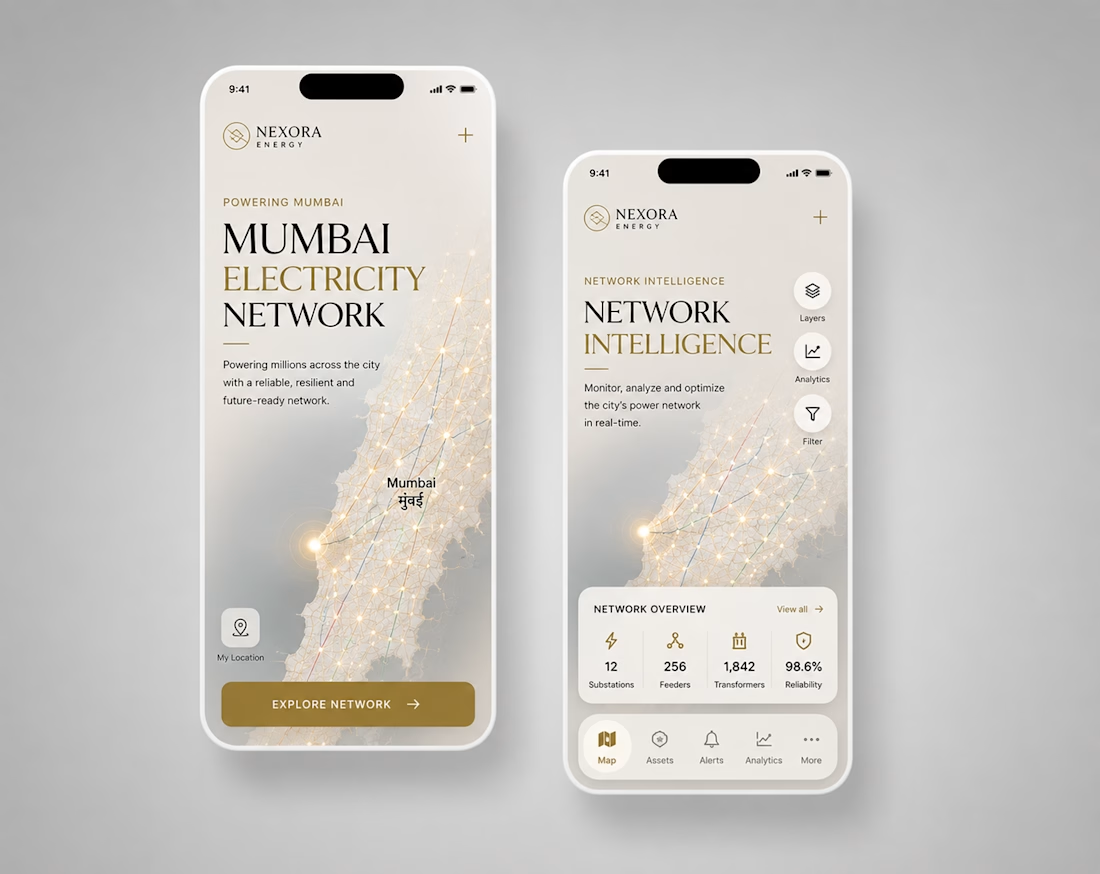
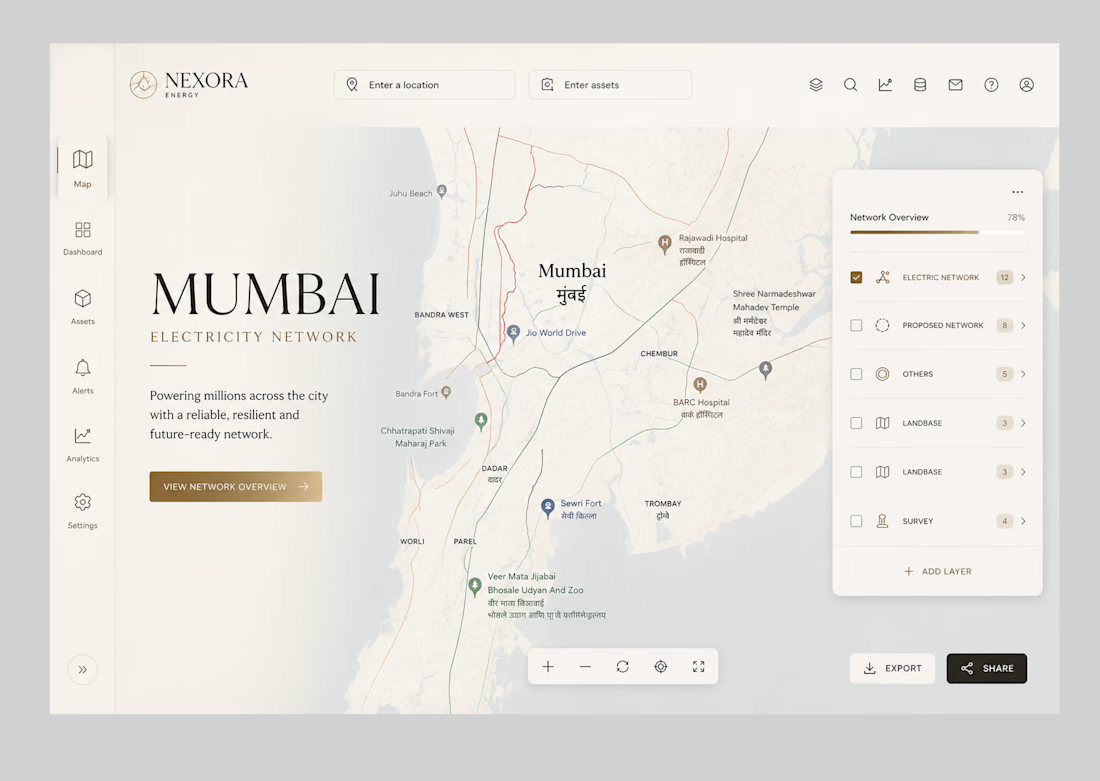
Designed a smarter way to understand complex energy networks.
A UX/UI and product design exploration for Adani Electricity, bringing network mapping, infrastructure data, alerts and analytics into a clearer experience across mobile and web.
A project focused on enterprise UX, data visualization and scalable product thinking.
Open to product design collaborations and long-term design partnerships.




Customer Behavior Dashboard (Power BI)
Problem: 3,900 raw customer transactions needed to be turned into a full analytics project, not just a chart.
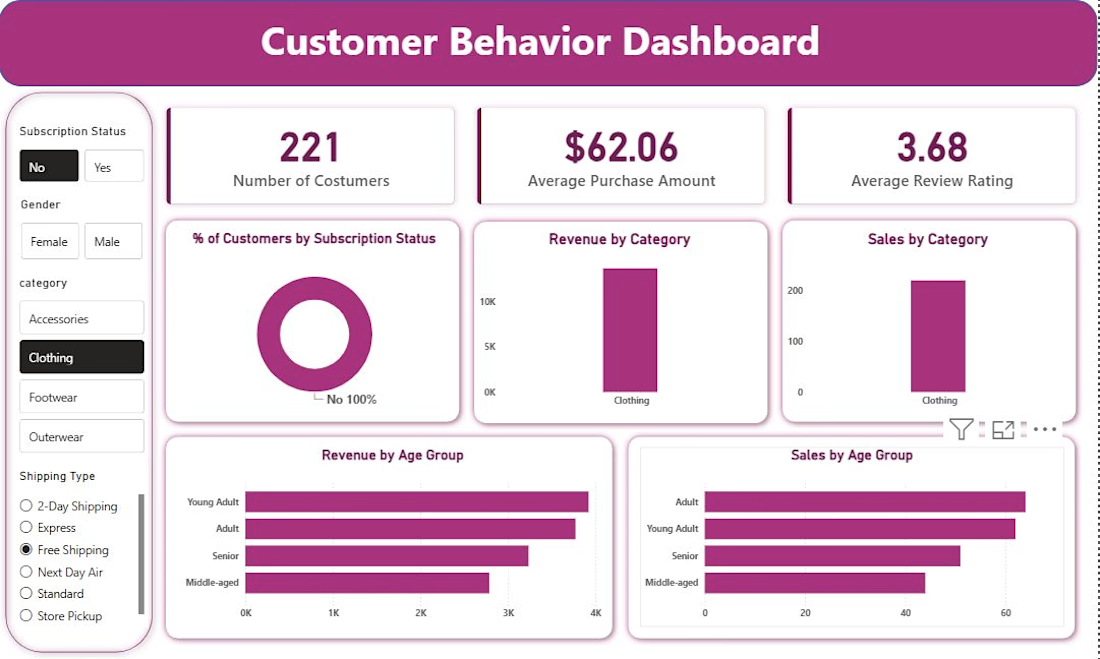
What I built: Cleaned and engineered features in Python, wrote business-focused SQL queries in PostgreSQL, then built an interactive Power BI dashboard covering subscription status, revenue and sales by category, and revenue/sales by age group.
Result: Surfaced insights like male customers driving nearly double the revenue of female customers, a clear loyalty gap among repeat non-subscribers, and pricing issues on discount-dependent products.
Tags: Python, SQL, Power BI, Customer Analytics, Business Intelligence