
Jay Salunke
Data Analyst | Python, SQL & Power BI | Accounting & Finance
New to Contra
Jay is ready for their next project!

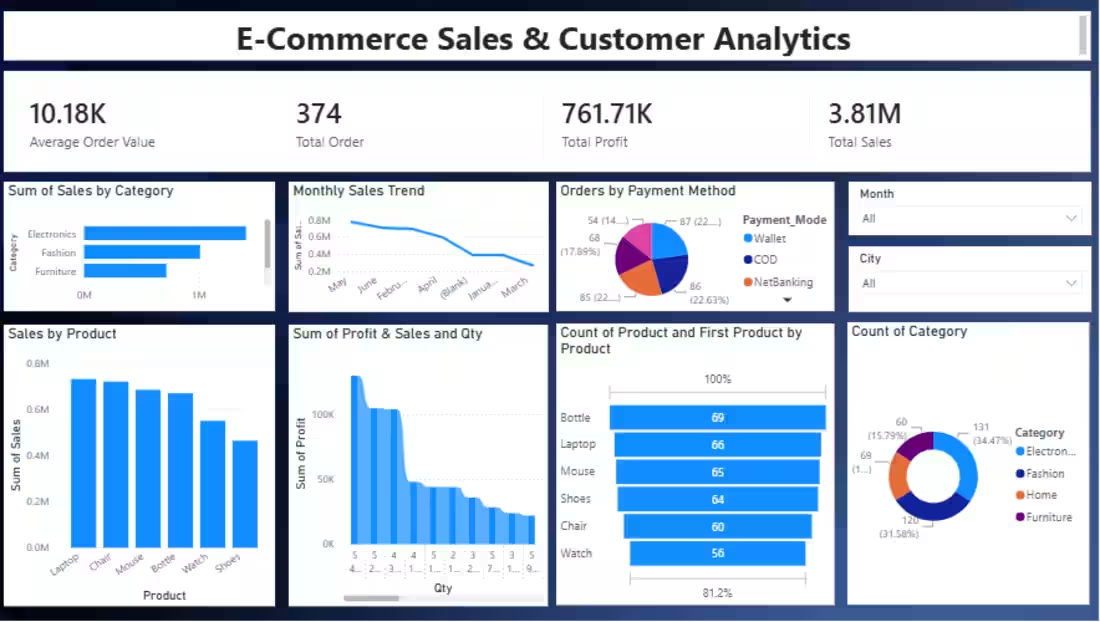
Built an end-to-end E-Commerce Sales & Customer Analytics project to turn raw sales data into actionable business insights. Cleaned and transformed data using Python, Pandas, and NumPy, analyzed sales and customer performance with SQL Server, and developed an interactive Power BI dashboard.
The project analyzes revenue, profit, customers, products, categories, regions, sales trends, and key performance indicators (KPIs) to identify business trends and performance opportunities.
Tools: Python, Pandas, NumPy, SQL Server, Excel, Power BI
0
13
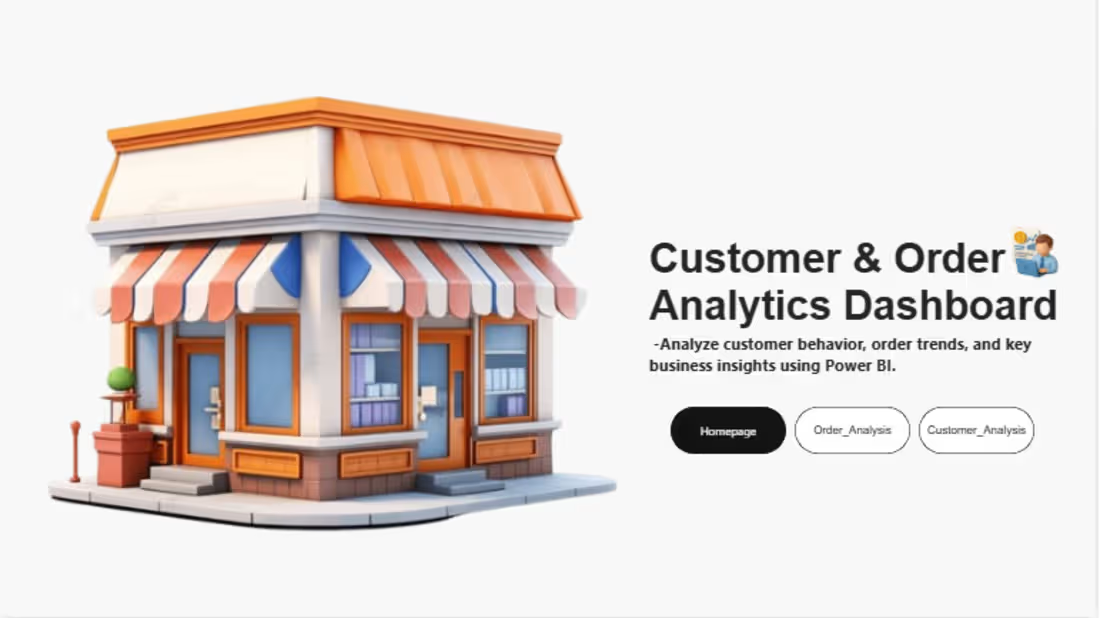
Customer & Order Analytics Dashboard — Contra
I built an interactive Customer & Order Analytics Dashboard in Power BI to analyze customer behavior, order performance, revenue trends, and key business KPIs.
The dashboard provides insights into 132M total revenue, 160K orders, 10K customers, average order value, delivery time, customer types, and repeat customers. It includes dedicated Order Analytics and Customer Analytics views with interactive filters and visualizations.
Key features:
Revenue and order performance analysis
Monthly revenue and order trends
Customer segmentation: New, Returning & Premium
Repeat customer analysis
Revenue by city
Order status analysis
Customer and order KPIs
Interactive year and status filters
Tools: Power BI, Power Query, DAX, Excel
Skills: Data Cleaning, Data Modeling, Data Analysis, KPI Reporting, Dashboard Development, Business Intelligence
0
25
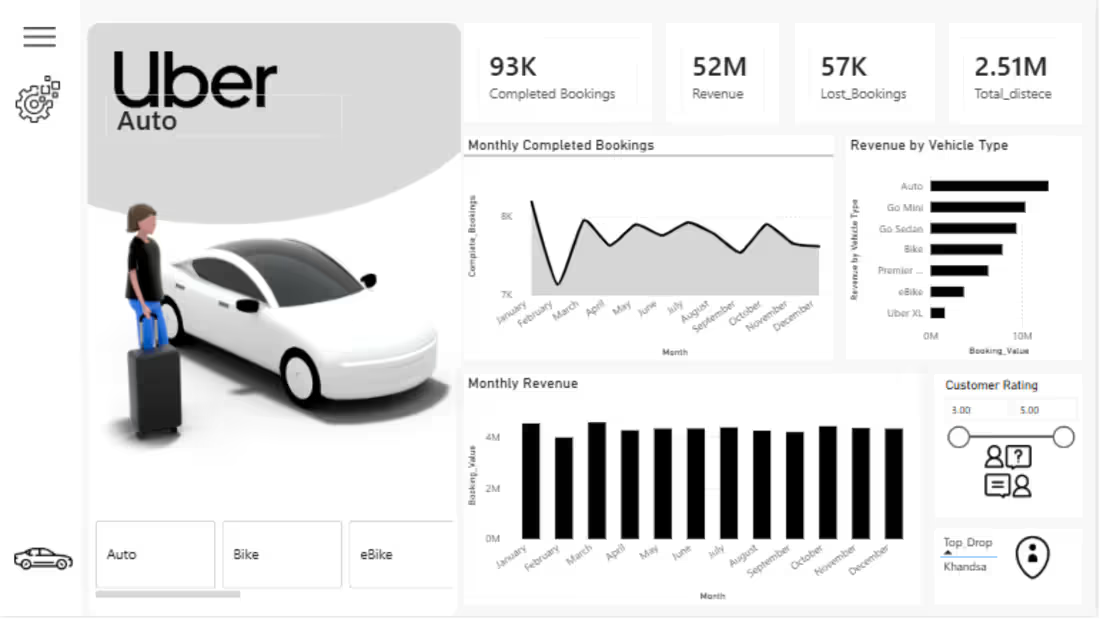
I developed an Uber Ride Booking & Revenue Analytics Dashboard in Power BI to analyze ride bookings, revenue, vehicle performance, customer ratings, cancellations, and trip distance.
The dashboard transforms raw ride-booking data into interactive insights, including 93K completed bookings, 52M revenue, 57K lost bookings, and 2.51M total distance. It also provides monthly booking and revenue trends, revenue by vehicle type, customer ratings, and top drop locations.
Tools: Power BI, Power Query, DAX, Excel
Focus: Data Cleaning, Data Analysis, KPI Reporting & Interactive Dashboard Development
0
30
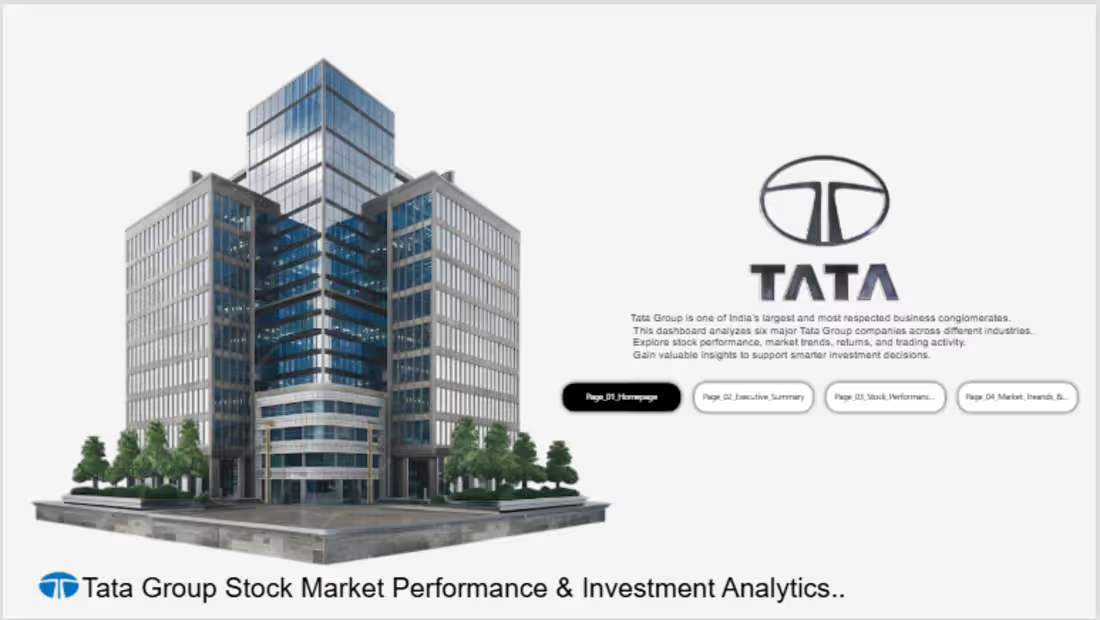
Built an interactive Power BI dashboard to analyze the stock market performance of major Tata Group companies, including TCS, Tata Motors, Tata Steel, Titan, Tata Consumer, and Tata Power.
The project focuses on stock price trends, returns, volatility, trading volume, and comparative performance to identify market trends and support data-driven investment analysis.
I cleaned and transformed the dataset, performed analytical calculations, and designed an interactive dashboard with clear KPIs and visualizations for comparing companies and understanding their historical market performance.
Tools: SQL, Python, :Power BI, Power Query, DAX, Excel, and data analysis techniques.
0
38