
Dee Chingabe
Data Analyst & BI Specialist | Power BI Dashboards | Excel |


📊 Data turns logistics chaos into pure profitability.
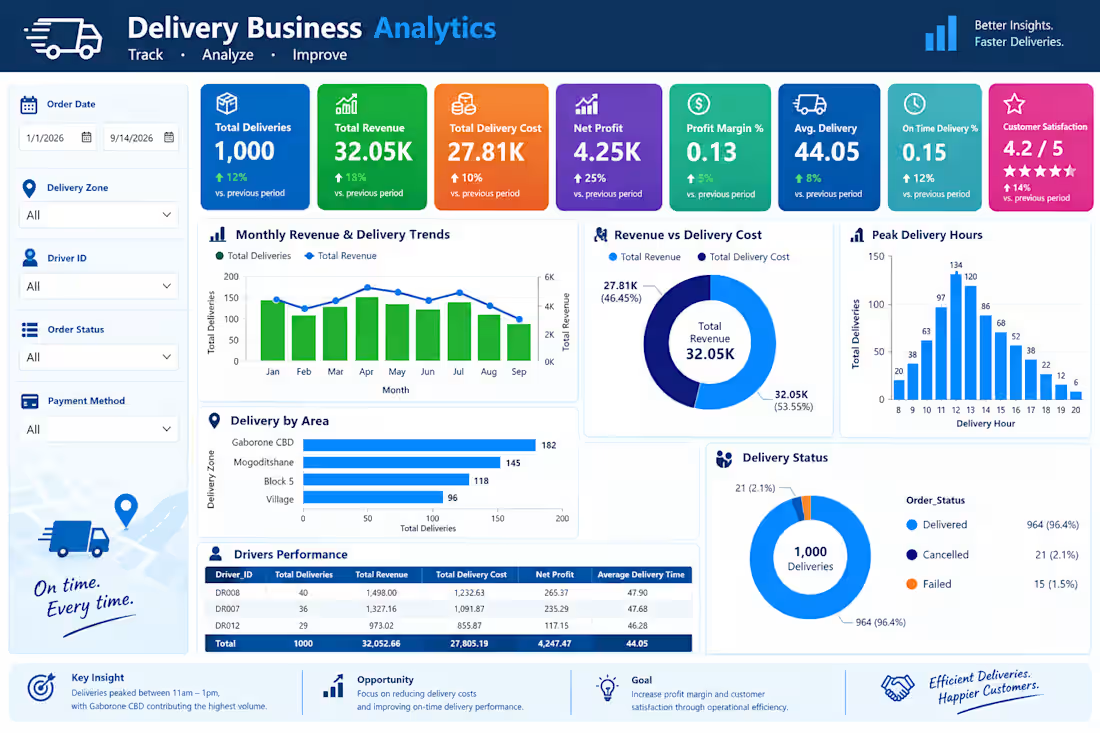
I recently developed an end-to-end delivery analytics system designed to track performance, pinpoint delivery bottlenecks, and optimize fleet distribution across local zones (including Gaborone CBD and Mogoditshane).
By translating raw logistics data into visual, actionable insights, the system successfully monitored:
💰 P32,050+ in total revenue generated across 1,000 orders
📈 A healthy 13% profit margin maintained through strict expense oversight
⚡ An exceptional 96.4% delivery success rate
⏱️ A tight 44-minute average fulfillment time—even during peak operational surges of 134+ hourly deliveries.
When your data is clear, scaling operations becomes predictable.
💼 Looking to optimize your operational workflows, build custom dashboards, or turn your business data into revenue? Let’s collaborate! Check out the full case study on my profile or send me a DM to talk about your project.
#DataVisualization (https://www.linkedin.com/search/results/all/?keywords=%23datavisualization&origin=HASH_TAG_FROM_FEED) #OperationsAnalytics (https://www.linkedin.com/search/results/all/?keywords=%23operationsanalytics&origin=HASH_TAG_FROM_FEED) #Logistics (https://www.linkedin.com/search/results/all/?keywords=%23logistics&origin=HASH_TAG_FROM_FEED) Management #BusinessIntelligence (https://www.linkedin.com/search/results/all/?keywords=%23businessintelligence&origin=HASH_TAG_FROM_FEED) #FreelanceAnalyst (https://www.linkedin.com/search/results/all/?keywords=%23freelanceanalyst&origin=HASH_TAG_FROM_FEED)
0
97
CSV Data Cleaning & Python Automation
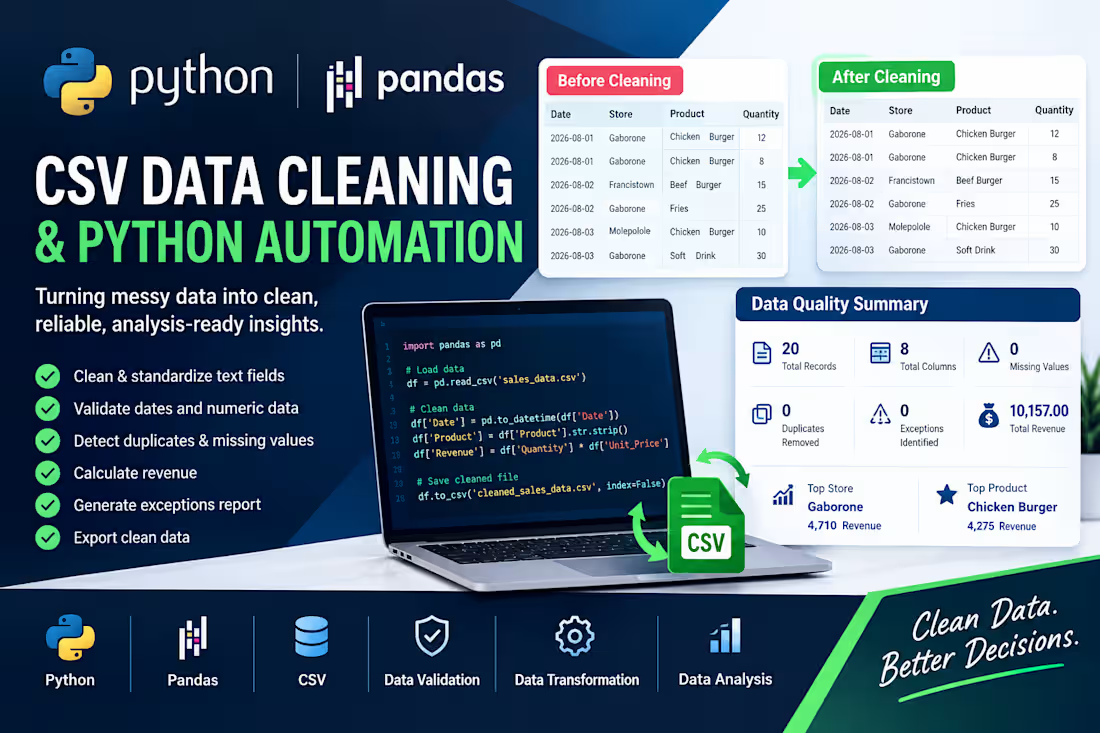
I developed a reusable Python/Pandas workflow to transform a messy sales CSV into a clean, analysis-ready dataset.
The workflow automatically:
Standardizes inconsistent whitespace in text fields
Validates and standardizes dates
Validates numeric fields such as quantity and unit price
Detects duplicate records
Identifies missing or invalid values
Calculates transaction revenue
Generates an exceptions report
Compares before/after record counts
Produces a reusable Python script and cleaned CSV output
Results
20 records processed with 0 missing values, 0 duplicate records removed, and 0 exceptions identified.
The cleaned dataset contained 8 columns, including a calculated Revenue field. Total revenue was 10,157, with an average transaction revenue of 507.85.
Tools
Python | Pandas | Jupyter Notebook | CSV
Deliverables
Cleaned CSV, exceptions report, reusable Python script, and data-quality summary.
0
94
📊 Turning Raw Retail Data Into Business Insights
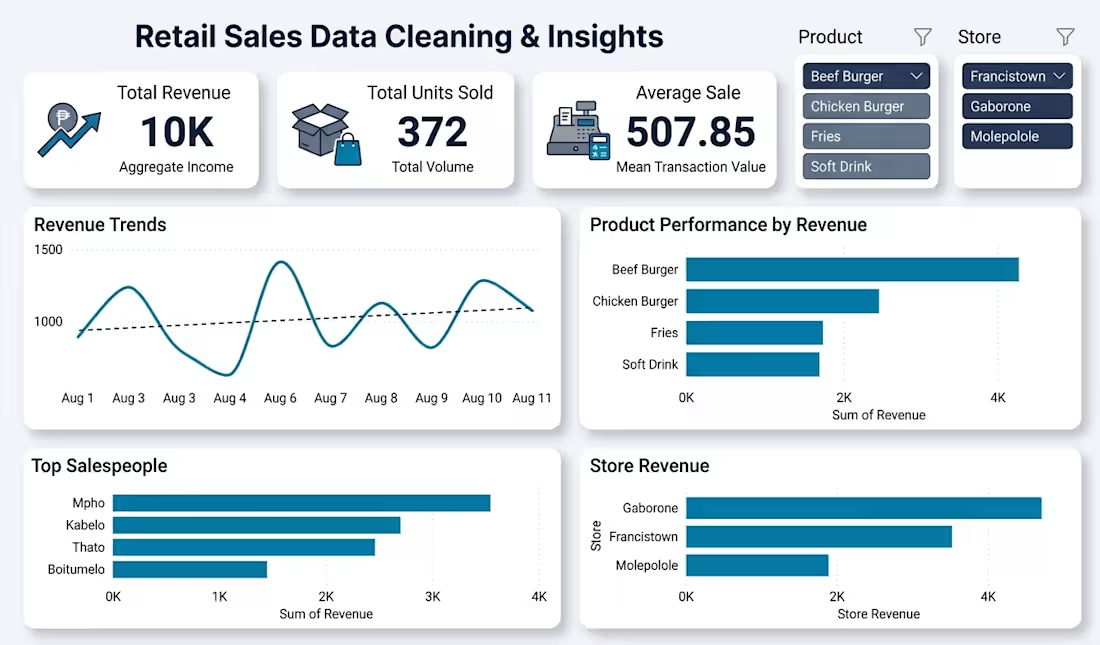
I recently worked on a retail sales dataset to demonstrate how raw business data can be transformed into useful insights.
My process included:
✅ Data cleaning and validation
✅ Revenue calculations
✅ Sales performance analysis
✅ Product and store analysis
✅ Excel/Power BI visualization
✅ Identifying actionable business insights
The analysis answers questions such as:
• Which store generates the most revenue?
• Which products drive sales?
• Which products sell the most units?
• Which salesperson performs best?
• How do sales change over time?
Tools: Excel | Power BI | Python/Pandas | SQL
Clean data is the foundation. Good analysis turns that data into decisions.
#DataAnalysis #DataCleaning #Excel #PowerBI #Python #SQL #DataAnalytics #Freelance
2
508
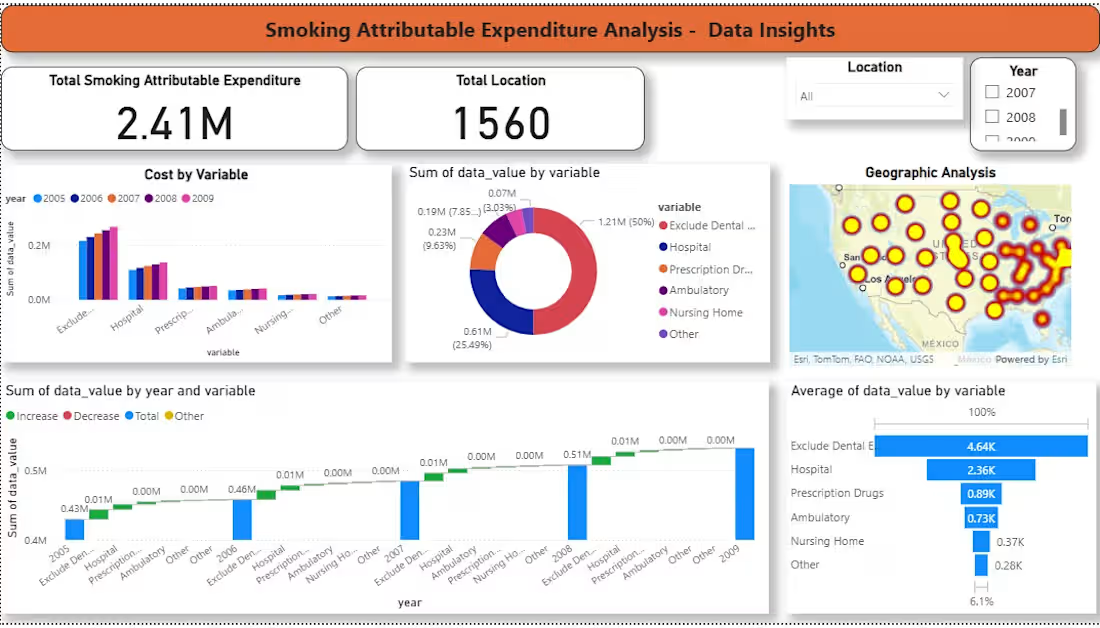
Data tells a powerful story.
Smoking-related healthcare expenditure reached 2.41M, with hospital services and major medical costs accounting for over 75% of the total burden.
The trend analysis shows consistent annual growth — a signal that reactive healthcare spending is increasing while preventive efforts may not be sufficient.
Analytics can transform public health decisions.
When we quantify the economic cost of lifestyle risk factors, we shift conversations from awareness to accountability.
0
144