The network for creativity
Join 1.25M professional creatives like you
Connect with clients, get discovered, and run your business 100% commission-free
Creatives on Contra have earned over $150M and we are just getting started
Back to feedPost

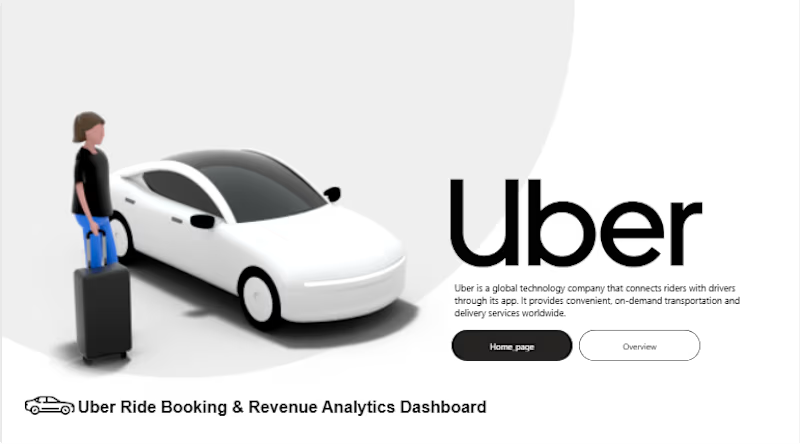
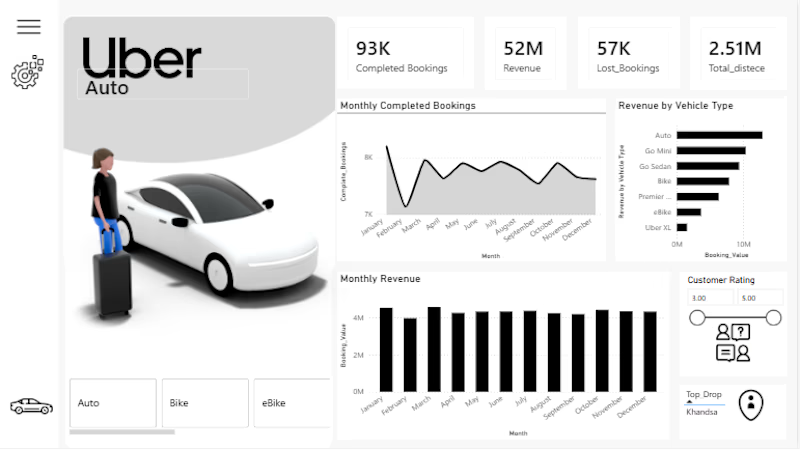
I developed an Uber Ride Booking & Revenue Analytics Dashboard in Power BI to analyze ride bookings, revenue, vehicle performance, customer ratings, cancellations, and trip distance.
The dashboard transforms raw ride-booking data into interactive insights, including 93K completed bookings, 52M revenue, 57K lost bookings, and 2.51M total distance. It also provides monthly booking and revenue trends, revenue by vehicle type, customer ratings, and top drop locations.
Tools: Power BI, Power Query, DAX, Excel
Focus: Data Cleaning, Data Analysis, KPI Reporting & Interactive Dashboard Development


The network for creativity
Join 1.25M professional creatives like you
Connect with clients, get discovered, and run your business 100% commission-free
Creatives on Contra have earned over $150M and we are just getting started

Challenges
View all


Related posts


clean


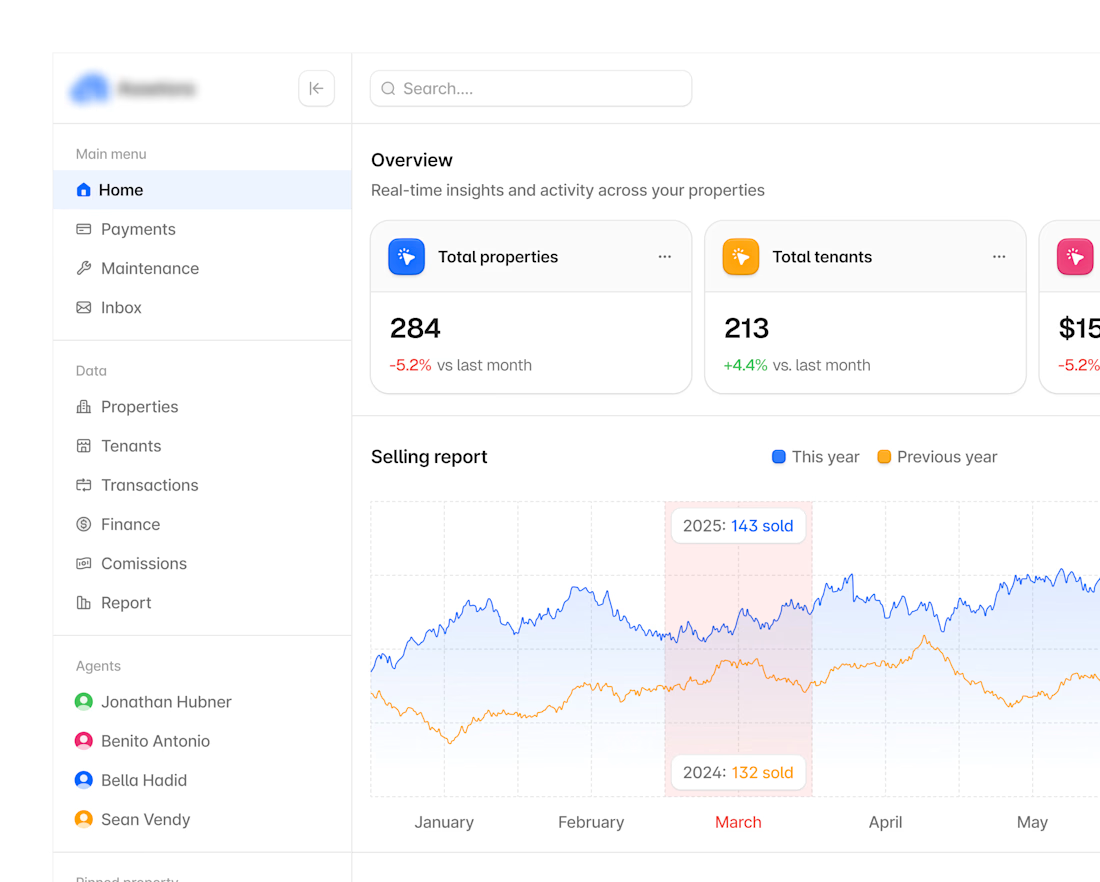
Hyper-modern real-estate dashboard.

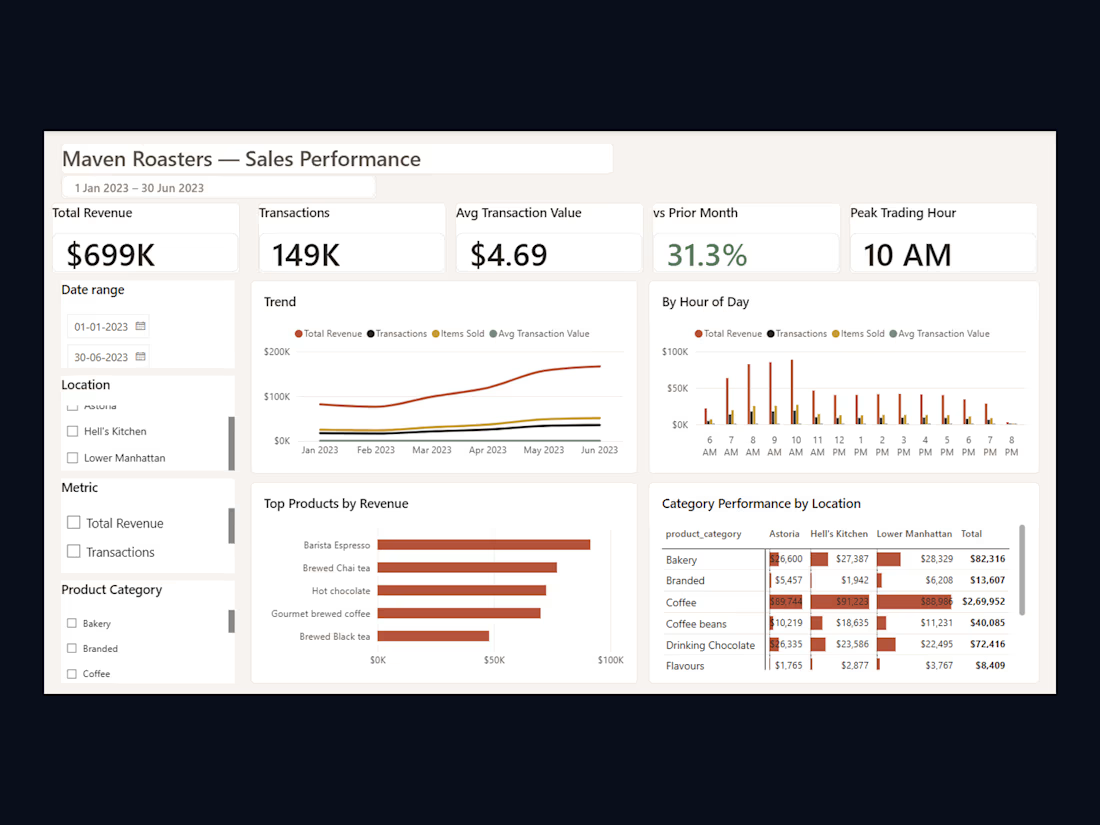
Maven Roasters — Sales Performance Dashboard
A Power BI report over 149,000 transaction-level records across three retail locations, built to answer what a shop owner actually asks: where revenue is trending, which hours carry the day, which products do the work.
The interesting part isn't the charts, it's the interaction. Most dashboards answer one question and then need an analyst for the follow-up. This one lets the viewer ask their own — a single slicer switches the trend and hourly charts between four metrics, right-clicking a product opens a detail page that renames itself to whatever was clicked, and hovering shows a miniature report rather than one number.
Underneath is a star schema with a marked date table, so month-over-month and year-to-date resolve correctly rather than approximately. Fifteen measures in a dedicated table, and the whole report styled through a custom theme JSON — nothing in it is a Power BI default.