The network for creativity
Join 1.25M professional creatives like you
Connect with clients, get discovered, and run your business 100% commission-free
Creatives on Contra have earned over $150M and we are just getting started
Back to feedPost


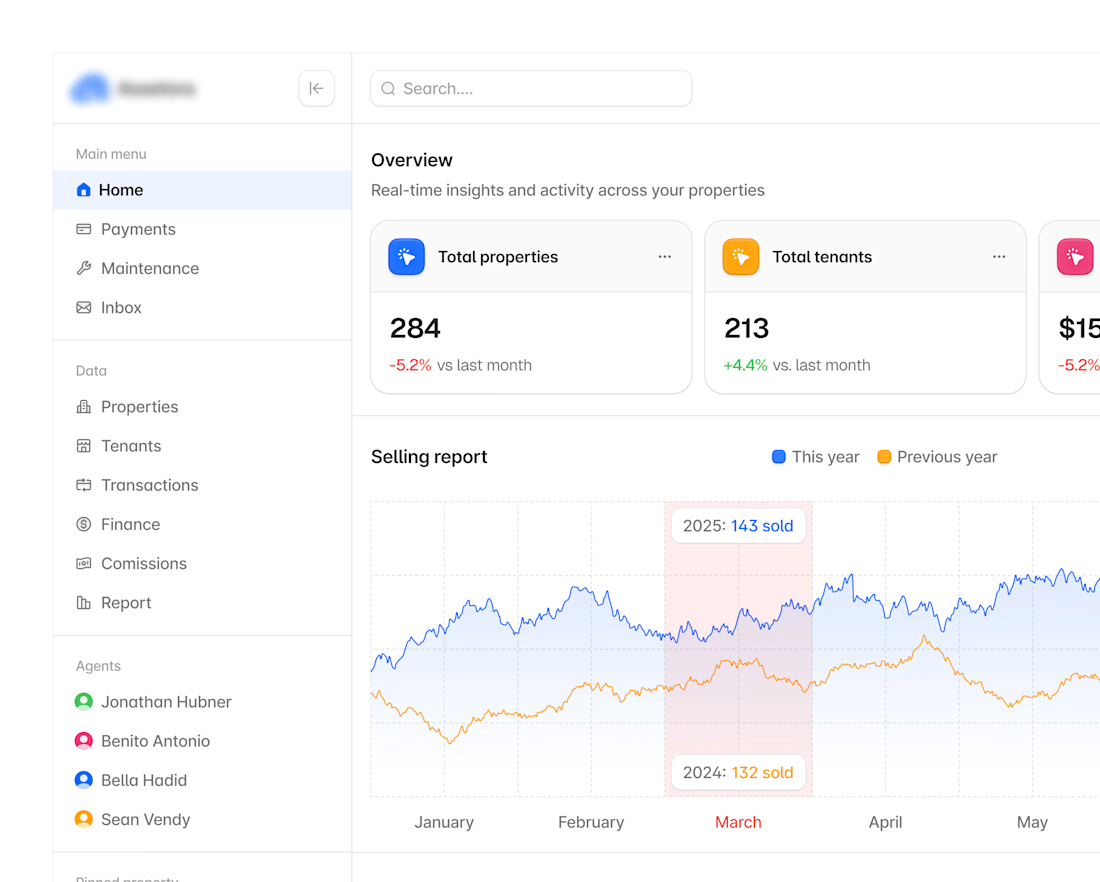
Hyper-modern real-estate dashboard.

This is very clean!!


great work, love the colors you selected!


looks great


The process behind making a dashboard design this clean is always a lot of intentionality, Dashboards most times involves complex blocks of informations . Amazing work🔥

The overlapping year-over-year chart with that shaded March comparison band is a nice touch, most dashboards just stack two flat lines and leave you to guess where they diverge.

Amazing job!!

Love the simplicity here, it gives the brand such a nice feel

Professional and impressive design work ! Good job

Good job

The selling report chart earns the "hyper-modern" label more than the color palette does. Comparing this year against last year right inside the same chart, instead of a separate KPI card, is the kind of detail agents actually use.
The network for creativity
Join 1.25M professional creatives like you
Connect with clients, get discovered, and run your business 100% commission-free
Creatives on Contra have earned over $150M and we are just getting started

Challenges
View all


Related posts


would actually use this lol. the customizable part is what runners care about
technical dashboard

Built a modern, professional website for a real estate builder, showcasing properties, highlighting projects, and helping attract potential buyers and generate business leads.


Great