

HR Employee Attrition Analysis — Power BI Dashboard
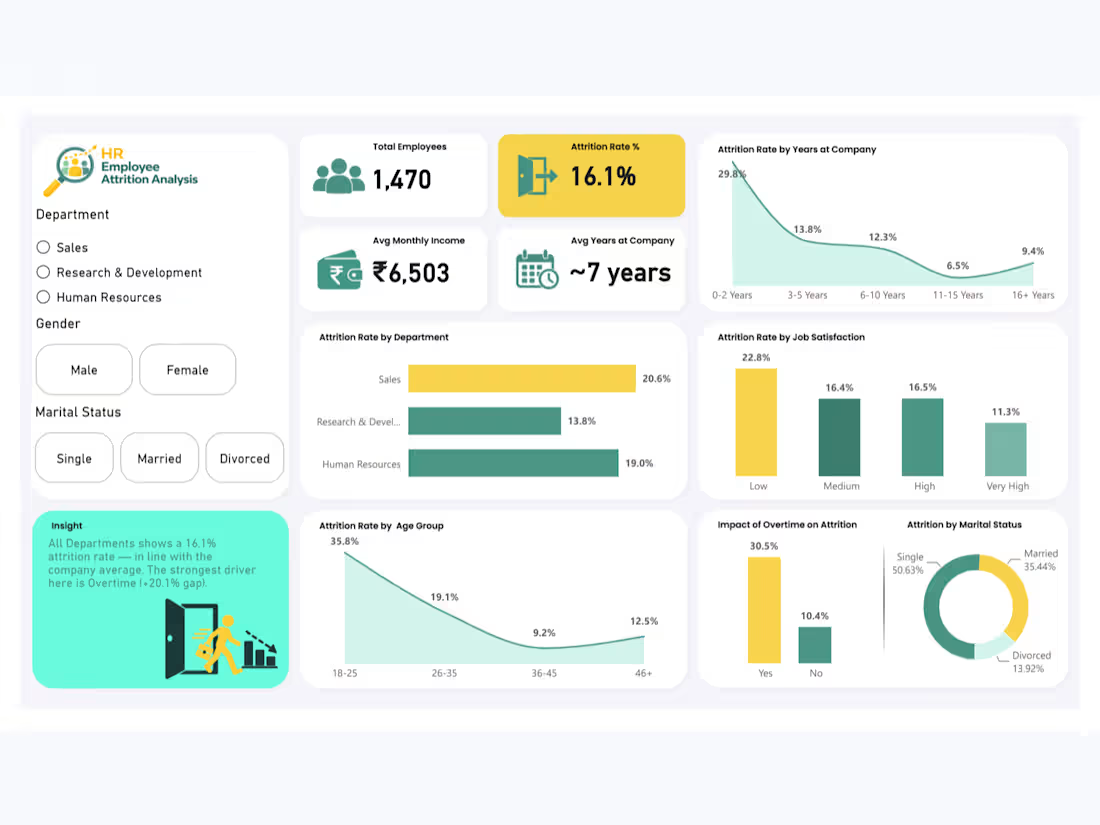
Built an interactive HR Employee Attrition Analysis Dashboard in Power BI using the publicly available IBM HR Analytics dataset from Kaggle (1,470 employees, 35 attributes).
This is a personal portfolio project. Dataset analysis, data cleaning, dashboard development, DAX measures, and visualizations were completed independently.
Key highlights:
Cleaned and transformed HR data using Power Query, including ordinal HR scales and custom Age and Tenure grouping logic
Developed DAX-driven KPIs for Total Employees, Attrition Rate, Average Monthly Income, and Average Years at Company
Analyzed employee attrition patterns across departments, age groups, years at company, job satisfaction, marital status, and overtime
Built a dynamic insight card that updates its message and risk color based on Department, Gender, and Marital Status filters using DAX and conditional formatting
Created two dedicated tooltip pages, Employee Segment Overview and Workplace Experience, providing contextual employee insights on hover
Developed interactive visuals to compare attrition rates by department, tenure, age group, job satisfaction, and overtime status
Identified key attrition patterns, including higher attrition among employees working overtime and differences across tenure and department segments
Designed a clean, recruiter-ready dashboard with a consistent teal, yellow, and white color palette
Tools used: Microsoft Power BI, Power Query, DAX, Data Modeling, Conditional Formatting, Interactive Dashboard Design, Report Tooltips
Data source: Public Kaggle dataset — IBM HR Analytics Employee Attrition & Performance
0
22
PhonePe Transaction Analysis Dashboard – Power BI
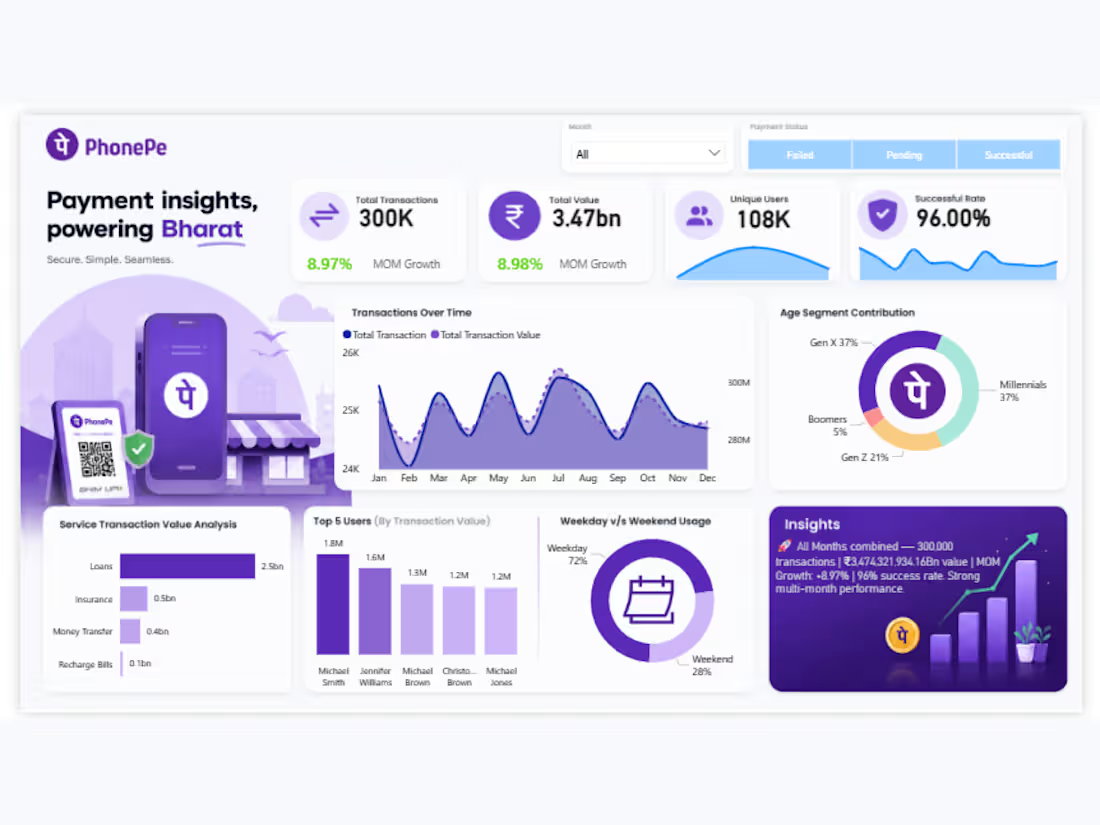
Built an interactive PhonePe Payment Insights Dashboard in Power BI using a publicly available Kaggle dataset to analyze 300K+ transactions, ₹3.47bn transaction value, and 108K unique users.
This is a personal portfolio project. The dataset was sourced from Kaggle, and the dashboard development, data analysis, visualizations, and insights were created independently.
Key highlights:
Designed interactive KPI cards for Total Transactions, Total Value, Unique Users, and Successful Rate (96%)
Analyzed monthly transaction trends to track transaction volume and payment value over time
Compared transaction performance across service types, including UPI ID, Self Account, Mobile Number, QR Code, and Bike Loan
Created service-wise transaction volume and transaction value visualizations to identify high-performing payment services
Developed customer segmentation visuals to analyze age groups, including Gen Z, Millennials, and Boomers
Added payment status filters for Failed, Pending, and Successful transactions
Designed tooltip visuals to provide detailed service-level insights, including transaction counts and total transaction value
Analyzed weekday vs. weekend usage patterns to understand customer transaction behavior
Developed a clean, interactive dashboard with a consistent purple color palette and user-friendly layout
Tools used: Microsoft Power BI, Power Query, DAX, Data Modeling, Data Visualization, Interactive Dashboard Design
Data source: Public Kaggle dataset
0
32
QuickCart Analytics — Quick Commerce Sales Dashboard (Power BI)
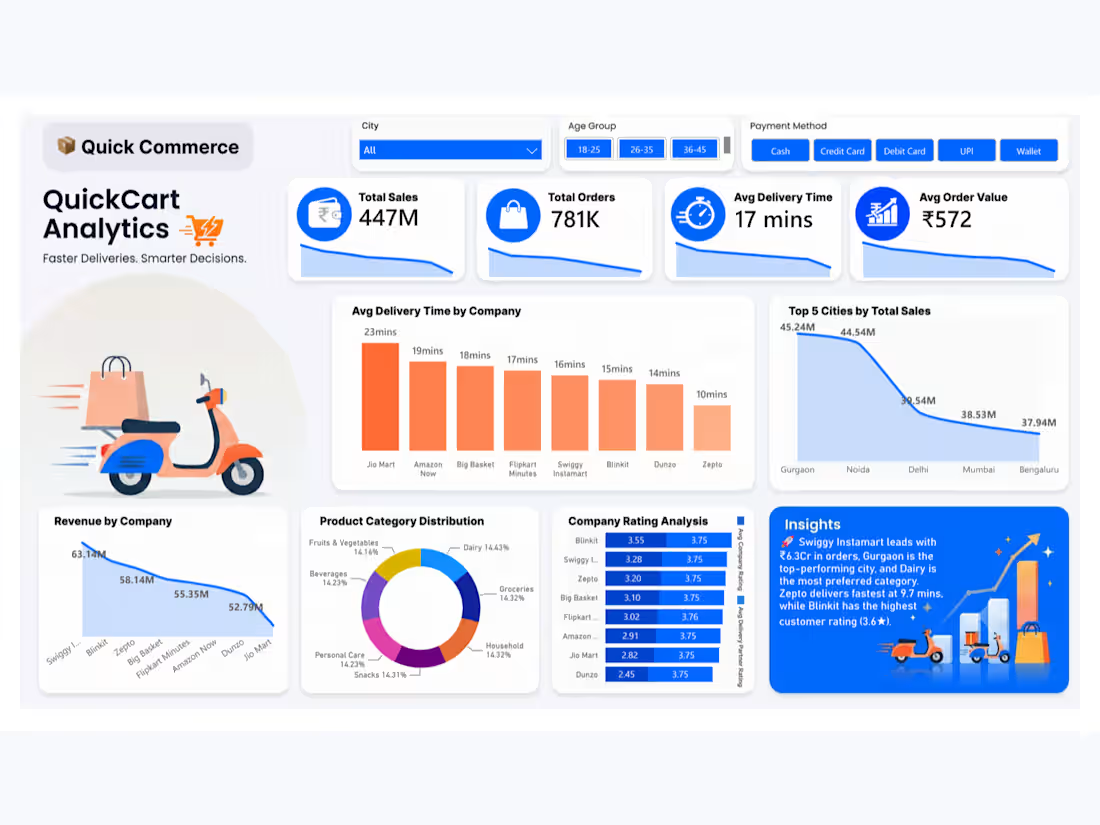
Built an end-to-end analytics dashboard in Power BI analyzing 780,000+ orders across 8 quick-commerce platforms (Blinkit, Zepto, Swiggy Instamart, Flipkart Minutes, and others).
Key highlights:
Designed a clean data model and cleaned 780K+ rows of transaction data
Built custom DAX measures including a fully dynamic AI-style insight generator that automatically identifies the top-performing company, city, category, fastest delivery partner, and highest-rated company — updating live with every filter change
Created KPI cards for Total Sales, Total Orders, Avg Delivery Time, and Average Order Value with trend sparklines
Visualized company-wise delivery performance, city-wise sales, product category distribution, and customer rating comparisons
Developed interactive slicers for City, Age Group, and Payment Method
Applied a custom gradient color theme and branded visual identity ("QuickCart Analytics") for a polished, recruiter-ready presentation
Tools used: Power BI, DAX, Data Modeling, Power Query
0
62
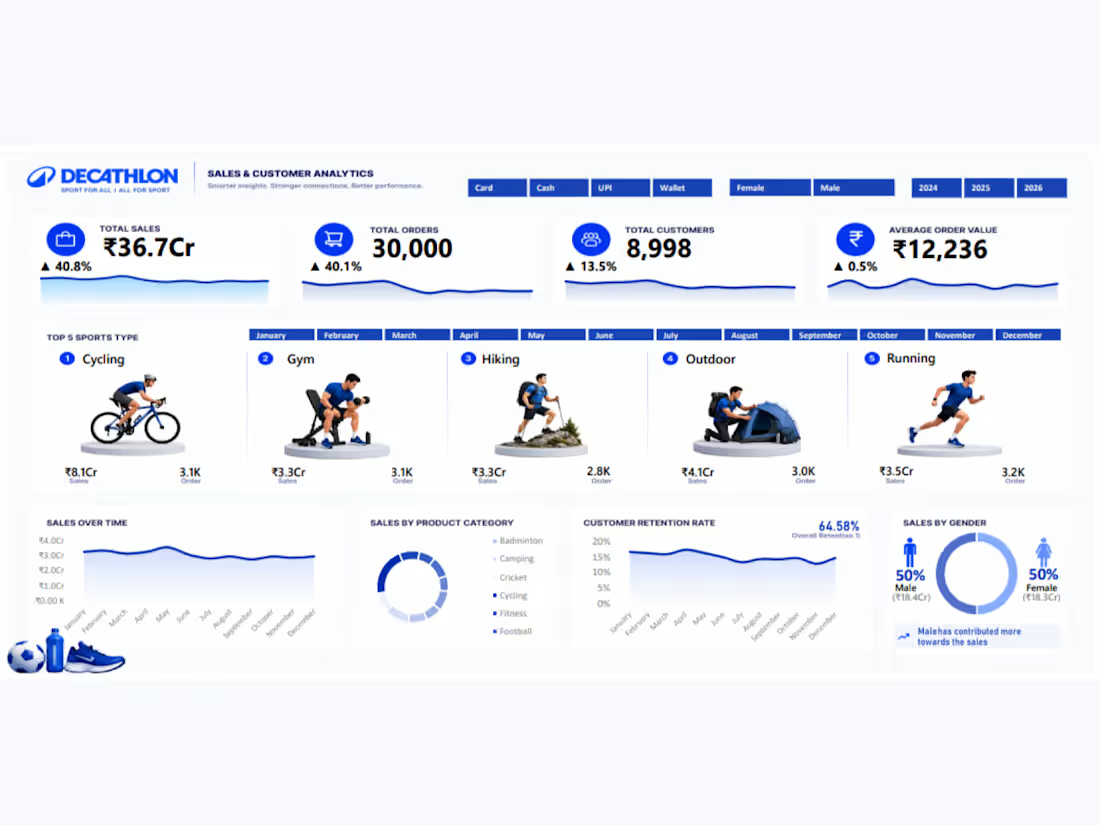
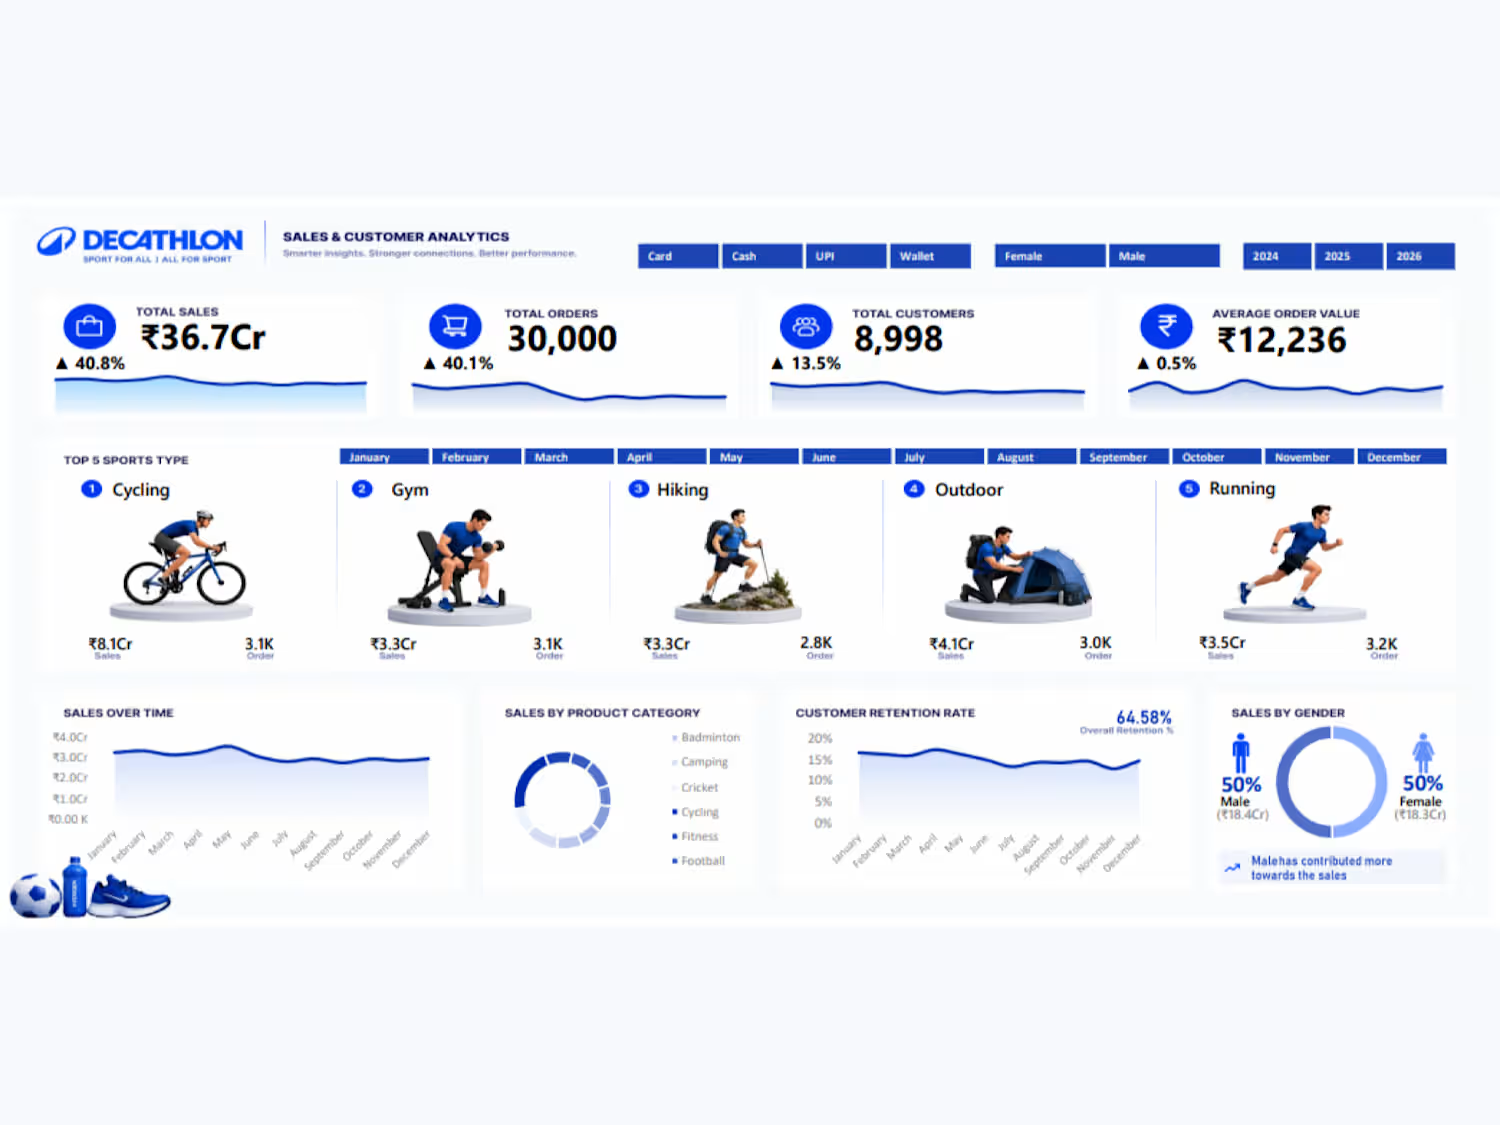
Decathlon Sales & Customer Analytics Dashboard (Excel)
Built an end-to-end sales and customer analytics dashboard in Excel using Power Pivot, Data Model, PivotTables, and advanced DAX measures on 29,000+ transaction records.
Key highlights:
Designed a Power Pivot data model with proper relationships between fact and dimension (calendar) tables
Built multiple interlinked PivotTables as the backend engine for all dashboard visuals and KPIs
Created dynamic, slicer-linked images using Camera Tool combined with dynamic Named Ranges (OFFSET/MATCH) to auto-update sport visuals based on filter selection
Built custom DAX time-intelligence measures (YoY growth, previous year comparisons) using FILTER-based patterns for accurate, slicer-safe calculations
Created dynamic KPI cards for Total Sales, Orders, Customers, and Average Order Value with trend sparklines
Developed interactive slicers for payment mode, gender, year, and month with consistent custom styling
Visualized top-performing sports categories, sales trends over time, product category distribution, and customer retention rate (64.58%)
Delivered a clean, recruiter-ready visual layout with a cohesive blue-white color palette
Tools used: Microsoft Excel, Power Pivot, PivotTables, Power Query, DAX, Data Modeling, Camera Tool
0
57