The network for creativity
Join 1.25M professional creatives like you
Connect with clients, get discovered, and run your business 100% commission-free
Creatives on Contra have earned over $150M and we are just getting started
Back to feedPost

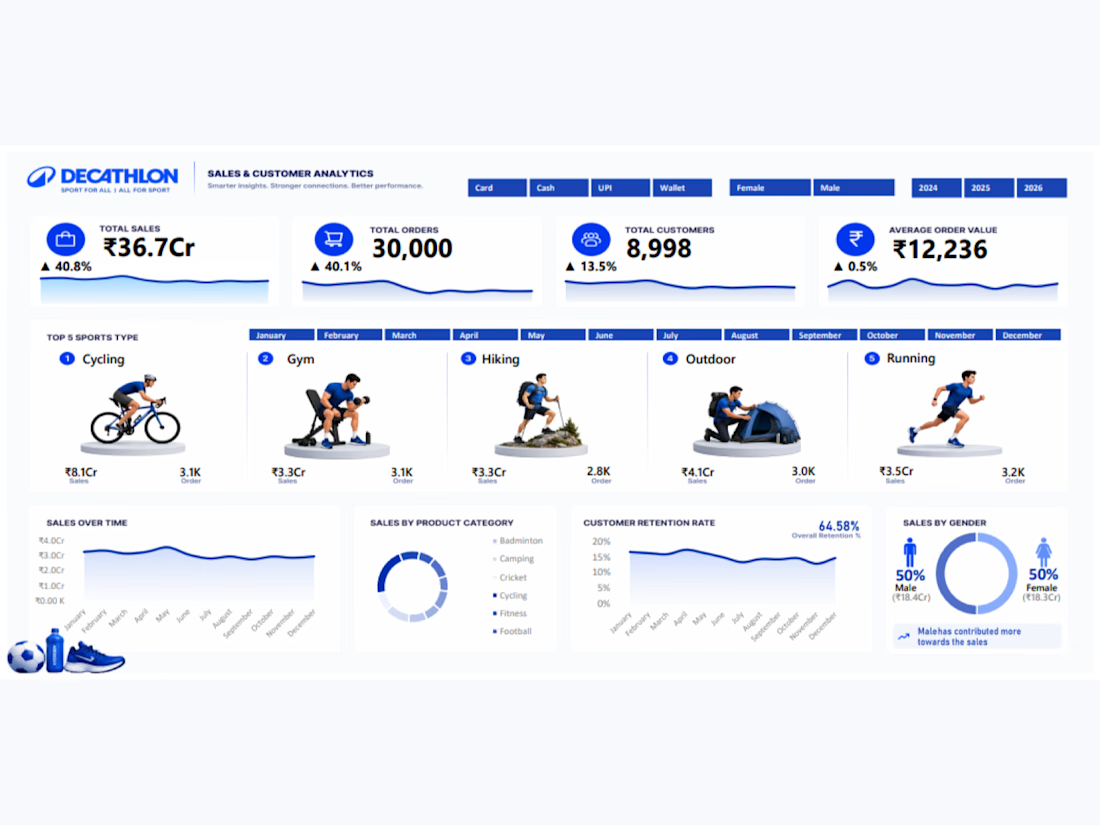
Decathlon Sales & Customer Analytics Dashboard (Excel)
Built an end-to-end sales and customer analytics dashboard in Excel using Power Pivot, Data Model, PivotTables, and advanced DAX measures on 29,000+ transaction records.
Key highlights:
Designed a Power Pivot data model with proper relationships between fact and dimension (calendar) tables
Built multiple interlinked PivotTables as the backend engine for all dashboard visuals and KPIs
Created dynamic, slicer-linked images using Camera Tool combined with dynamic Named Ranges (OFFSET/MATCH) to auto-update sport visuals based on filter selection
Built custom DAX time-intelligence measures (YoY growth, previous year comparisons) using FILTER-based patterns for accurate, slicer-safe calculations
Created dynamic KPI cards for Total Sales, Orders, Customers, and Average Order Value with trend sparklines
Developed interactive slicers for payment mode, gender, year, and month with consistent custom styling
Visualized top-performing sports categories, sales trends over time, product category distribution, and customer retention rate (64.58%)
Delivered a clean, recruiter-ready visual layout with a cohesive blue-white color palette
Tools used: Microsoft Excel, Power Pivot, PivotTables, Power Query, DAX, Data Modeling, Camera Tool


The network for creativity
Join 1.25M professional creatives like you
Connect with clients, get discovered, and run your business 100% commission-free
Creatives on Contra have earned over $150M and we are just getting started
Related posts

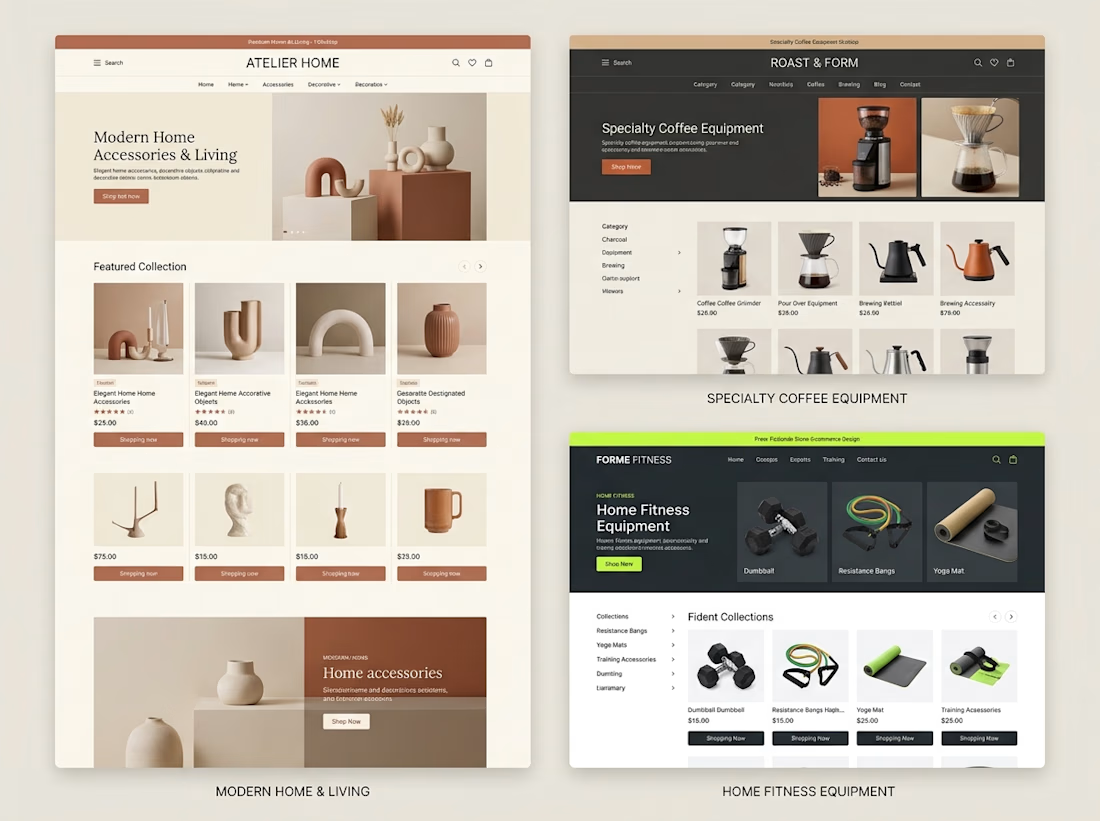
Different products need different shopping experiences.
When exploring Shopify store design, I like thinking about how the brand, product category, and customer journey should influence the final layout.
For example:
→ A home decor store needs strong visual presentation and an editorial feel.
→ A coffee equipment store needs clear categories and product information that helps customers compare options.
→ A fitness store needs organized collections and a straightforward path to the right equipment.
The goal isn't to use the same design for every business.
It's to understand what each store needs and build an experience around it.
These concepts explore three different directions, but they share one principle:
Good e-commerce design should make products easier to understand and easier to shop.
Which of these three store styles would you be most interested in exploring?



Great point. I’d pick the home decor one, editorial layouts really sell the vibe. 🔥

From static footer to motion.
It's crazy how adding motion can take something from OK to premium in an instant.


Good choice putting the motion in the footer. By the time someone scrolls that far they're already interested, so it rewards them without slowing down the first impression. For a health records app it also helps that the motion stays calm and doesn't feel flashy.

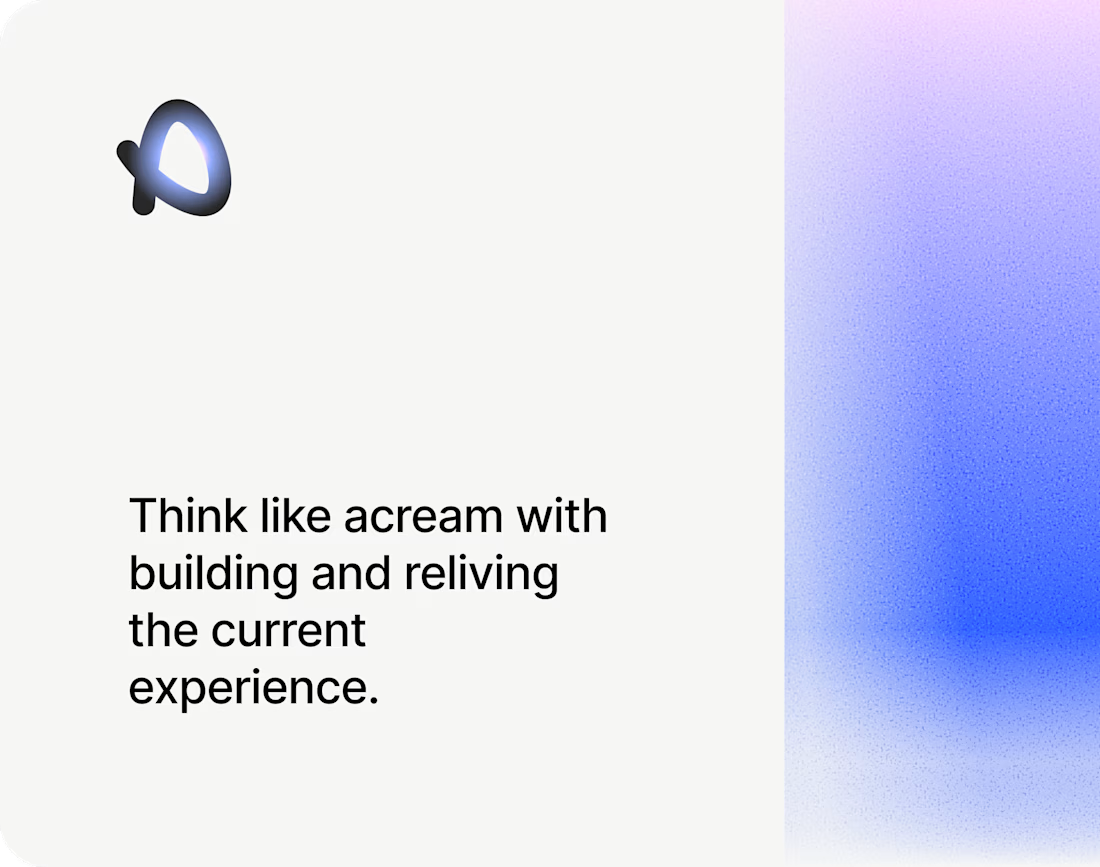

The soft blue and lilac gradient against the plain black type feels calm and a bit techy. Nice pacing in the motion too.