The network for creativity
Join 1.25M professional creatives like you
Connect with clients, get discovered, and run your business 100% commission-free
Creatives on Contra have earned over $150M and we are just getting started
Back to feedPost
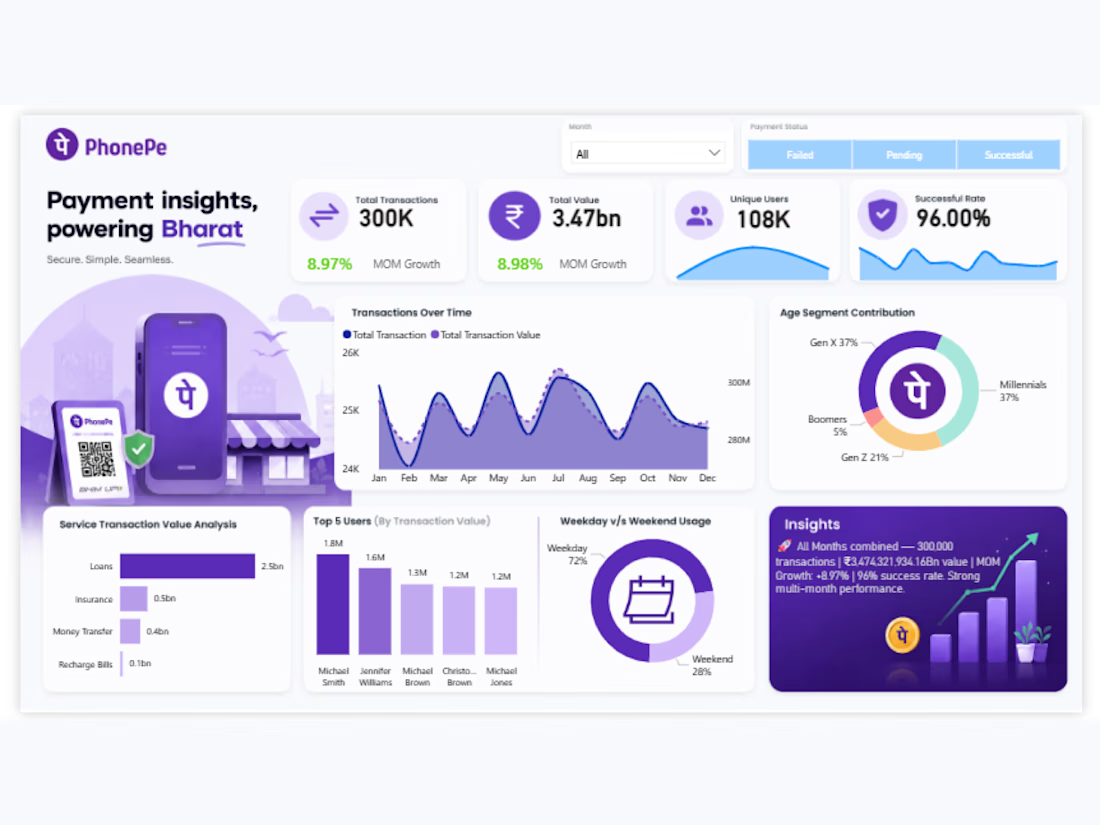
PhonePe Transaction Analysis Dashboard – Power BI
Built an interactive PhonePe Payment Insights Dashboard in Power BI using a publicly available Kaggle dataset to analyze 300K+ transactions, ₹3.47bn transaction value, and 108K unique users.
This is a personal portfolio project. The dataset was sourced from Kaggle, and the dashboard development, data analysis, visualizations, and insights were created independently.
Key highlights:
Designed interactive KPI cards for Total Transactions, Total Value, Unique Users, and Successful Rate (96%)
Analyzed monthly transaction trends to track transaction volume and payment value over time
Compared transaction performance across service types, including UPI ID, Self Account, Mobile Number, QR Code, and Bike Loan
Created service-wise transaction volume and transaction value visualizations to identify high-performing payment services
Developed customer segmentation visuals to analyze age groups, including Gen Z, Millennials, and Boomers
Added payment status filters for Failed, Pending, and Successful transactions
Designed tooltip visuals to provide detailed service-level insights, including transaction counts and total transaction value
Analyzed weekday vs. weekend usage patterns to understand customer transaction behavior
Developed a clean, interactive dashboard with a consistent purple color palette and user-friendly layout
Tools used: Microsoft Power BI, Power Query, DAX, Data Modeling, Data Visualization, Interactive Dashboard Design
Data source: Public Kaggle dataset


The network for creativity
Join 1.25M professional creatives like you
Connect with clients, get discovered, and run your business 100% commission-free
Creatives on Contra have earned over $150M and we are just getting started
Related posts




Awesome dude

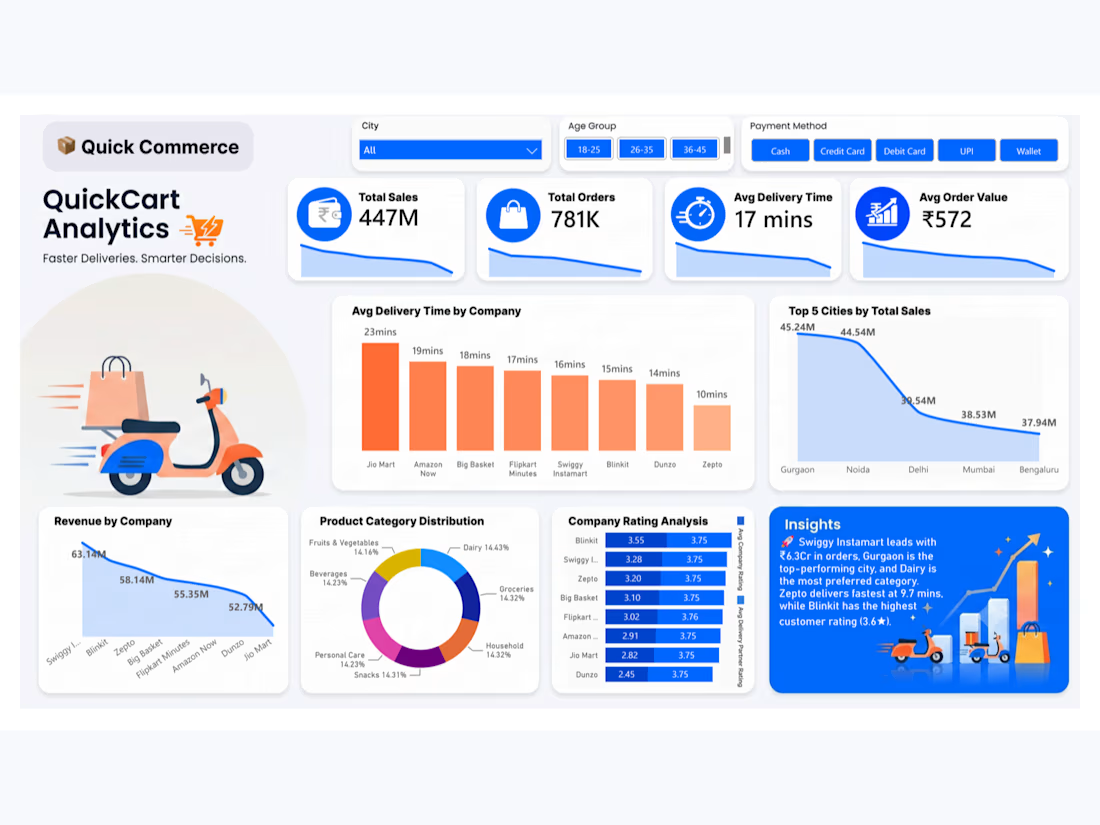
QuickCart Analytics — Quick Commerce Sales Dashboard (Power BI)
Built an end-to-end analytics dashboard in Power BI analyzing 780,000+ orders across 8 quick-commerce platforms (Blinkit, Zepto, Swiggy Instamart, Flipkart Minutes, and others).
Key highlights:
Designed a clean data model and cleaned 780K+ rows of transaction data
Built custom DAX measures including a fully dynamic AI-style insight generator that automatically identifies the top-performing company, city, category, fastest delivery partner, and highest-rated company — updating live with every filter change
Created KPI cards for Total Sales, Total Orders, Avg Delivery Time, and Average Order Value with trend sparklines
Visualized company-wise delivery performance, city-wise sales, product category distribution, and customer rating comparisons
Developed interactive slicers for City, Age Group, and Payment Method
Applied a custom gradient color theme and branded visual identity ("QuickCart Analytics") for a polished, recruiter-ready presentation
Tools used: Power BI, DAX, Data Modeling, Power Query

Solar data is usually charts and kW. Elysia turns it into your house, so you can tell at a glance what the roof is doing.
Branding, UI/UX, 3D and motion.
