Freelancers using pandas
Sign Up
Post a job
Sign Up
Log In
Filters
1
Projects
People
Lucinda Beeson
pro
United Kingdom
Data Engineering and Automation

$25k+
Earned
1x
Hired
26
Followers
Follow
Message
Data Engineering and Automation
1
Financial Analysis with NLP - Investigating soft influence
1
20
0
Automating Financial Analytics with Python
0
57
3
LLM Risk Assessment & Content Analysis for UK Tabloid
3
40
2
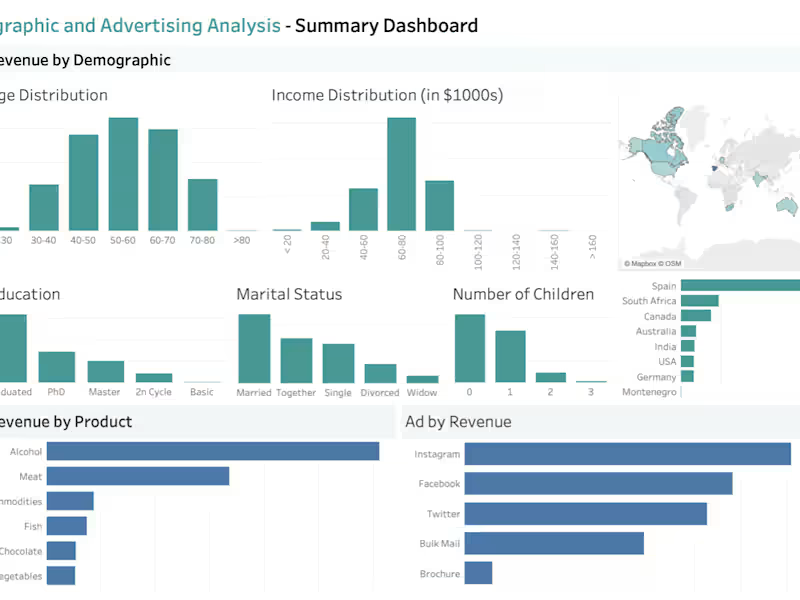
E-commerce Demographic Analytic
2
129
pandas
(2)
Follow
Message
Akshat Sharma
Houston, USA
Full Stack Developer | Project Manager | Executive Assistant
54
Followers
Follow
Message
Full Stack Developer | Project Manager | Executive Assistant
0
Full Stack Approach
0
182
1
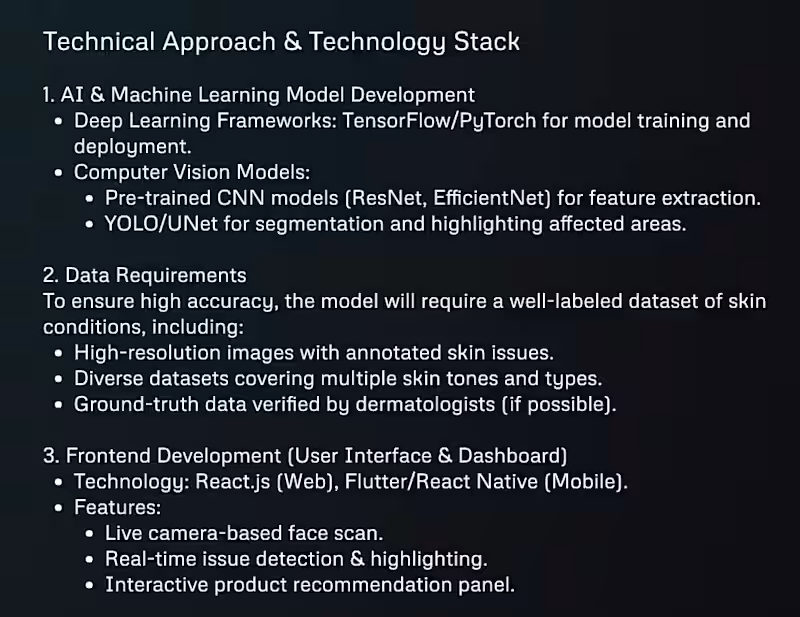
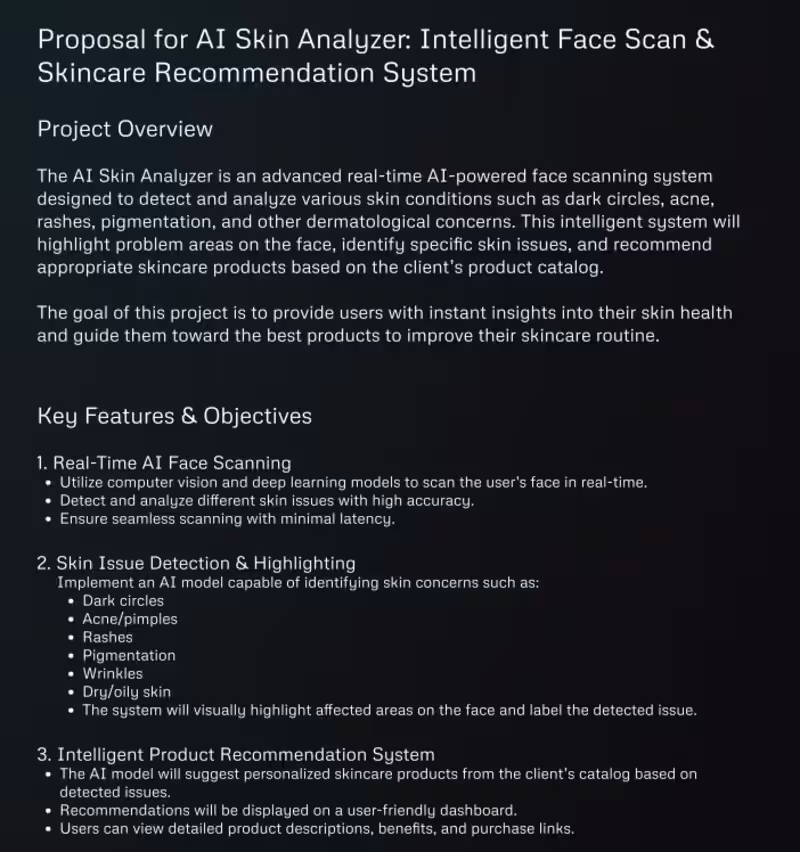
Working on AI Face calibration
1
147
1
AI & Full-Stack Developer | LLMs, Machine Learning
1
9
6
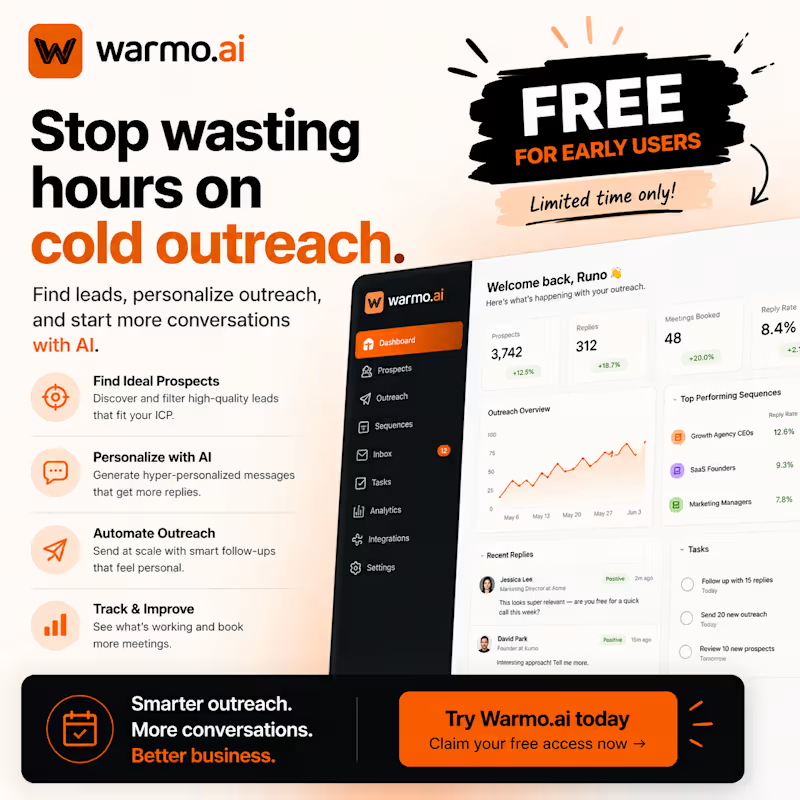
We’re entering a phase where AI products won’t win just because of the tech… They’ll win because of distribution. At Kokorick, we’re focused on one thing: Turning AI tools into growth engines. With Warmo, it’s not just about sending emails— it’s about building a system that learns: • Who converts • What messaging works • Which audiences actually respond The real moat isn’t the model. It’s the data you collect over time. That’s where things get interesting. #AIGrowth #StartupGrowth #GrowthStrategy #AISaaS #LeadGeneration #EmailOutreach #Automation #BuildInPublic
6
358
pandas
(3)
Follow
Message
Nathanael Mbale
pro
New Jersey, USA
Connecting code with intelligence

1x
Hired
27
Followers
Follow
Message
Connecting code with intelligence

1
Book Recommendation Engine with K-Nearest Neighbors
1
5
0
Healthcare Cost Prediction Using Neural Networks
0
2
1
SMS Spam Detection Using Neural Networks
1
2
0
Pomodor Study Planner
0
1
pandas
(3)
Follow
Message
kaze nesia
Surabaya, Indonesia
Full-Stack Data Specialist | Automation & Predictive
New to Contra
Follow
Message
Full-Stack Data Specialist | Automation & Predictive
0
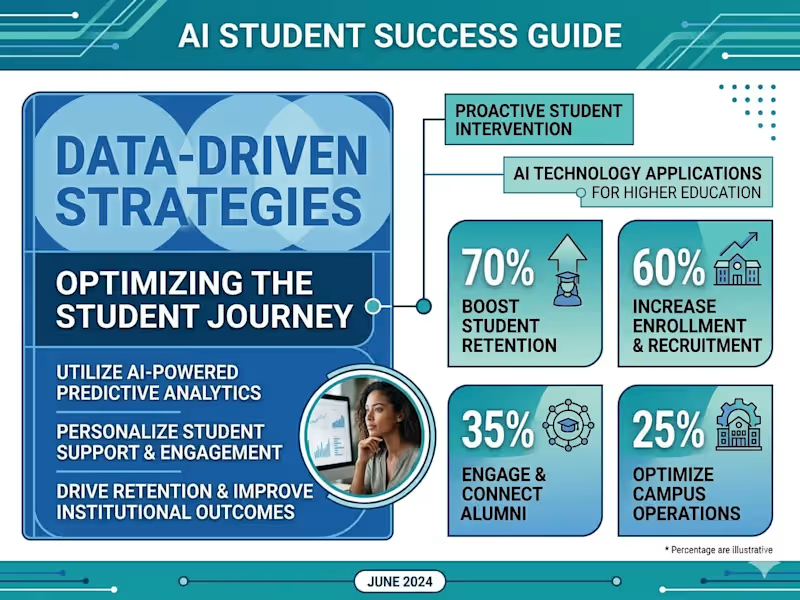
AI Student Success Intelligence Platform A twelve‑module analytics platform analyzed 50,000 learners across six countries to predict dropout, model engagement, and simulate interventions, finding that a composite Student Engagement Index (SEI)—built from Time Commitment, Academic Quality, Platform Activity, and Social Learning—is the strongest predictor of dropout (behavior beats demographics), an ensemble of XGBoost/LightGBM/CatBoost achieved 99.72% AUC and F1 = 0.9522, risk tiers were highly precise (Low Risk = 0.0% dropout; Critical Risk = 99.7%), multi‑dimensional “Full Interventions” produced the largest simulated risk reductions, and correcting a data‑leakage issue (attendance proxy) was essential to preserve model integrity.
0
218
0
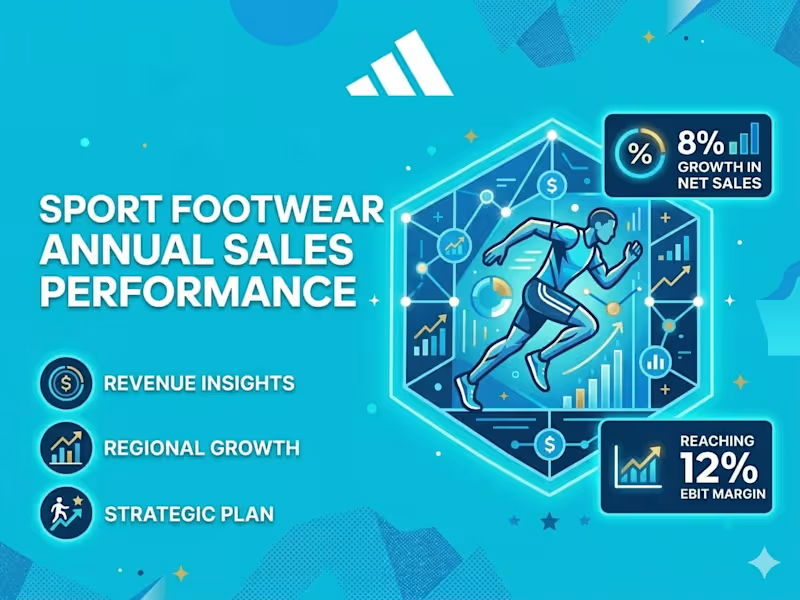
Global Retail Intelligence System: Product Success Prediction and Strategic Market Analysis A multi-stage ML pipeline analyzed 44,888 Adidas SKUs using XGBoost and Random Forest to predict product success, demand trajectories, and stockout risk, finding that subcategory is the dominant success driver (~6× more explanatory than price, discount, or geography), the Success Classifier reached 94.3% accuracy and the Stockout Risk model 0.99 ROC‑AUC, 42.5% of products carry markdowns with deep discounts (≥30%) often eroding margins, 323 high-performing SKUs are under‑distributed and present near‑term expansion opportunities, the Budget tier outperforms Premium/Luxury in conversion to high performers, and 653 SKUs were flagged as high demand with elevated stockout risk requiring urgent replenishment.
0
110
0
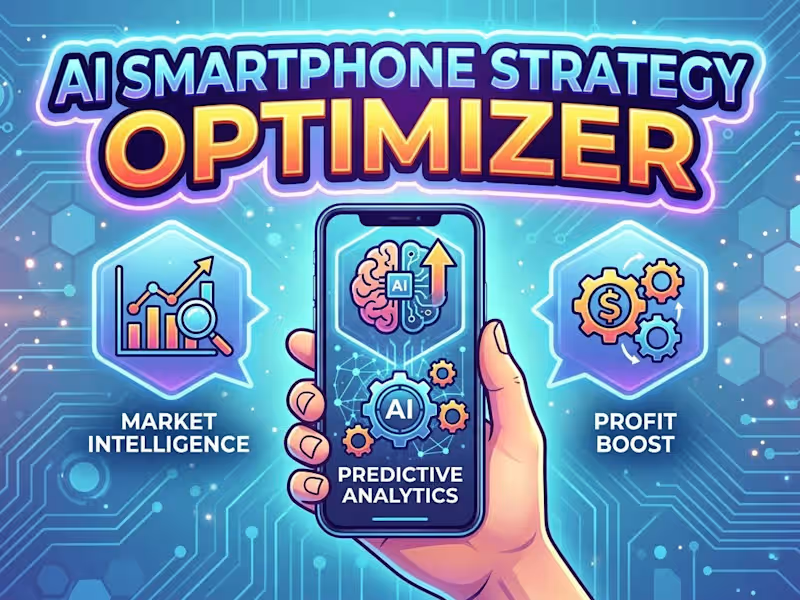
AI-Driven Global Smartphone Sales Strategy Optimizer An end-to-end ML project used four years of global sales data and 132,000+ simulations to optimize pricing across 52 countries, identifying the exact product, channel, and price to maximize profit. Key findings: the “Discount Myth”—discounting has almost no effect on volume but erodes margins; switching from blanket 20% discounts to AI‑optimized pricing yields a 15.1% revenue gain (about $73,993 preserved per simulation). The B2B channel is optimal in 90% of markets. The production XGBoost model achieves 99.73% accuracy, and ultra‑premium products (notably the Samsung Neo QLED 8K) consistently generate the highest revenue.
0
113
0
Implementing Dynamic Pricing for an E-commerce Platform Developed a dynamic pricing system to adjust prices in real-time based on market demand, competition, and customer behavior. Conducted market research, built pricing algorithms, and integrated them into the platform. Used data analysis to identify optimal pricing strategies and monitored their impact on key metrics. Findings: Increased Revenue: Experienced a 10% increase in revenue after implementing dynamic pricing. Improved Conversion Rate: Achieved a 5% increase in conversion rate by offering more competitive prices. Enhanced Competitive Advantage: Effectively positioned products and captured a larger market share. Identified Customer Segments: Gain insights into different customer segments and their willingness to pay.
0
137
pandas
(6)
Follow
Message
Guy G
Oregon, USA
40+ years programming experience including recent AI and ML.
6
Followers
Follow
Message
40+ years programming experience including recent AI and ML.
1
Each pulse consists of the changes needed to transform the visualization of one subject range to another. I could reduce the pulsing by using inter-prompt interpolation but at the time I made these last year the computational overhead was too expensive. If I had the time to do it now it would be quite a bit more efficient on an A100 for about the same cost including interpolation. This is a visualization of a couple months worth of "Physical Review Letters E" which is very much worth checking out.
1
29
22
Another fun project I started last year is called "CASI" for Cyclical Adversarial Step-wise Improvement. It leverages the fact that when LLMs engage in self-correcting loops they get better at a task. In this case we are pitting 2 models and 2 system prompts with distinctly different purposes against each other to improve a concept or idea. This is unlike self-play and more like other-play. I would love to include an intermittent training pass or LoRa construction between cycles to make the models focus more completely. CASI is still a work in progress so use at your own frustration. If you encounter any issues please log them with the github repo, you will be helping the entire world :) https://github.com/TheOneTrueGuy/CASI
22
134
20
This work was from late last year but I've been meaning to revisit it with an Agentic twist. Rebuilt to remain running in real time like a guardian I think it could be truly useful. It got open-sourced in this form after the client decided not to pursue it further. It is a simple tool for analyzing enormous blocks of emails for signs of fraud or deception. It won't take much for me to elevate the performance. https://github.com/TheOneTrueGuy/Fraud-Analysis-Tool and here is the video that was made for the associated Kaggle contest: https://www.youtube.com/watch?v=do9uPzW4AVk
20
120
0
AI-Powered Fraud Detection Platform for Kaggle Contest
0
2
pandas
(5)
Follow
Message
Rohit P.
India
Data Scientist, Python, ML Engineer & AI Developer
5.0
Rating
7
Followers
Follow
Message
Data Scientist, Python, ML Engineer & AI Developer
0
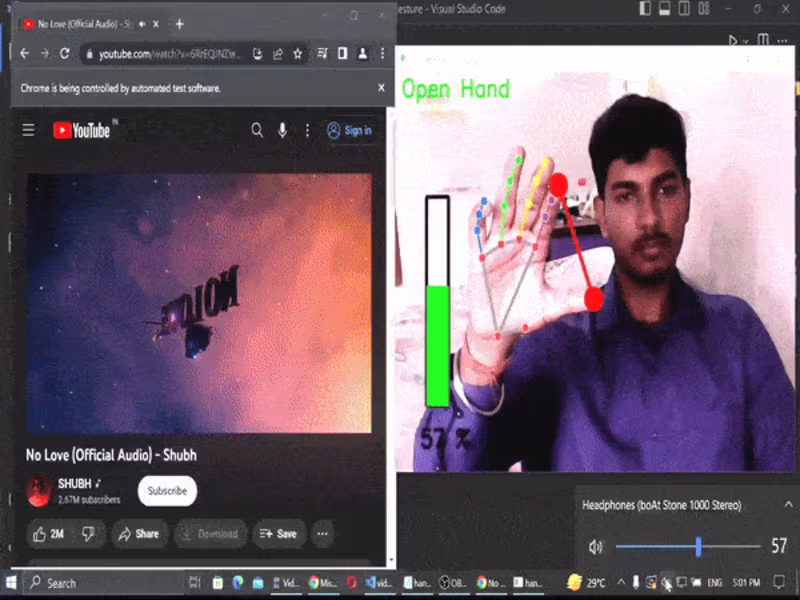
Hand Gesture Video Control | Computer Vision
0
39
1
Disease Prediction Model | Machine Learning
1
23
0
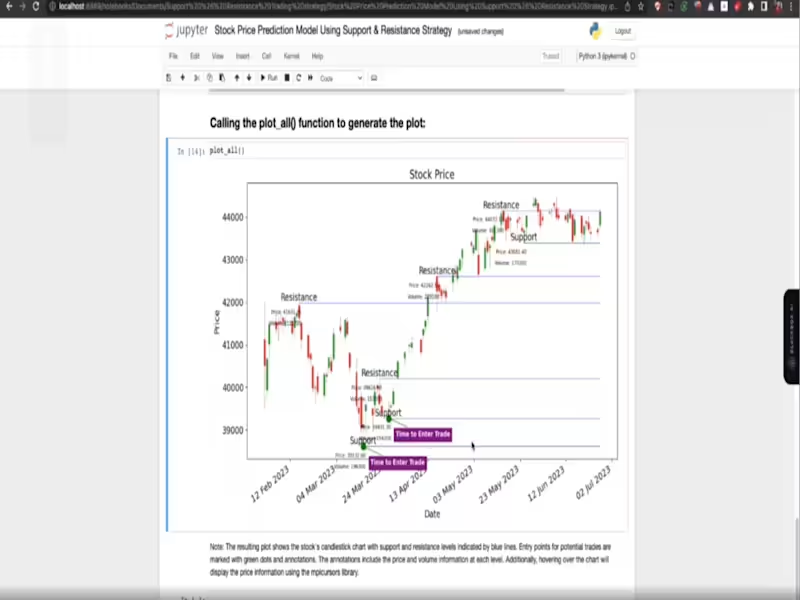
Stock Price Visualization and Entry-Points | Machine Learning
0
14
1
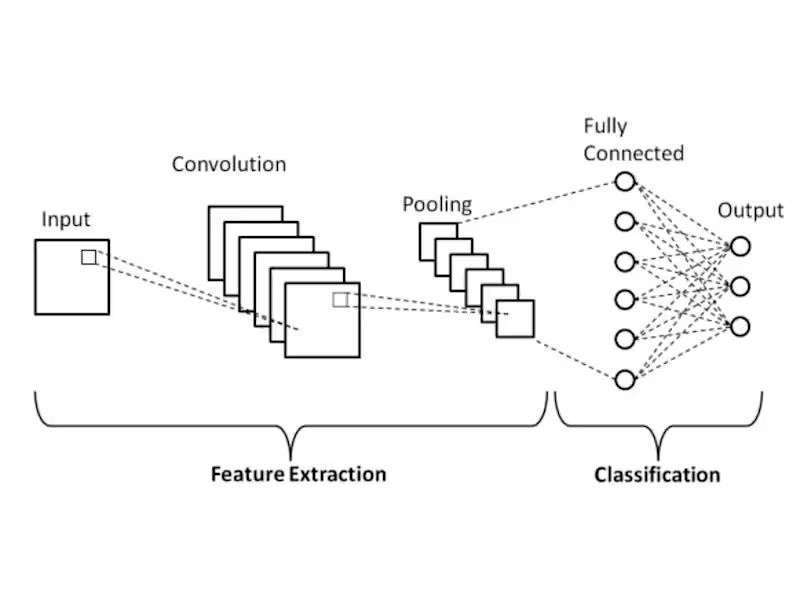
CIFAR-10 CNN Classifier | Deeplearning
1
9
pandas
(5)
Follow
Message
osama zaman
Karachi, Pakistan
i am a student of ai and ml
Follow
Message
i am a student of ai and ml
0
Titanic ML Project
0
1
0
Regression of Used Car Prices
0
0
0
Diabetes Prediction Challenge
0
1
0
oct-GAN Implementation
0
0
pandas
(6)
Follow
Message
Sarbjot Singh
Pimpri-Chinchwad, India
Power BI Expert | Turning Raw Data into Actionable Insights
New to Contra
Follow
Message
Power BI Expert | Turning Raw Data into Actionable Insights
1
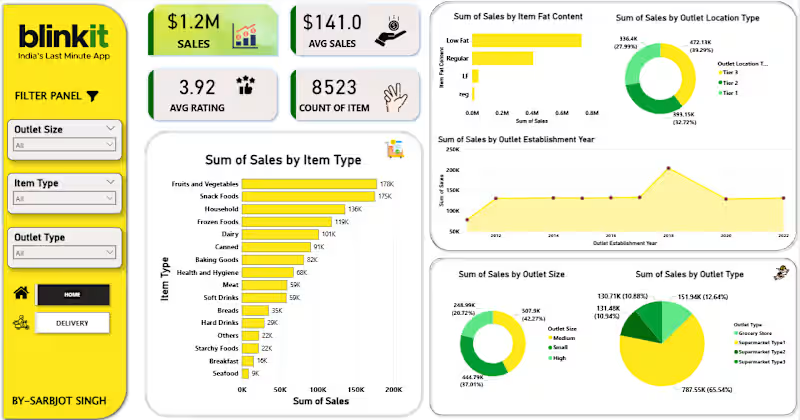
Data Analytics Project | BlinkIT Grocery Sales Analysis Excited to share my latest Data Analytics project ,where I analyzed BlinkIT Grocery Sales Data and delivery data to uncover meaningful business insights 📈 📊 What I worked on: Analyzed sales performance across product categories, outlet types, sizes, and locations Identified top-performing item categories and customer preferences Studied the impact of outlet size, establishment year, and visibility on sales Converted raw data into actionable insights and business recommendations 💡 Key Insights: Fruits & Vegetables, Snack Foods, and Frozen Foods drive maximum sales FOR FULL PROJECT VIST GIT HUB –( https://lnkd.in/d34sdAPz )
1
50
2
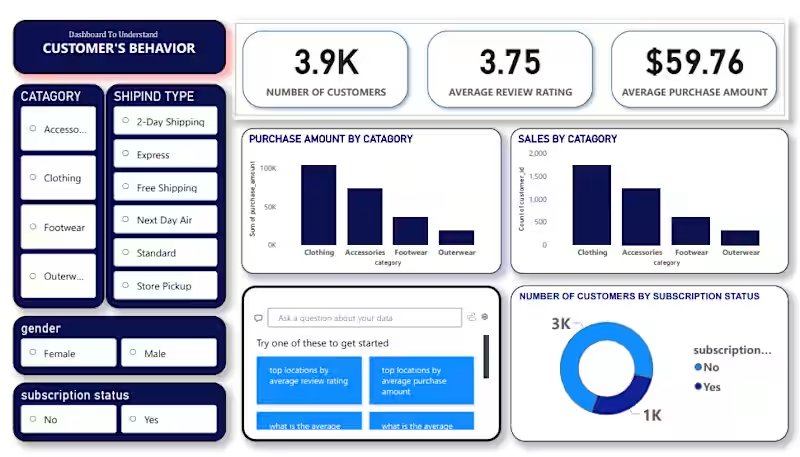
I’m excited to share my latest Data Analytics project where I analyzed Customer Shopping Behavior to uncover trends in sales, demographics, and purchasing habits.This project was a great exercise in building a complete data pipeline. The Tech Stack: Python (Pandas & NumPy): Used in Jupyter Notebooks for initial data exploration and statistical analysis. PostgreSQL: Utilized for rigorous data cleaning, querying, and structuring the dataset for analysis. Power BI: Built an interactive dashboard to visualize key metrics like seasonal trends, subscription impacts, and category performance. Project Highlights: ✅ Data Cleaning: Leveraged PostgreSQL and Pandas to handle missing values and standardize categorical data.
1
2
78
0
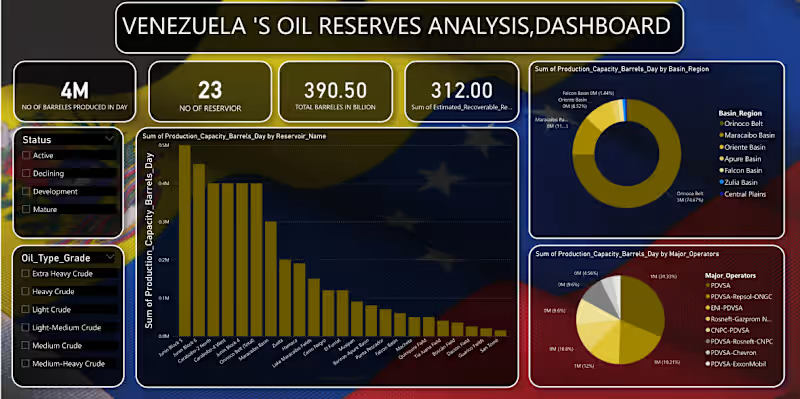
Venezuela’s Oil Reserves Analysis Dashboard 📊 I am excited to share my latest data analytics project focusing on the energy sector. Using a dataset covering 23 reservoirs, I designed a comprehensive dashboard to track production capacity and resource distribution in Venezuela. Key Features: ✅ Real-time Metrics: Tracking the 390.50 Billion total barrels in reserve. ✅ Granular Analysis: Production capacity breakdown by reservoir name and oil grade (Extra Heavy to Light). ✅ Stakeholder Mapping: Visualizing the production sum by major operators. Tools Used: [pandas(jupyter notebook)/mysql(for analysis and cleaning of data), Power BI / Excel(for building dashboard)] I’d love to hear your thoughts or feedback on the dashboard design! must visit my github for full project -( https://lnkd.in/dYKdZ8J2 )
0
54
1
Data Analytics Project | BlinkIT Grocery Sales Analysis Excited to share my latest Data Analytics project ,where I analyzed BlinkIT Grocery Sales Data and delivery data to uncover meaningful business insights 📈 📊 What I worked on: Analyzed sales performance across product categories, outlet types, sizes, and locations Identified top-performing item categories and customer preferences Studied the impact of outlet size, establishment year, and visibility on sales Converted raw data into actionable insights and business recommendations 💡 Key Insights: Fruits & Vegetables, Snack Foods, and Frozen Foods drive maximum sales Medium-sized outlets outperform others in overall revenue FOR FULL PROJECT VIST GIT HUB –( https://lnkd.in/d34sdAPz ) Feedback and suggestions are always welcome!
1
1
75
pandas
(3)
Follow
Message
Explore people