
kaze nesia
Full-Stack Data Specialist | Automation & Predictive
New to Contra
kaze is ready for their next project!

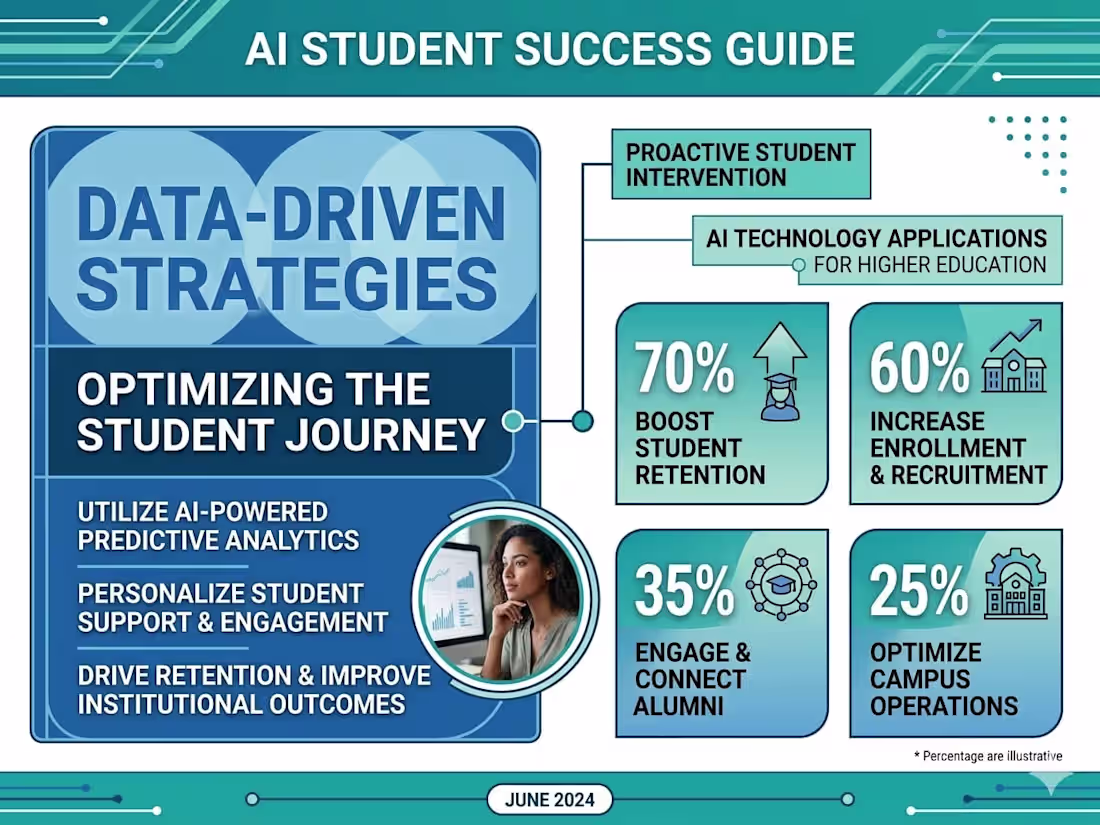
AI Student Success Intelligence Platform
A twelve‑module analytics platform analyzed 50,000 learners across six countries to predict dropout, model engagement, and simulate interventions, finding that a composite Student Engagement Index (SEI)—built from Time Commitment, Academic Quality, Platform Activity, and Social Learning—is the strongest predictor of dropout (behavior beats demographics), an ensemble of XGBoost/LightGBM/CatBoost achieved 99.72% AUC and F1 = 0.9522, risk tiers were highly precise (Low Risk = 0.0% dropout; Critical Risk = 99.7%), multi‑dimensional “Full Interventions” produced the largest simulated risk reductions, and correcting a data‑leakage issue (attendance proxy) was essential to preserve model integrity.
0
223

Crypto Market Intelligence & Alpha Signal Engine
An end-to-end Colab pipeline ingests market feeds, engineers 43 signals, detects regimes (KMeans/HMM/GMM), models 24‑hour alpha with a Random Forest (ROC‑AUC 0.7714), flags anomalies (Isolation Forest/Autoencoders), and backtests strategies; key findings: the SELL signal is highly precise (only 5.14% of SELLs rose next day), anomalies are often bullish (36.87% up vs 25.49% normal), price‑level context and regime probabilities drive predictions, and the model favors low‑volatility, defensive assets during downturns.
0
170

Global Retail Intelligence System: Product Success Prediction and Strategic Market Analysis
A multi-stage ML pipeline analyzed 44,888 Adidas SKUs using XGBoost and Random Forest to predict product success, demand trajectories, and stockout risk, finding that subcategory is the dominant success driver (~6× more explanatory than price, discount, or geography), the Success Classifier reached 94.3% accuracy and the Stockout Risk model 0.99 ROC‑AUC, 42.5% of products carry markdowns with deep discounts (≥30%) often eroding margins, 323 high-performing SKUs are under‑distributed and present near‑term expansion opportunities, the Budget tier outperforms Premium/Luxury in conversion to high performers, and 653 SKUs were flagged as high demand with elevated stockout risk requiring urgent replenishment.
0
117

AI-Driven Global Smartphone Sales Strategy Optimizer
An end-to-end ML project used four years of global sales data and 132,000+ simulations to optimize pricing across 52 countries, identifying the exact product, channel, and price to maximize profit. Key findings: the “Discount Myth”—discounting has almost no effect on volume but erodes margins; switching from blanket 20% discounts to AI‑optimized pricing yields a 15.1% revenue gain (about $73,993 preserved per simulation). The B2B channel is optimal in 90% of markets. The production XGBoost model achieves 99.73% accuracy, and ultra‑premium products (notably the Samsung Neo QLED 8K) consistently generate the highest revenue.
0
119

AI-Driven Sales Anomaly Detection: Executive Intelligence Report
A machine learning investigation analyzing 2.8 million retail transactions across seven countries. The project utilizes a multi-model ensemble—including Isolation Forest, Local Outlier Factor (LOF), One-Class SVM, and LSTM Autoencoders—to identify revenue leakage, pricing inconsistencies, and operational risks within global retail operations.
Critical Anomalies: Four high-priority transactions were unanimously flagged by all four independent machine learning models, representing the most significant and actionable risks identified in the dataset. Systemic Vulnerabilities: The analysis pinpointed specific weaknesses in discount authorization processes and pricing chain integrity, particularly within the UAE market.
0
107

Implementing Dynamic Pricing for an E-commerce Platform
Developed a dynamic pricing system to adjust prices in real-time based on market demand, competition, and customer behavior. Conducted market research, built pricing algorithms, and integrated them into the platform. Used data analysis to identify optimal pricing strategies and monitored their impact on key metrics.
Findings:
Increased Revenue: Experienced a 10% increase in revenue after implementing dynamic pricing.
Improved Conversion Rate: Achieved a 5% increase in conversion rate by offering more competitive prices.
Enhanced Competitive Advantage: Effectively positioned products and captured a larger market share.
Identified Customer Segments: Gain insights into different customer segments and their willingness to pay.
0
140
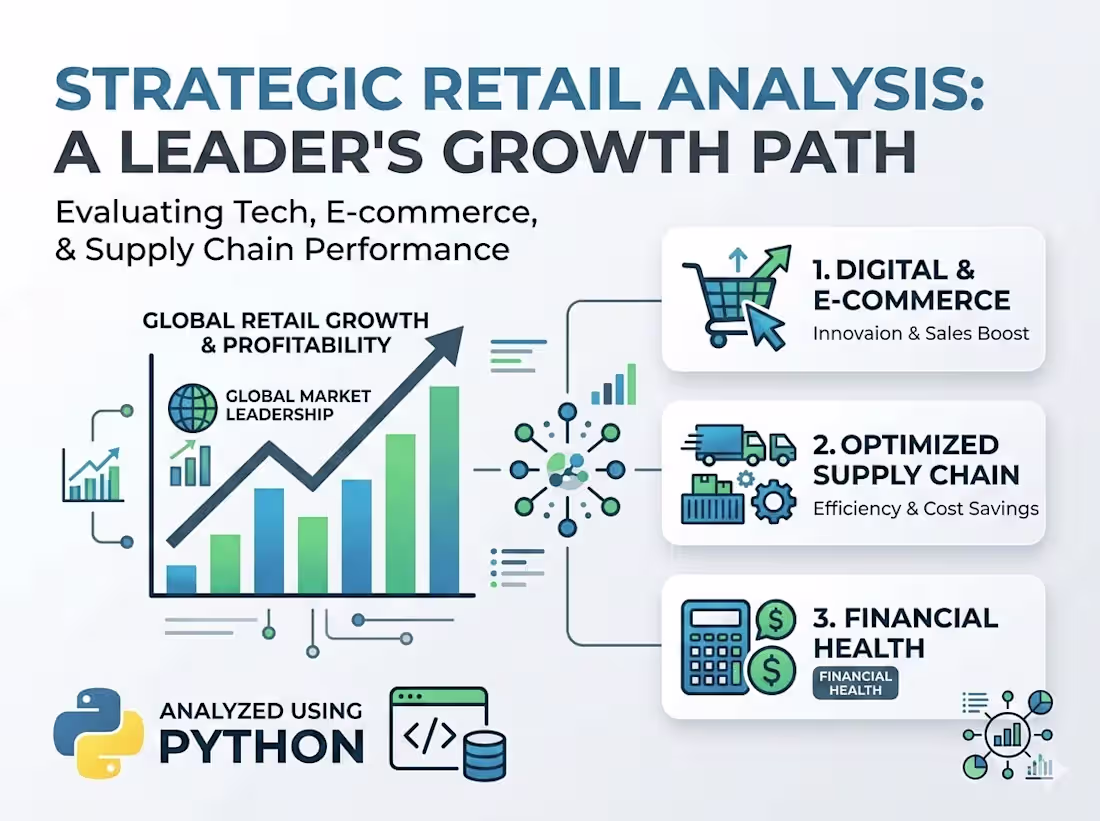
This project is an in-depth Strategic & Growth Analysis of retail business performance as a global market leader. The main focus is to evaluate how digital technology integration, e-commerce innovation, and supply chain optimization contribute to the company's financial health amid a competitive market dynamic.
Key Insights :
Solid Financial Performance: Successfully recorded significant revenue growth and overall profitability improvement. Global Market Dominance: Strengthened international expansion strategies and effective customer loyalty programs to maintain consumer retention. Supply Chain Efficiency: Implementation of the latest technology to accelerate the distribution process from warehouse to consumer (last-mile delivery).
2
1
271
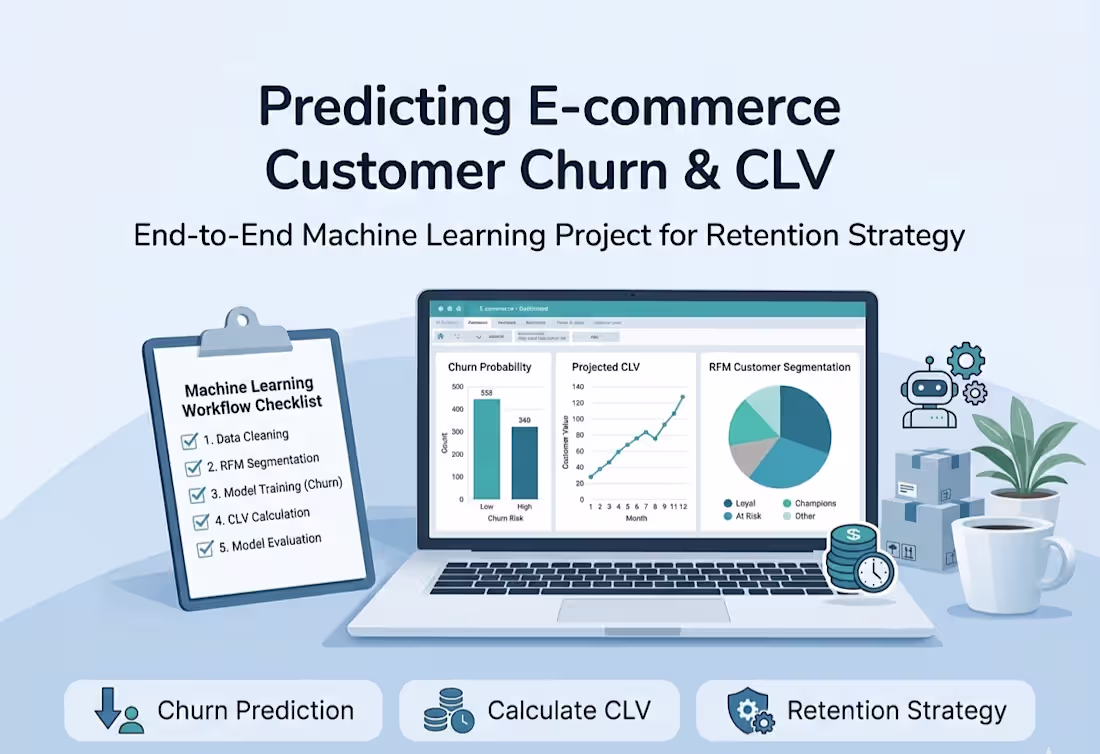
This project is an end-to-end machine learning analysis designed to predict churn (customer attrition) and calculate Customer Lifetime Value (CLV) on an e-commerce platform. Using a dataset containing 5,630 customers, this project integrates a data pipeline ranging from cleaning and RFM segmentation to predictive modeling to optimize customer retention strategies.
Key Findings :
High Model Performance: The optimized LightGBM algorithm achieved a ROC-AUC score of 0.9994.
Cost Efficiency: The model successfully achieved 0 False Negatives (no churners missed) at the optimized cost threshold.
Financial Impact: Retention strategy simulations show a potential campaign ROI of 1,007.5% with total net profits reaching 170,514.
0
247