Projects using Tableau
Projects using Tableau
Sign Up
Post a job
Sign Up
Log In
Filters
1
Projects
People
Message
2
Tasha Gideon
3X Increase in Valuation <12 months
2
57
Message
3
Rostyslav Fesyk
Piñata Farms App
3
20
Message
1
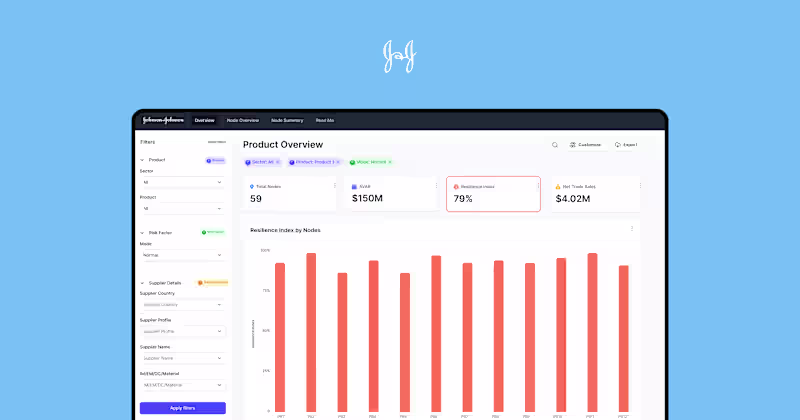
Alyssa Durante
Supply Chain Dashboard Usability Overhaul for Johnson & Johnson
1
35
Message
5
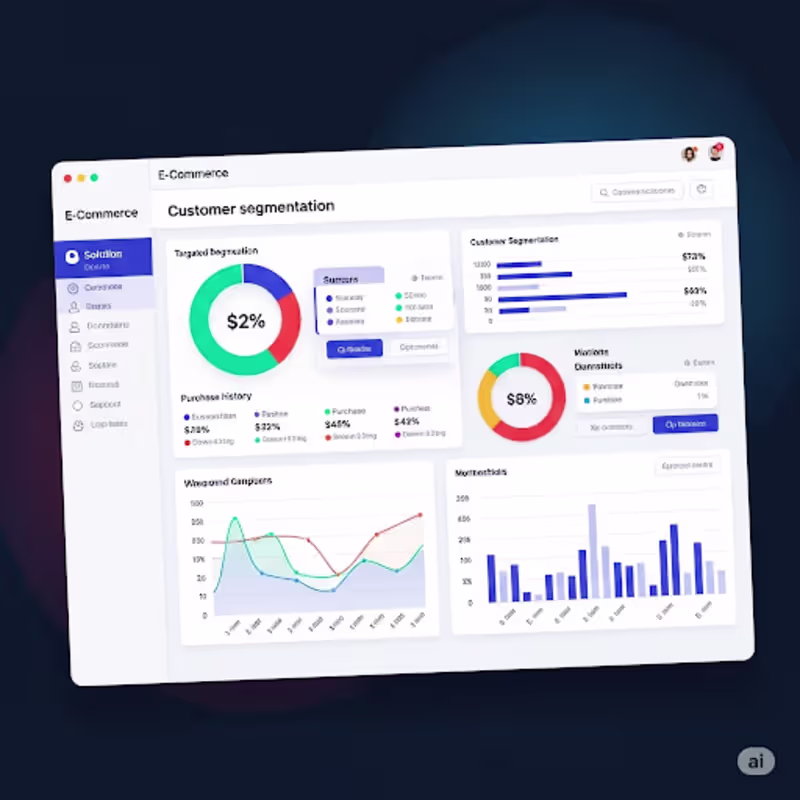
Mohamed MSALEK
E-commerce Customer Behavior Analysis & Segmentation
5
164
Message
3
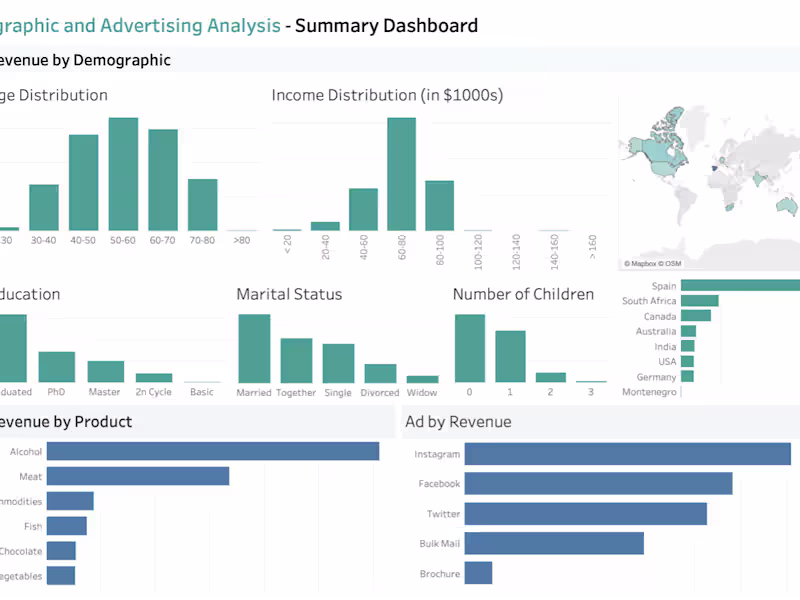
Lucinda Beeson
pro
E-commerce Demographic Analytic
3
159
Message
0
Charles
UX Design for AERENA Analytics Module
0
13
Message
0
Roberto Espinoza
Tableau Viz
0
5
Message
0
Rob Drlich
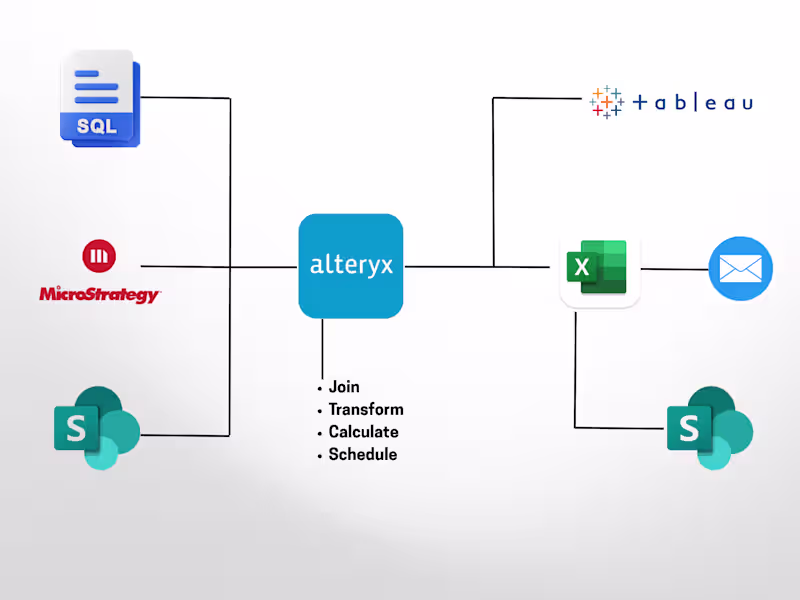
Fortune 500 Data Workflow Automation
0
15
Message
0
Uttam Kumaran
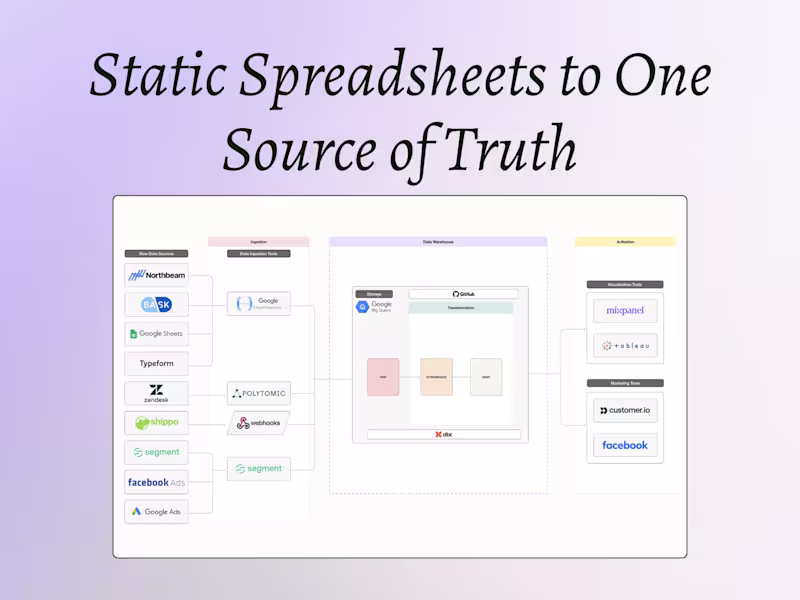
From Brittle Spreadsheets to Real-Time Clarity
0
20
Message
0
James Moy
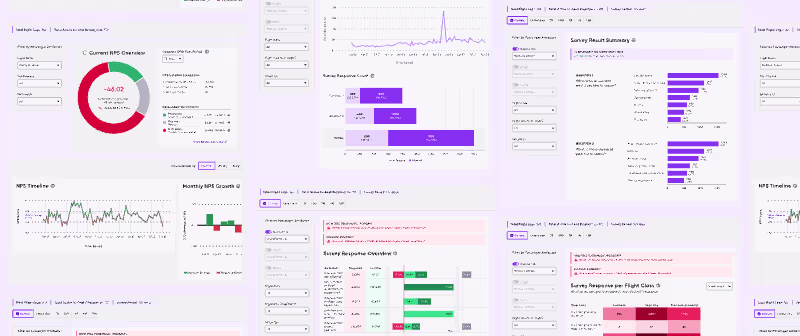
Marketing Campaign Analytics and Insight Development
0
7
Message
1
Sarah Yeboah Manu
Medical Health Insurance Cost Prediction
1
6
Message
0
Darren Pierson
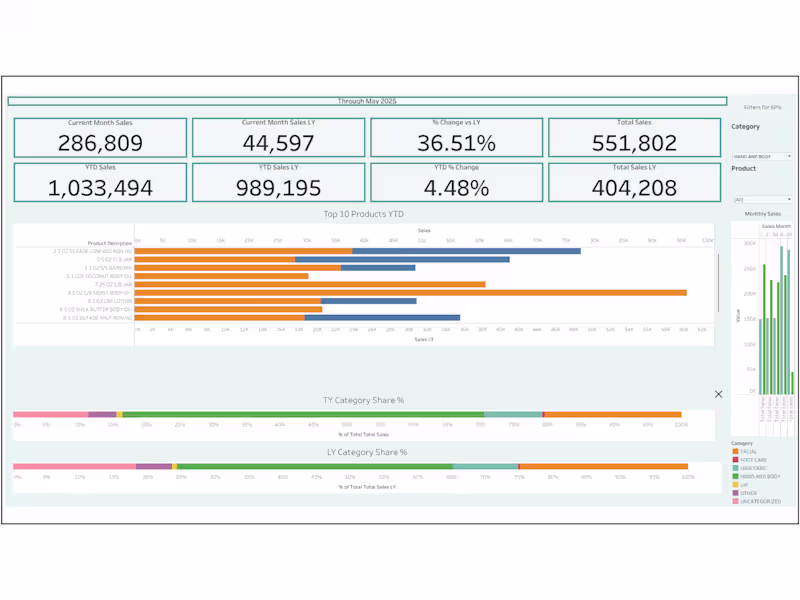
Sales KPI Insights in Tableau
0
51
Message
0
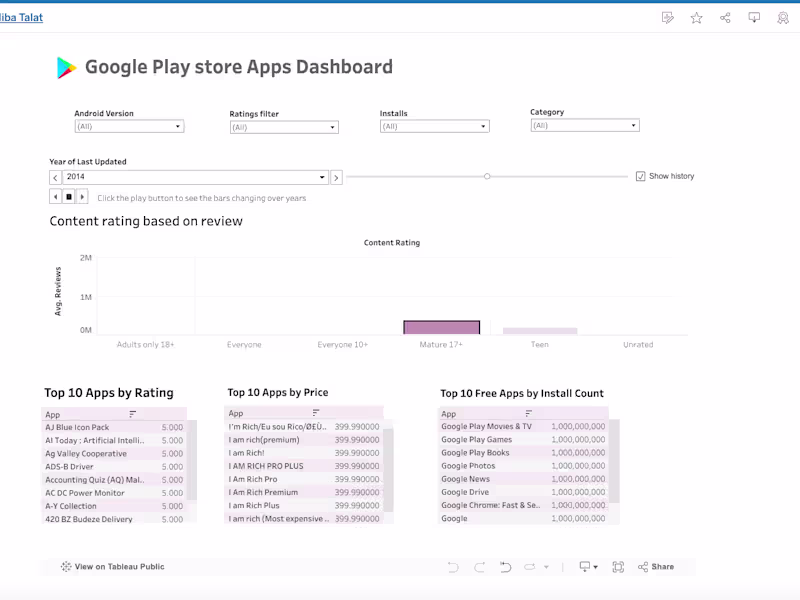
hiba talat
Google Play Store Apps Dashboard
0
8
Message
0
Owar Omot
CO2 Global Emisons
0
9
Message
0
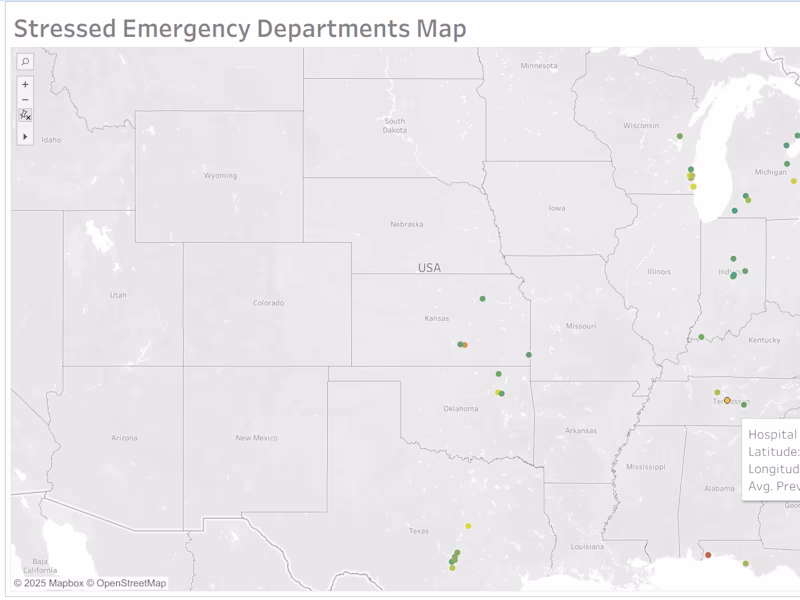
Kaedyn Cruickshank
Emergency Resource Allocation Analysis & Dashboard Creation
0
8
Message
0
Adwoa Marfo
Sales & Customer Analytics Dashboard
0
12
Explore projects