Sales & Customer Analytics Dashboard
Adwoa Marfo
Sales & Customer Analytics Dashboard | Tableau
A data visualization project with Tableau to analyze sales performance, customer behavior, and business trends, enabling data-driven decision-making for executives and management.
Project Overview
This Tableau dashboard provides actionable insights into:
Sales performance (revenue, growth, regional trends)
Customer segmentation (demographics, purchasing patterns)
Product performance (best/worst sellers, profitability)
Key business metrics (YoY growth, customer lifetime value)
Target Audience: Executives, Sales Managers, Marketing Teams
Dataset
The analysis uses structured business data, including:
sales_data.csv: Transaction records (order ID, date, product, revenue)customers.csv: Customer profiles (ID, location, segment, acquisition channel)products.csv: Product catalog (category, price, cost)(Sample datasets included in
/data folder. Replace with your company data.)Tools & Technologies
Tableau Public/Desktop (Download here)
Data Cleaning: Excel
ETL: Tableau
Dashboard Features
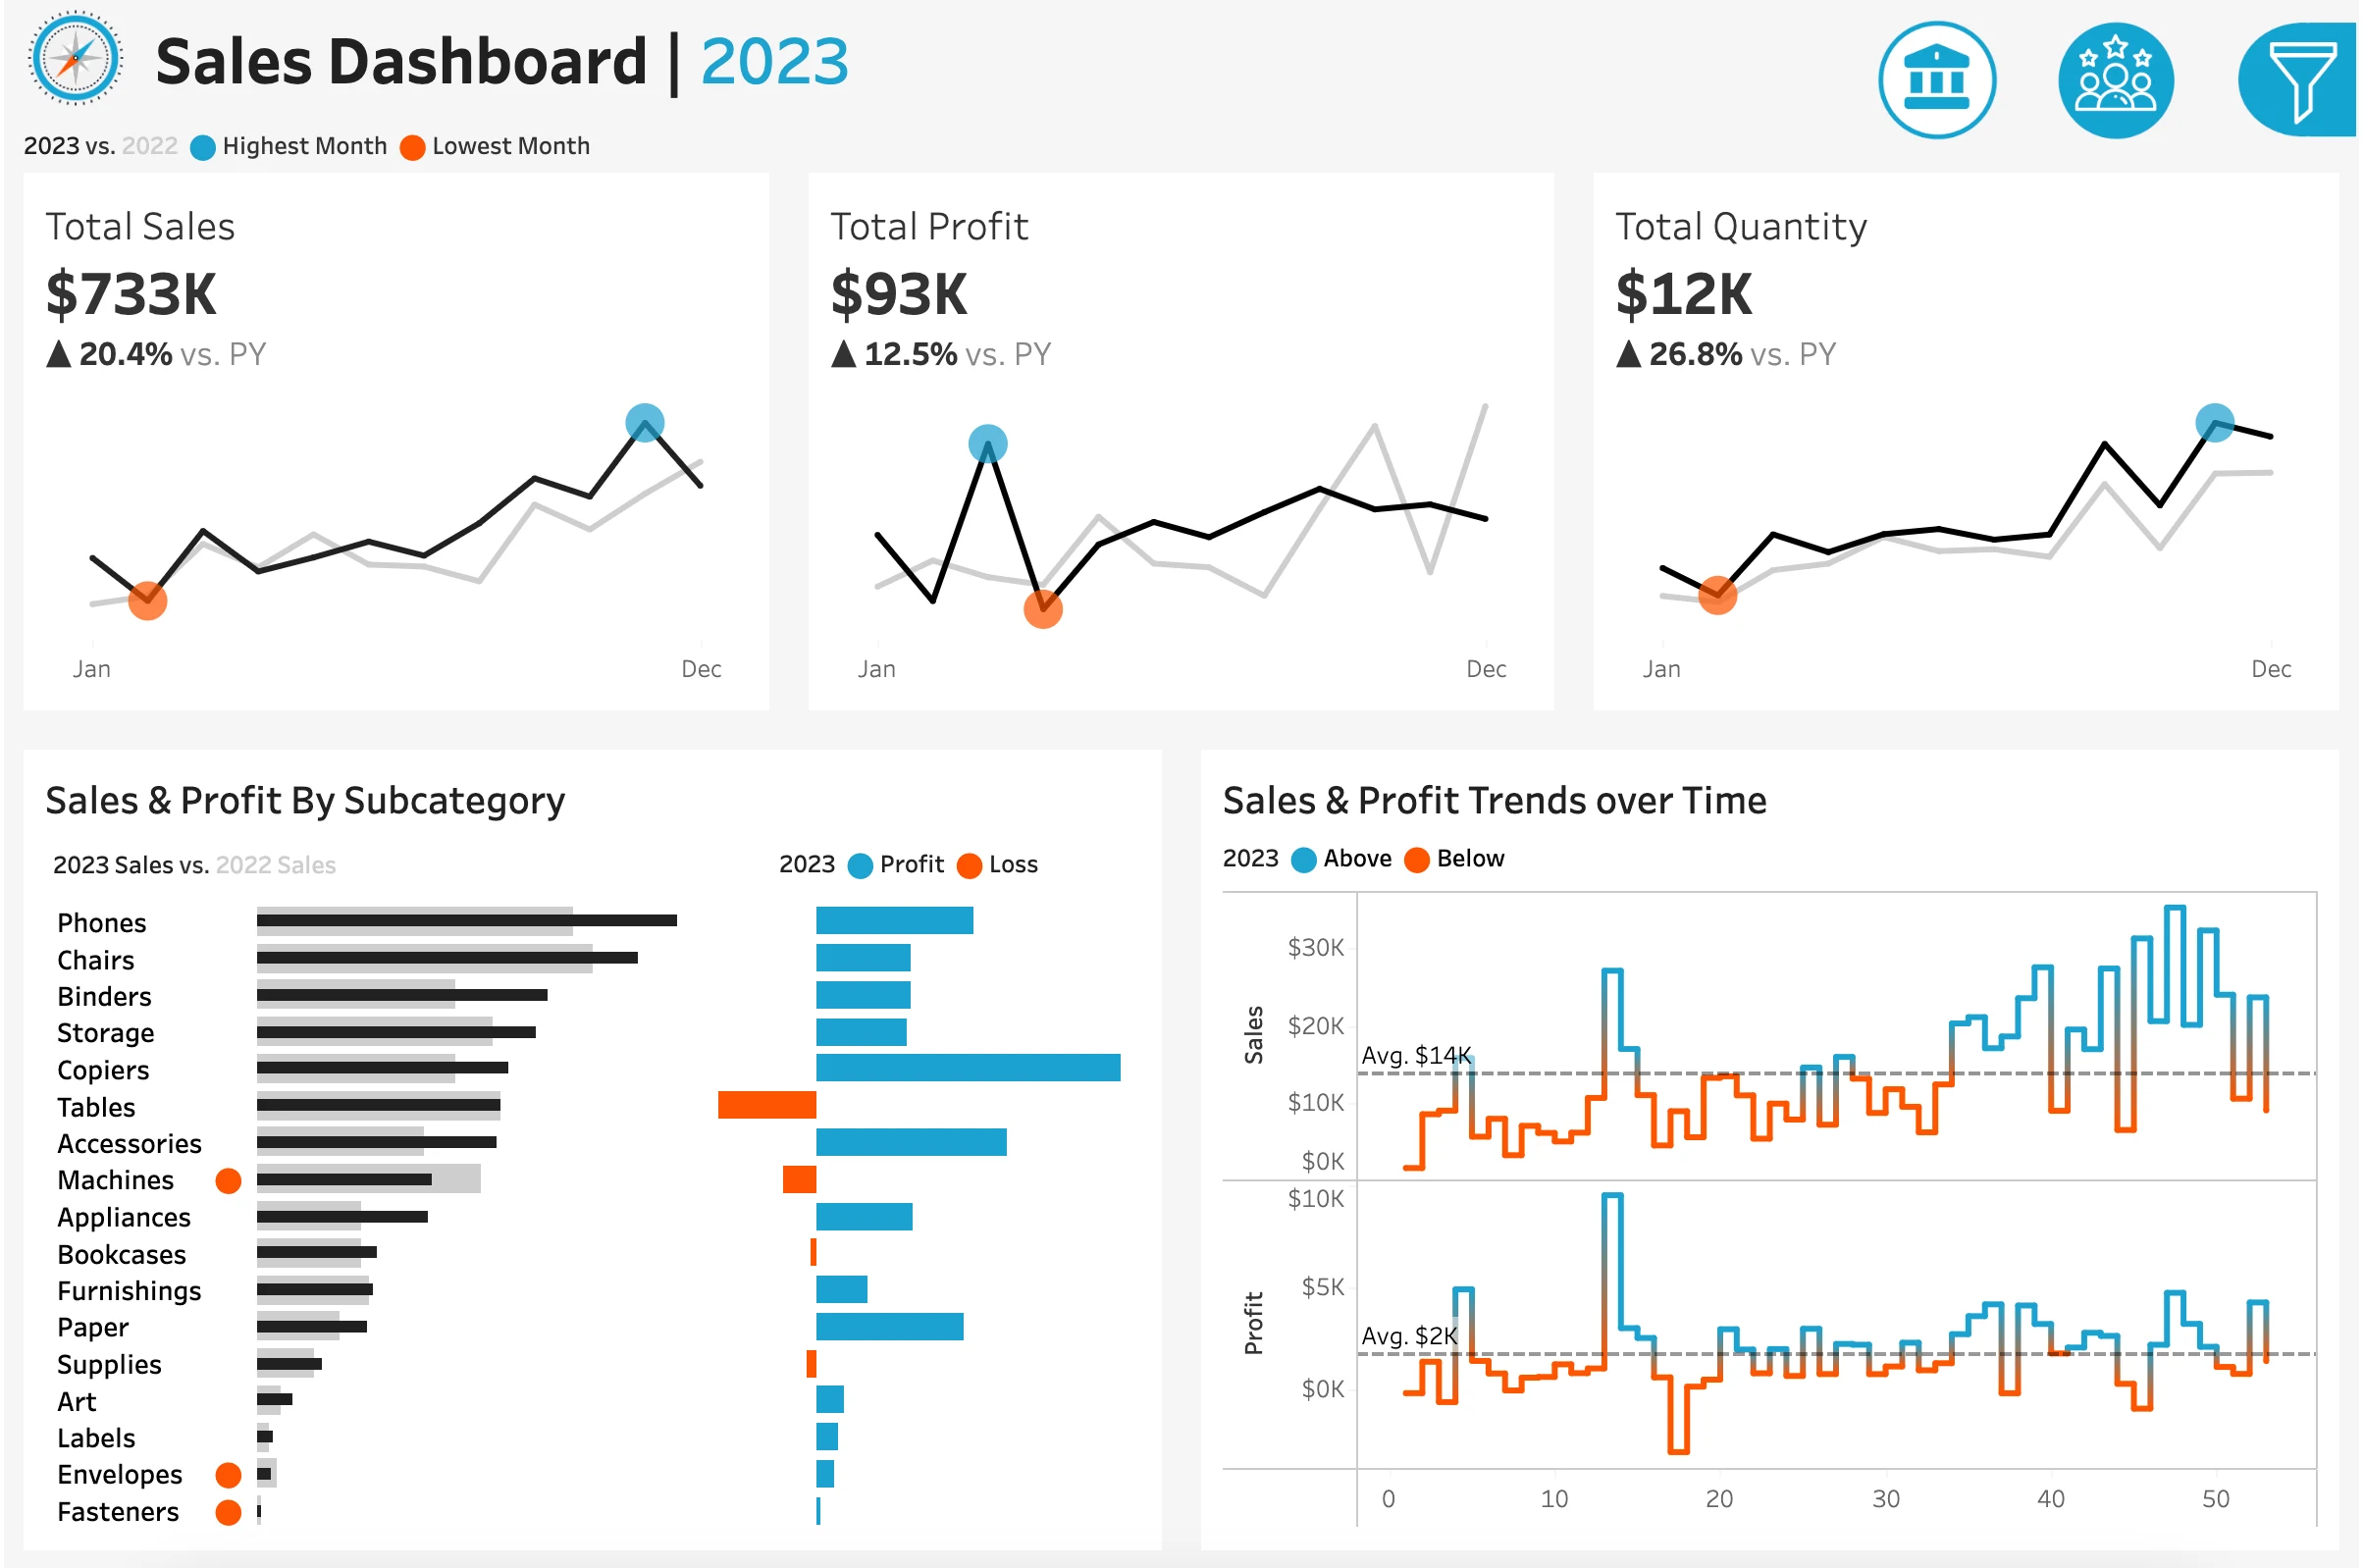
1. Executive Summary
High-level KPIs: Revenue, Profit Margin, Customer Count
Trend analysis (Monthly/Quarterly/Yearly)
2. Sales Performance
Geographic heatmaps (sales by region)
Product category breakdown
Sales funnel analysis
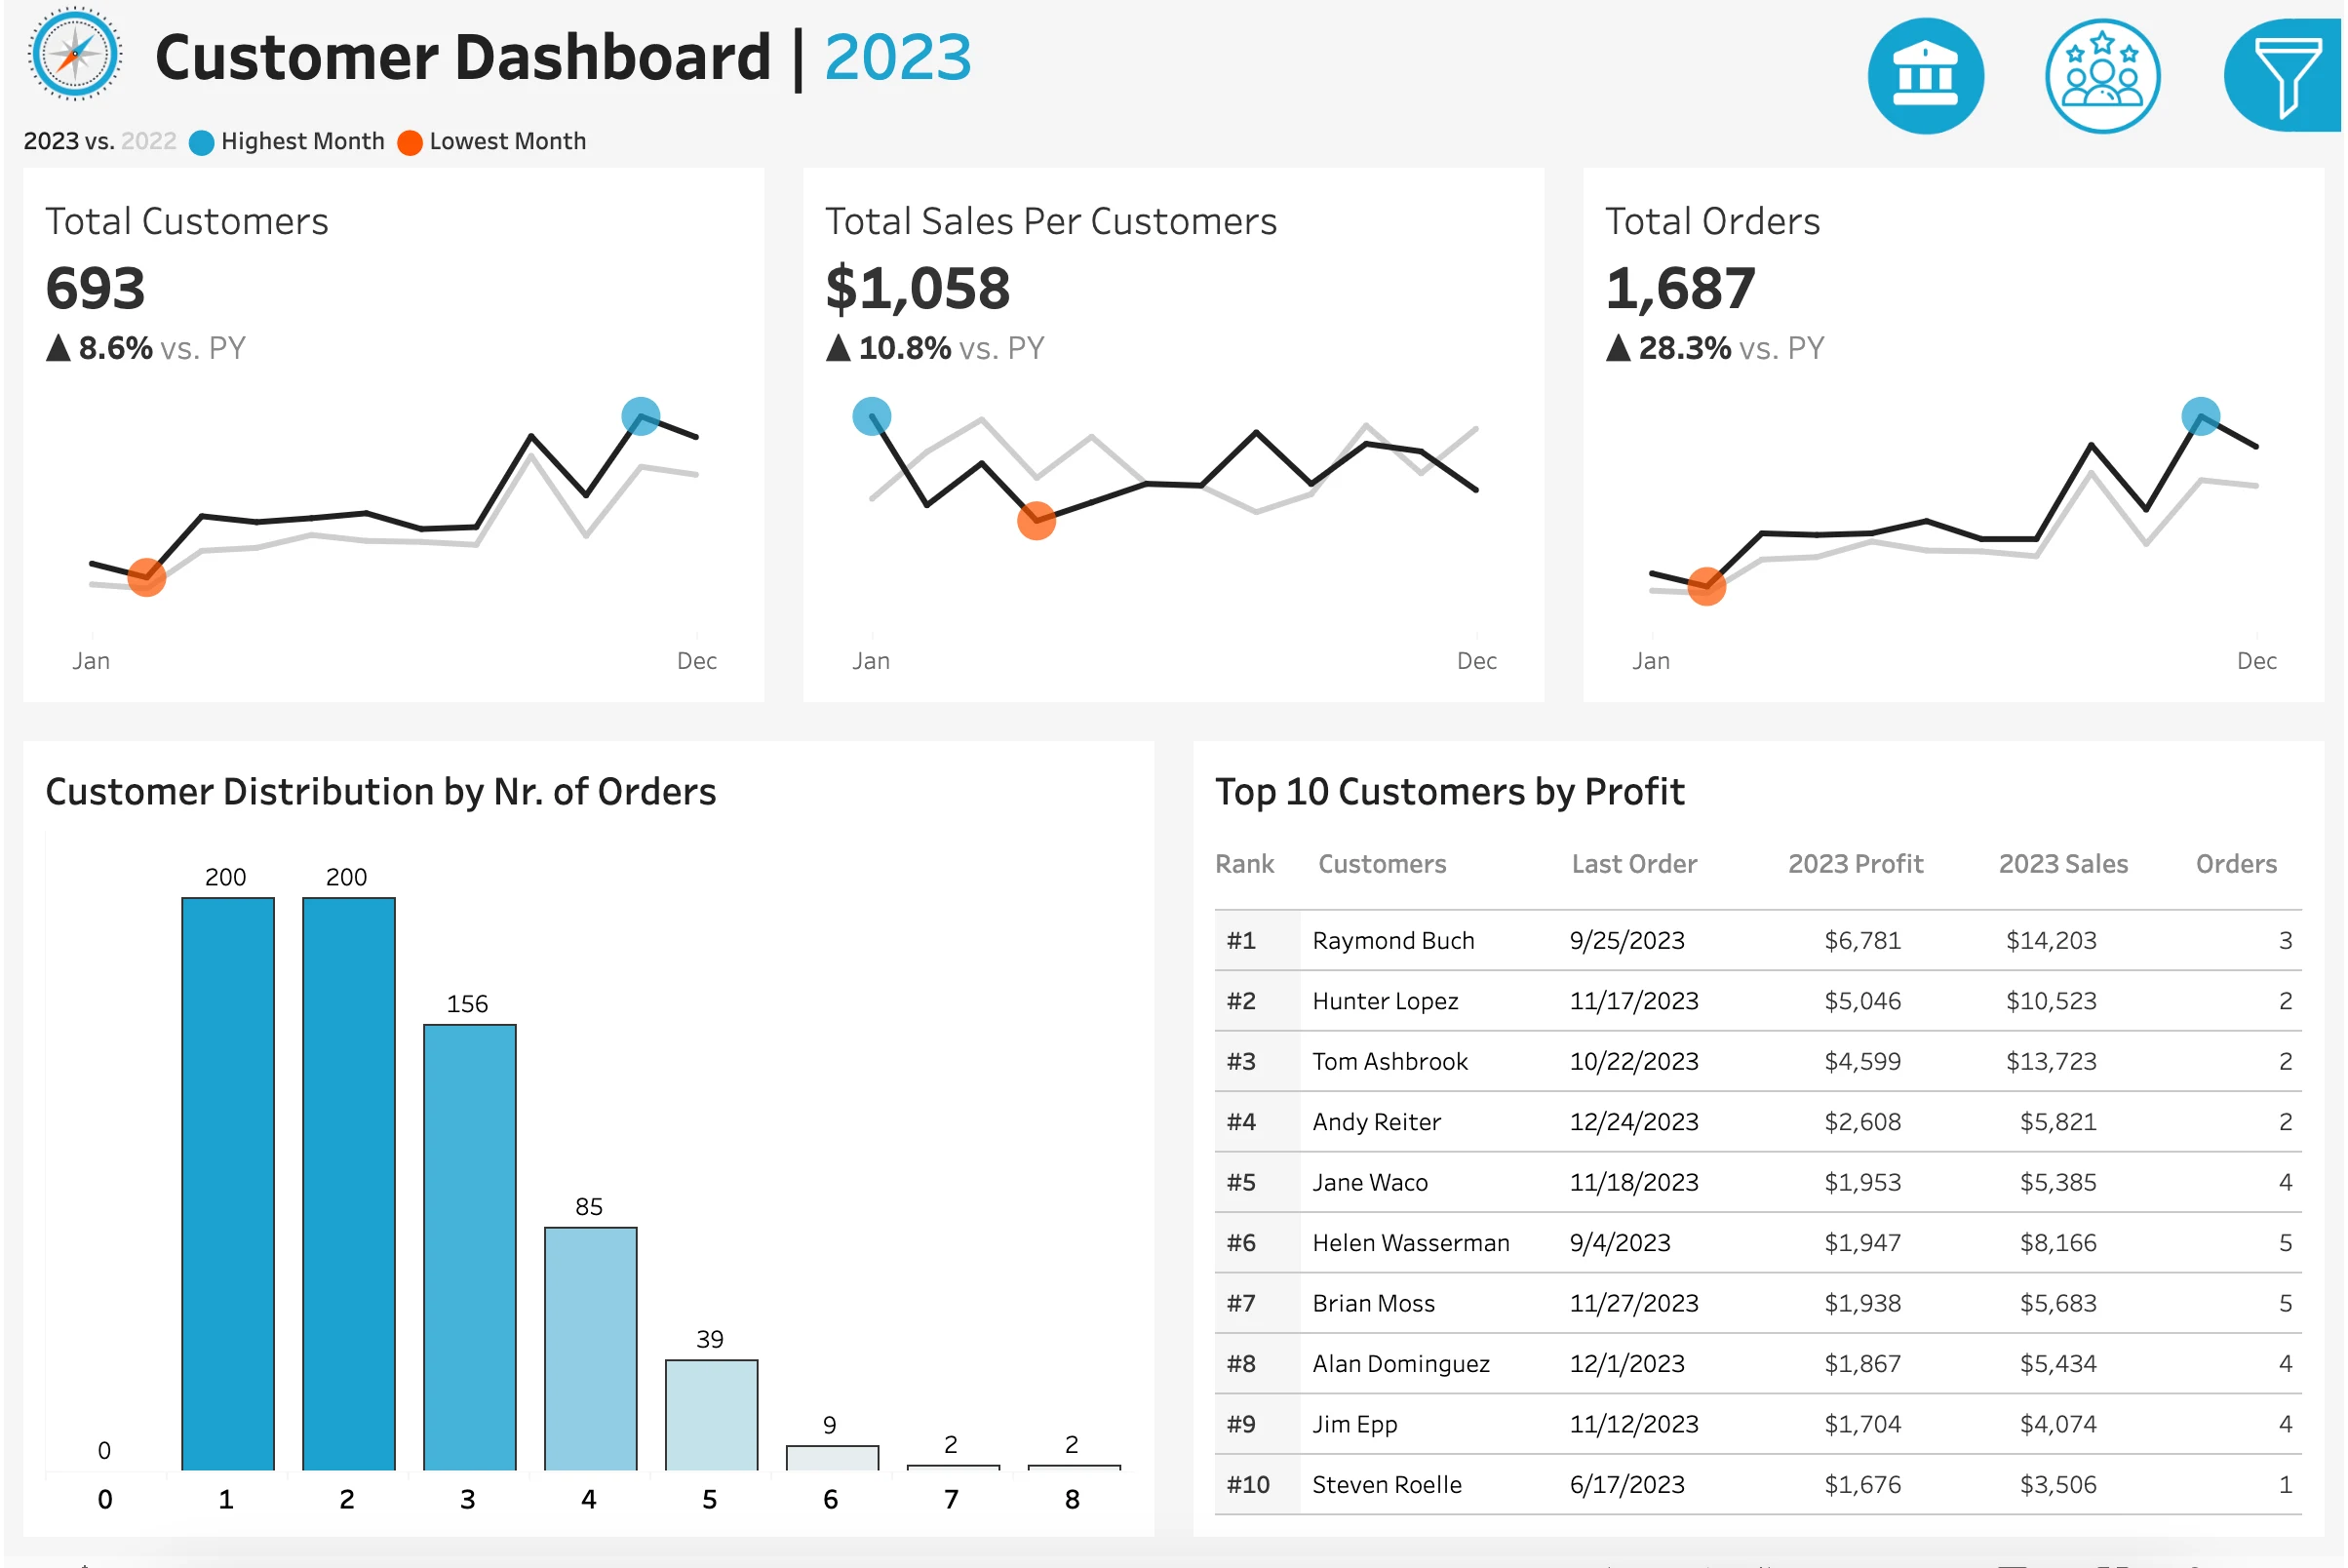
3. Customer Insights
RFM (Recency, Frequency, Monetary) segmentation
Cohort analysis (retention rates)
Churn risk indicators
4. Interactive Filters
Time sliders (date ranges)
Dropdowns for regions/product categories
Dynamic tooltips with drill-down details
How to Use
Option 1: Tableau Public
Use filters/slicers to explore data.
Hover over charts for details.
Key Insights
Top-performing region: West (32% revenue share)
Most profitable product category: Electronics (45% margin)
At-risk customers: 12% of base showing 90-day inactivity
License
MIT License. See LICENSE for details.
Like this project
Posted Aug 29, 2025
A data visualization project with Tableau to analyze sales performance and customer behavior enabling data-driven decision-making for executives and management.
Likes
0
Views
12
Timeline
Feb 10, 2025 - Feb 12, 2025