
Branding + websites for brands who want to seen beautifully


Branding + websites for brands who want to seen beautifully




Branding and web design across culture and tech.

Branding and web design across culture and tech.




Product Design for Refined Experiences

Product Design for Refined Experiences



Social Media Manager | Meta Ads Expert | Brand Growth
- $1k+
- Earned
- 3x
- Hired
- 5.0
- Rating
- 306
- Followers
Social Media Manager | Meta Ads Expert | Brand Growth

StomatraLaunch Carousel Post Design
Social media success isn't about posting more, it's about posting smarter. That's the approach behind this carousel design created for StomatraLaunch.
Designed using Figma and Adobe Photoshop, this carousel was crafted to communicate key messages through clean layouts, engaging visuals, and a structured content flow that keeps viewers swiping. Every slide was designed with readability, brand consistency, and audience engagement in mind.
Tools Used:
Figma
Adobe Photoshop
Services Included:
Carousel Design
Social Media Graphics
Visual Content Design
Brand-Aligned Layout Design
9
18
1.2K

LinkedIn Banner Redesign – Web & App Developer
I redesigned a LinkedIn banner for a website and app developer, focusing on creating a strong personal brand presence that immediately communicates expertise and professionalism.
My work included layout composition, typography selection, and a clean, modern color palette that aligns with the developer’s tech-focused identity. I also structured the visual hierarchy to highlight key services and skills clearly at first glance.
This redesign improved profile visual appeal, strengthened personal branding, and increased engagement by making the profile more attractive and memorable to visitors leading to higher profile views and better connection opportunities.
7
856

Global Social Media Event Flyer Design
I created a series of engaging social media flyers for events hosted by Nigerian women and diverse international communities. Each design was tailored to reflect the uniqueness of the event while maintaining strong visual consistency across platforms.
My work focused on layout design, typography, color harmony, and visual hierarchy to ensure key information was clear and attention-grabbing. I also adapted each flyer to suit different cultural contexts and audience preferences.
This helped organizations improve event visibility, increase audience engagement, and present a more professional and cohesive brand image across all their social media platforms
2
11
933

Forge App – Brand Identity Design
For Forge, I developed a cohesive brand identity that reflects clarity, innovation, and trust. My work included logo design, typography selection, and a well-defined color palette to ensure consistency across all touchpoints.
I created a modern, scalable logo that strengthens brand recognition, paired with fonts that enhance readability and communicate professionalism. The color palette was carefully chosen to evoke confidence and align with the app’s positioning.
This identity system not only improved Forge’s visual consistency but also elevated its credibility, making the brand more memorable and impactful to its target audience.
8
761

Graphic Designer | Brands, Socials & Book Covers
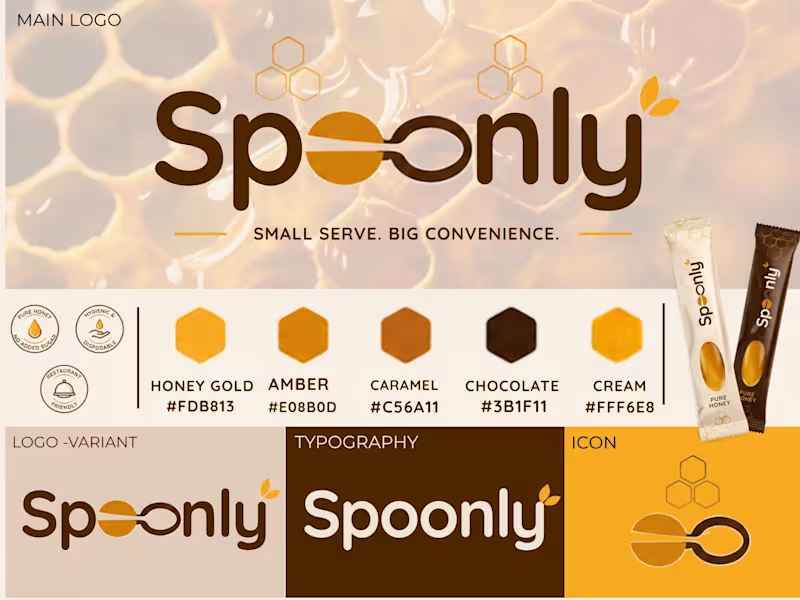
Spoonly | Honey Spoon Brand Identity
A complete brand identity concept for Spoonly, a honey filled disposable spoon designed for restaurants and convenient serving. The project includes the main logo, logo variations, colour palette, typography, icon system and packaging direction.
1
114

Kensara Ivory — Where Your Style Tells a Story of Elegance.
A complete brand identity crafted around bold minimalism, timeless elegance, and modern sophistication. From the distinctive K monogram and refined typography to the warm orange, deep black, and ivory palette, every element was designed to create a memorable and confident visual presence.
Brand Identity | Logo Design | Visual Identity | Typography | Color Palette | Brand Applications
#BrandIdentity #LogoDesign #Branding #VisualIdentity #MinimalBranding #LuxuryBranding #GraphicDesign #BrandDesigner #KensaraIvory #ContraDesigner
1
150

Bold visuals for a brand that knows how to make people hungry. 🍔
A social media post series designed for a modern food brand, combining bold typography, vibrant colours, food imagery and promotional messaging to create an eye catching feed.
The goal was simple: make the content instantly noticeable while keeping the brand consistent across every post.
Designed for:
🍔 Food & restaurant brands
📱 Social media campaigns
🔥 Promotional content
🚀 Food delivery businesses
Design • Visual Identity • Social Media Content
2
191
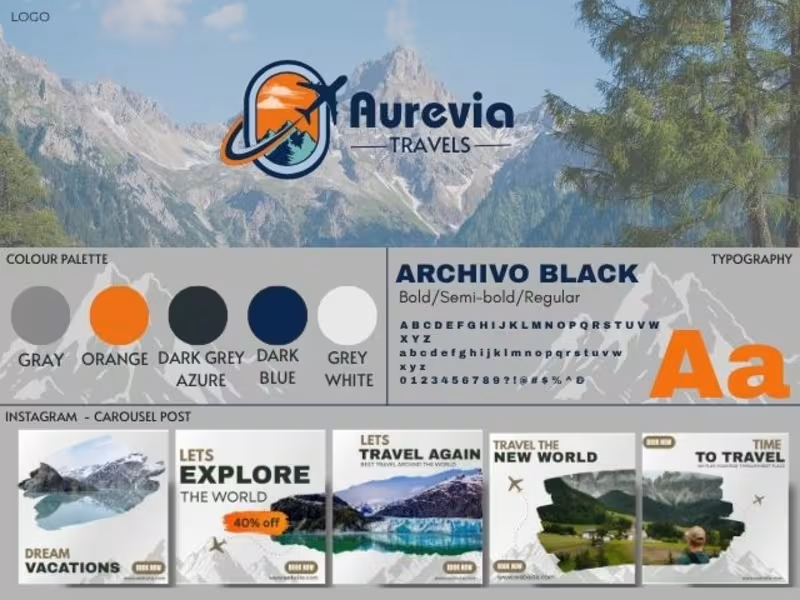
A complete travel brand identity designed for Aurevia Travels ✈️🌍
I created a modern and adventurous visual identity built around the excitement of exploring new places.
The project includes:
• Logo & visual identity
• Colour palette
• Typography system
• Instagram carousel templates
• Instagram highlight covers
• Reel cover designs
• Consistent social media direction
The goal was to create a brand that feels adventurous, premium and recognisable across every touchpoint.
Designed by Daniyal W.
#BrandIdentity #TravelBranding #SocialMediaDesign #GraphicDesign #BrandDesign #InstagramDesign #TravelAgency #ContraDesigner
1
286

A creative soul shaping visual identities with passion.
- 5.0
- Rating
- 3
- Followers
A creative soul shaping visual identities with passion.


Inner Matter is a premium spa focused on providing treatments that reconnect body and mind.
The objective for the project was to express calmness and luxury with the brand elements in a very simple way. Hence, I created a simple and functional logo accompanied by suitable colours, typography, pattern and imagery.
Altogether, the brand elements come together to give a calm and premium impression of the brand.
0
191


I help CPG get more Sales through Brand & Packaging design
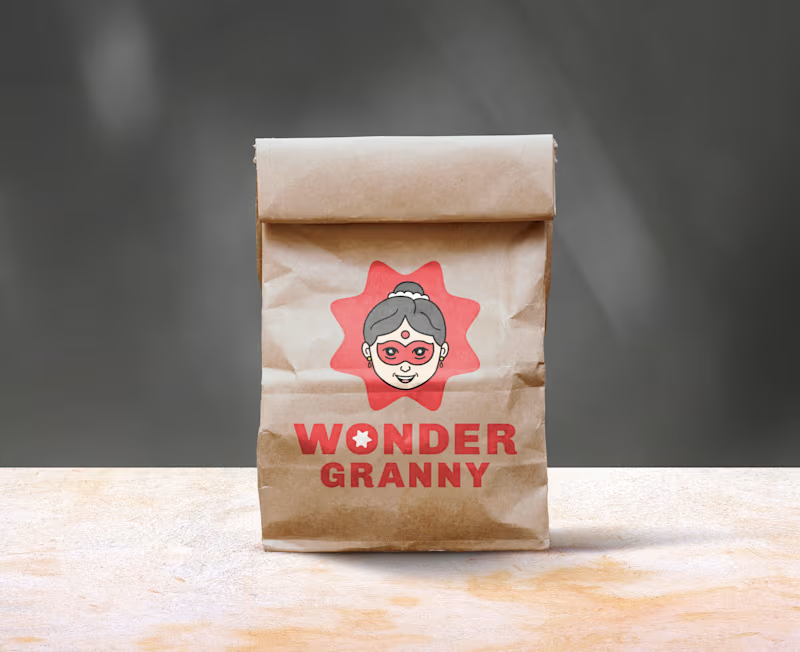
"WONDER GRANNY" Mascot Logo & Brand Identity Design ( full project link (https://app.notion.com/p/Full-Wonder-Granny-Mascot-design-3d92906b9a1680f39b5cffc3e173a88e?source=copy_link) )
Wonder Granny is a superhero-inspired grandma mascot created to give the brand a warm, playful, and distinctive character with a memorable personality
The design blends the familiarity of an Indian grandmother with a playful superhero twist
This combination provides the brand with a trustworthy feel while standing out from typical designs in that market
2
3
280


SAP MM/WM & Power BI Specialist | Inventory & Supply Chain
New to Contra
SAP MM/WM & Power BI Specialist | Inventory & Supply Chain
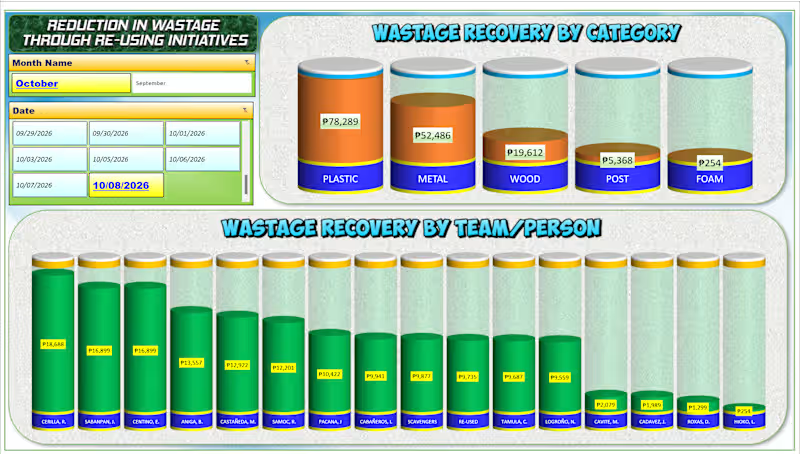
📊 Turning Data into Insights with Excel! 📊
I recently built this dynamic "Wastage Recovery Tracker" dashboard to help teams easily monitor costs, analyze categories, and track performance in real-time.
Good data analysis isn't just about the numbers—it's about making them clear, actionable, and visually engaging.
📩 Need a custom dashboard or data analysis design like this for your business? PM me directly, and let’s discuss how we can bring your data to life!
#DataAnalysis (https://www.linkedin.com/search/results/all/?keywords=%23dataanalysis&origin=HASH_TAG_FROM_FEED) #ExcelDashboard (https://www.linkedin.com/search/results/all/?keywords=%23exceldashboard&origin=HASH_TAG_FROM_FEED) #DataVisualization (https://www.linkedin.com/search/results/all/?keywords=%23datavisualization&origin=HASH_TAG_FROM_FEED) #ExcelTips (https://www.linkedin.com/search/results/all/?keywords=%23exceltips&origin=HASH_TAG_FROM_FEED) #BusinessIntelligence (https://www.linkedin.com/search/results/all/?keywords=%23businessintelligence&origin=HASH_TAG_FROM_FEED) #FreelanceDataAnalyst (https://www.linkedin.com/search/results/all/?keywords=%23freelancedataanalyst&origin=HASH_TAG_FROM_FEED)
0
75
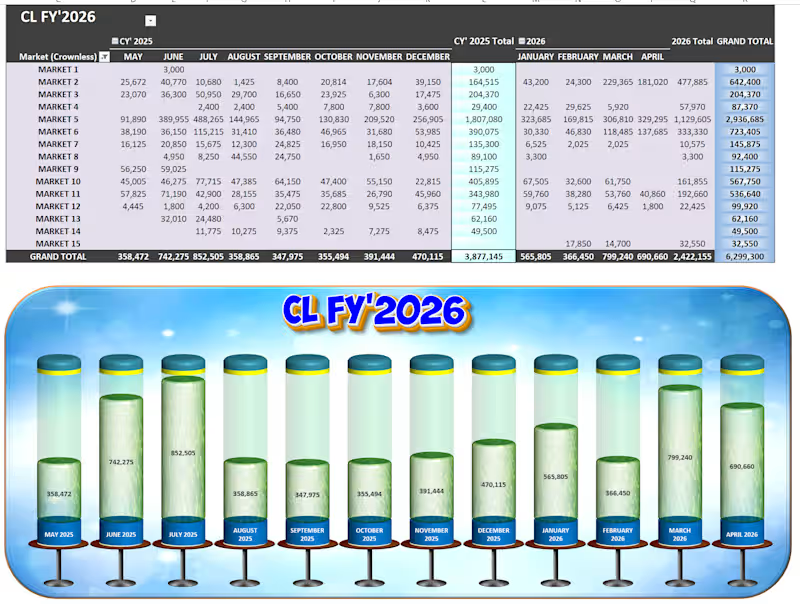
🚀 Project Spotlight: Upgrading Excel to an Executive Web-App UI 📊✨
Most corporate reporting falls into two traps: it is either a dense, unreadable wall of numbers, or a pretty graphic that has to be manually redrawn every single week.
I built this CL FY'2026 Market Performance Tracker to prove that you can achieve automated, heavy-duty backend engineering AND an immersive, software-like user experience entirely within native systems.
Here is the exact 3-tier workflow behind this build:
⚙️ Tier 1: The Automated Pipeline (Power Query)
No manual data entry. No copy-pasting. Raw transactional data is fed directly into Power Query, which acts as the automated data-cleaning engine. With a single click, the query automatically shapes, cleans, and runs ETL processes on thousands of rolling rows, refreshing the dashboard in seconds.
📊 Tier 2: The Core Logic Matrix (Dynamic Pivot Table & 3D Chart)
• The Grid: The transformed data consolidates seamlessly into a multi-period Pivot Table, mapping 15 distinct regional markets across an active 12-month calendar. It handles everything effortlessly, highlighting Market 5 as our heavy hitter with 2,936,685 in total volume.
• The Volumetric Display: The lower chart panel isn't a stagnant graphic—it is a live, native 3D Pivot Chart configured into cylinder metrics. As new numbers hit the backend table, the liquid fill-levels automatically rise or drop in real time to show progress against a 6,299,300 Grand Total.
🎨 Tier 3: The Premium UI Skin (Photopea Enhancement)
To lift the dashboard completely out of the standard "spreadsheet look," I engineered a high-fidelity background framework inside Photopea. Dropping the functional, live Excel components into this polished visual skin provides an immersive app environment, clean visual hierarchy, and polished title framing without compromising a single cell of live functionality.
The Takeaway: Spreadsheets don't have to be boring to be powerful. By treating data architecture like a product, you give clients and executive teams instant clarity at a single glance.
🛠️ Built with: Microsoft Excel (Power Query, Pivot Tables, 3D Charting) & Photopea (UI Layout Design).
0
88
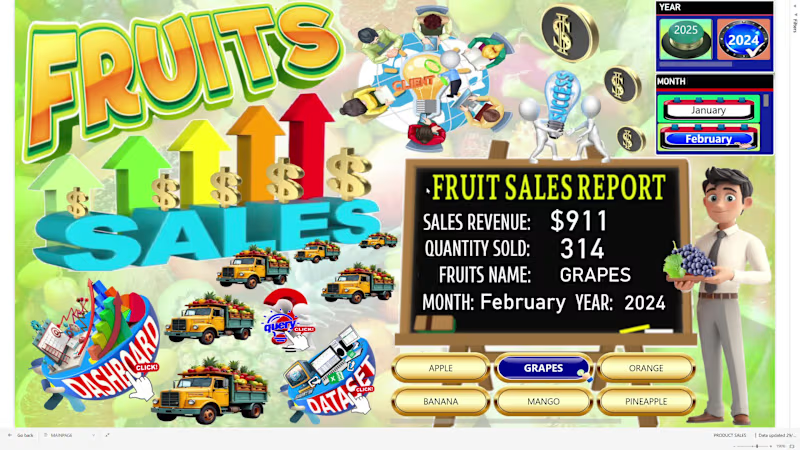
### 🍍 Fruit Sales Data Analysis – Interactive Power BI Dashboard
An interactive Power BI dashboard designed to analyze fruit sales performance and provide clear graphical insights into revenue, sales volume, product, size, and geographic performance.
The dashboard includes:
Sales Revenue – total revenue generated from fruit sales
Total Sales Quantity – total quantity of fruits sold
Sales by Fruit Name – compares sales performance across different fruits
Sales by Size – analyzes sales across different fruit sizes
Sales by City – identifies sales performance by city
Sales by Country – compares sales across countries
Sales per Month – monitors monthly sales performance
Revenue per Month – tracks monthly revenue trends
Sales Trend by Fruit – analyzes monthly sales trends by fruit name
Geographic Sales Analysis – identifies locations with the highest and lowest sales performance
The interactive dashboard allows users to explore product, size, time, and geographic sales patterns, helping identify top-performing fruits and markets while supporting data-driven sales and business decisions.
Key value:
Sales data → KPI analysis → Product & size analysis → Geographic analysis → Monthly trends → Graphical insights → Business decisions
0
107
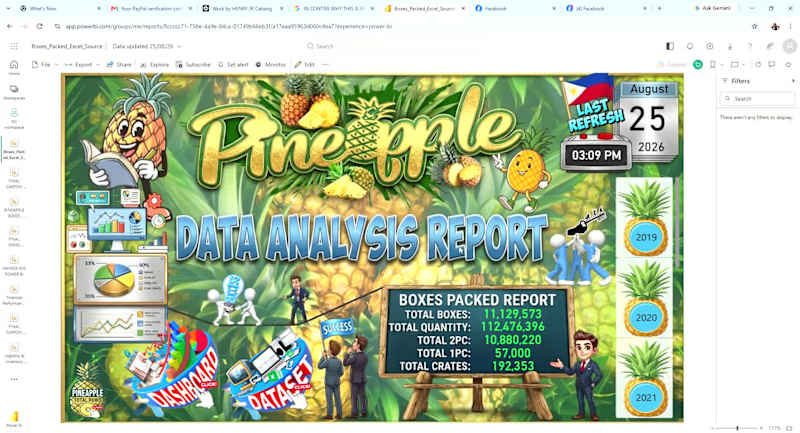
An interactive Power BI dashboard designed to monitor pineapple production and packing performance from 2019 to the present year.
The dashboard provides graphical insights into:
Total Pineapple Boxes Packed – overall production/packing volume
Daily, Weekly, Monthly, and Yearly KPIs – performance monitoring across different time periods
Packing Trends – identifies production trends and changes over time
Brand Distribution – boxes packed by brand
Tag Distribution – analysis of packing tags
Variant Distribution – comparison of different pineapple variants
Pack Size Distribution – analysis of boxes packed by pack size
Time-Based Analysis – allows users to drill into daily, weekly, monthly, and yearly performance
The dashboard helps management quickly understand packing volume, production trends, and product mix, while identifying changes in brand, tag, variant, and pack-size distribution.
Key value:
Production data → KPI analysis → Trend analysis → Product mix → Graphical insights → Better operational decisions
0
81