Freelancers using KerasFreelancers using Keras
Power BI Data Analyst + ML AI Automation Expert
5.0
Rating
107
Followers
Power BI Data Analyst + ML AI Automation Expert
Cover image for End-to-End Machine Learning Pipeline for
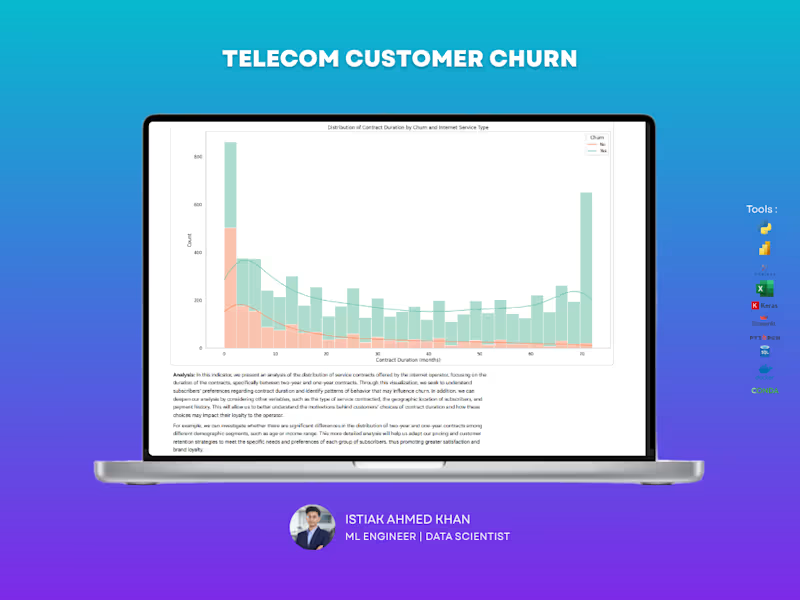
End-to-End Machine Learning Pipeline for Telecom Customer Churn 1. The Business Problem Customer churn is a major challenge for telecommunications companies, driven by competition, service issues, and changing consumer preferences. This project was designed to transition the company from reactive support to proactive retention using data-driven strategies such as customer segmentation, personalized offers, and loyalty programs,. 2. Data Exploration & Insights (EDA) I performed a comprehensive descriptive analysis on a database of 7,043 customers with 21 distinct variables,. Key findings included: Contractual Risk: Customers on month-to-month contracts showed significantly higher churn compared to those on one- or two-year commitments,. Service Preference: While Fiber Optic plans were the most popular, they also represented a critical segment for monitoring due to their higher price points,. Financial Indicators: Churned customers had a higher average monthly charge of $74.44, compared to $61.27 for retained customers. Payment Behavior: The "Electronic Check" payment method was most strongly associated with service cancellation,. 3. Engineering & Preprocessing Pipeline To prepare the data for high-performance modeling, I implemented a rigorous preprocessing workflow: Data Cleaning: Removed irrelevant identifiers like customerID and addressed potential data quality issues. The dataset was verified to have zero missing or NaN values,. Feature Engineering: Applied Label Encoding to transform categorical text variables into a numerical format suitable for machine learning algorithms,. Data Splitting: Adopted a standard 80/20 train-test split to ensure the model could generalize effectively to unseen data,. 4. Model Development & Benchmarking I developed and benchmarked eight distinct machine learning algorithms to identify the most effective solution for this specific application: Linear & Probabilistic: Logistic Regression, Naive Bayes. Tree-Based: Decision Tree, Random Forest. Boosting Frameworks: AdaBoost, Gradient Boosting, XGBoost, and LightGBM,. 5. Performance Evaluation & Results Models were evaluated using ROC curves, confusion matrices, and detailed classification reports,. Winner: Logistic Regression achieved the highest accuracy at 81.83%,. Secondary Performers: Gradient Boosting (81.05%) and AdaBoost (80.98%) also showed strong predictive power. 6. Technical Conclusion This data-driven approach proves that proactive churn prediction is essential for business sustainability. By identifying that customers prioritize high-speed fiber optic services but are sensitive to pricing and contract terms, the company can now optimize its pricing and retention strategies to maximize user satisfaction and revenue.
4
715
I’m an AI & Machine Learning engineer with expertise in deve
Cover image for What your attention heatmap isn't
What your attention heatmap isn't telling you Everyone's staring at attention heatmaps and calling it "interpretability." Almost nobody's asking whether a single attention map actually tells you what the model used to make its decision. It doesn't. Not on its own. A raw attention map from layer 8 shows you what layer 8 attended to. It says nothing about how that signal got mixed, diluted, or overwritten by every layer before and after it. Attention rollout fixes this — and I built a walkthrough to show why it matters. Here's what makes it more than a "pretty heatmap" demo: Instead of visualizing one layer's attention, I traced how information actually flows through the full transformer stack. → Every layer's attention matrix is extracted, per head, per token → Multi-head attention is averaged, then combined with the residual connection (identity + attention) — this is the step most tutorials skip, and it's the one that actually matters → The combined matrices are matrix-multiplied layer by layer, rolling attention forward from input to output → The result: a single map showing genuine token-to-token influence across the entire network, not just one layer's snapshot The overlay shows you everything: → Per-layer attention vs. rolled-out attention, side by side → Token importance scores overlaid directly on the input text → A comparison view: which tokens raw attention says "matter" vs. which ones rollout says actually matter → Head-level breakdown so you can see which heads specialize vs. which are noise No black box. No "trust me, the model looked here." Just linear algebra, applied honestly across every layer instead of cherry-picking one. Built with PyTorch + HuggingFace Transformers + Matplotlib. Runs on any pretrained transformer, fully offline. ⚠️ Important: attention rollout is an approximation, not ground truth. It assumes attention is the primary information pathway, which ignores MLP layers and can still mislead for very deep models. Treat it as a debugging lens, not proof of causality.
0
69
Data Analyst turning Data insights into business impact.

5.0
Rating
2
Followers
Data Analyst turning Data insights into business impact.

Senior Software Engineer | 10+ Yrs Across Industries
8
Followers
Senior Software Engineer | 10+ Yrs Across Industries

Builds AI And help business to grow 10x with quality
New to Contra
Builds AI And help business to grow 10x with quality
Tech Renaissance Leader: AI, FinTech, Web