The network for creativity
Join 1.25M professional creatives like you
Connect with clients, get discovered, and run your business 100% commission-free
Creatives on Contra have earned over $150M and we are just getting started
Back to feedPost
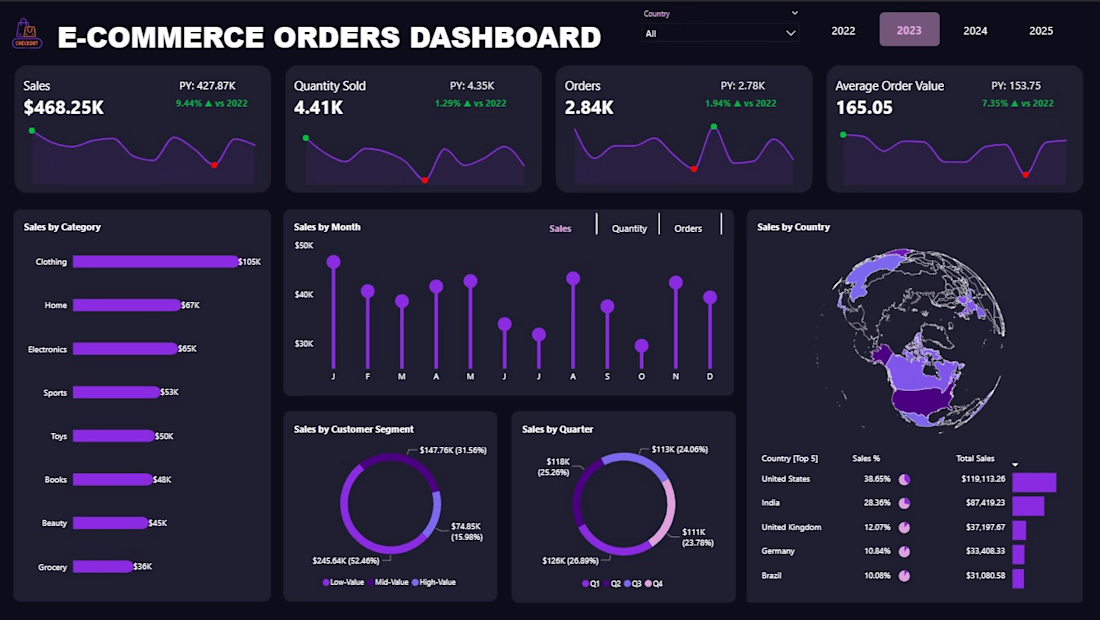
The E-Commerce Orders Dashboard provides a comprehensive overview of order performance, revenue trends, and customer purchasing behavior. Designed for online businesses, this dashboard transforms transactional order data into actionable insights that support growth, operational efficiency, and strategic decision-making.




Thank you Rayhan
The network for creativity
Join 1.25M professional creatives like you
Connect with clients, get discovered, and run your business 100% commission-free
Creatives on Contra have earned over $150M and we are just getting started

Challenges
View all


Related posts


technical dashboard
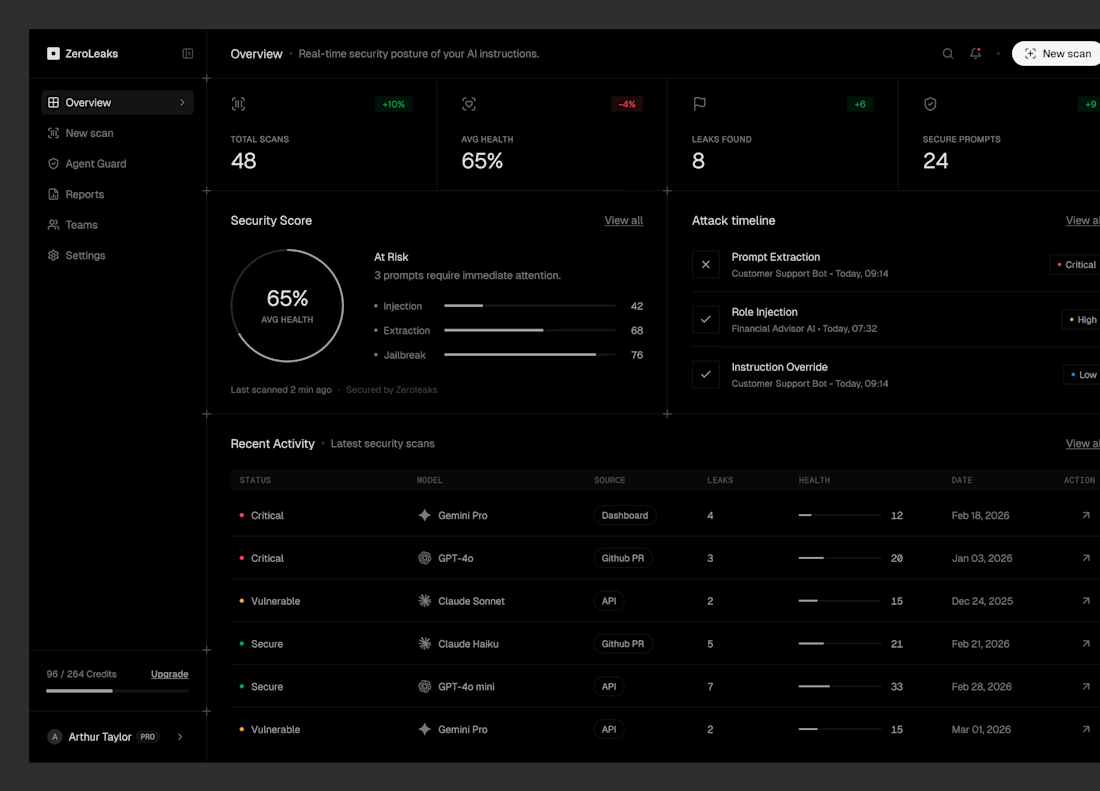

A client came to me with a problem every exhibition team knows.
They collected visitor business cards all day…
then someone had to type up the details and email each lead to the right company.
Slow. Easy to mess up. And leads went cold while they waited.
So I automated it. Here's how it works now 👇
📸 Staff take a photo of the visitor's business card and fill a short form
🏷️ They pick the visitor type (the company this lead belongs to)
💾 They click Save
That's it. In the background, the system:
✅ Creates a clean PDF with all the visitor details
✅ Emails it to the right company automatically
✅ Sends a confirmation to the staff member who added it
🔁 If an email fails, it retries 2 more times on its own
And if an email still fails?
I added a new screen to their admin panel:
→ See every email: Sent ✅ or Failed ❌
→ Resend one with a single click
→ Or resend all failed emails at once
No chasing. No lost leads. No manual follow-ups.
The client loved it, and honestly, that's my favourite part of the job.
The lesson: good automation isn't flashy. It quietly removes boring work so your team can focus on people, not paperwork.
If you run events, exhibitions, or any business where leads get lost between "collected" and "followed up", let's talk. My DMs are open 👋


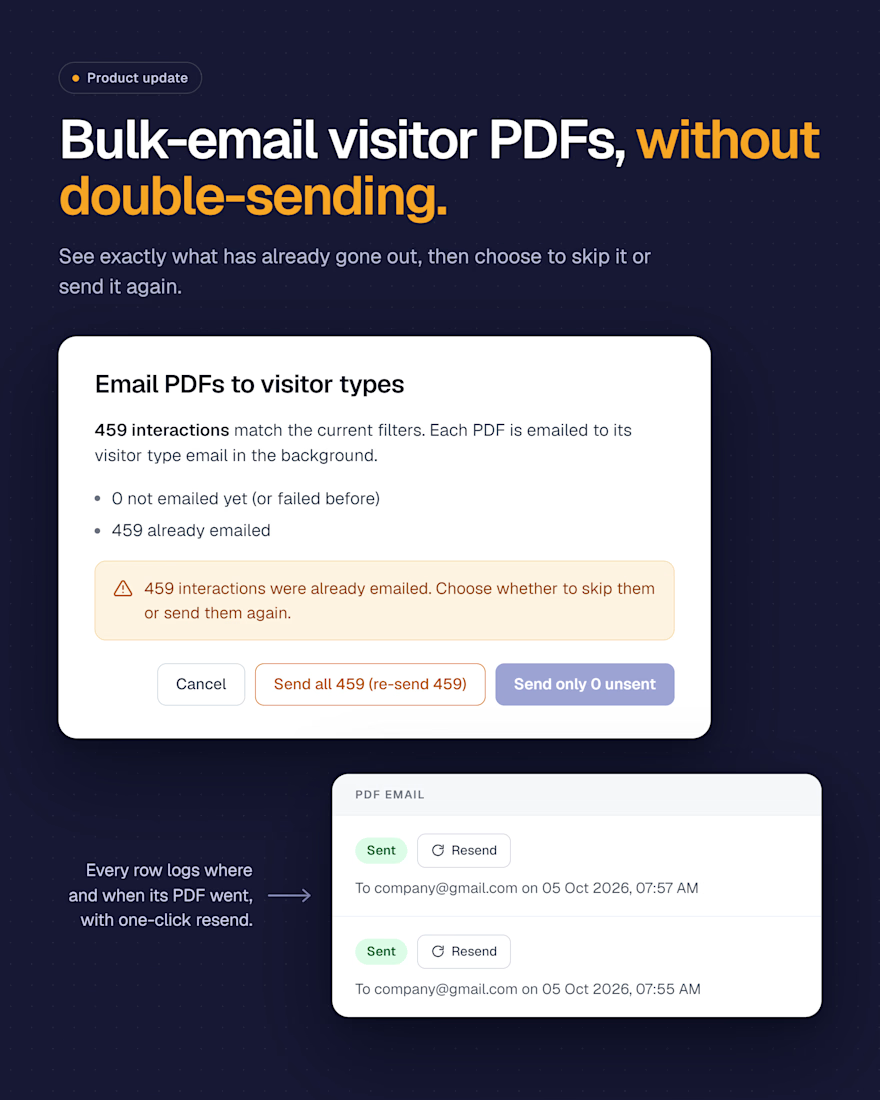


Created a Global Sales Performance Dashboard in Excel to analyse sales, profit, and business performance across different regions, product categories, and sales channels.
The dashboard combines key business metrics and visualisations to highlight regional performance, compare online and offline sales channels, and identify areas generating strong or weak sales and profitability. Interactive filters allow users to explore the data and uncover insights that can support informed business decisions and improve sales strategies.
Tools Used: Microsoft Excel, PivotTables, PivotCharts, and Slicers.
