




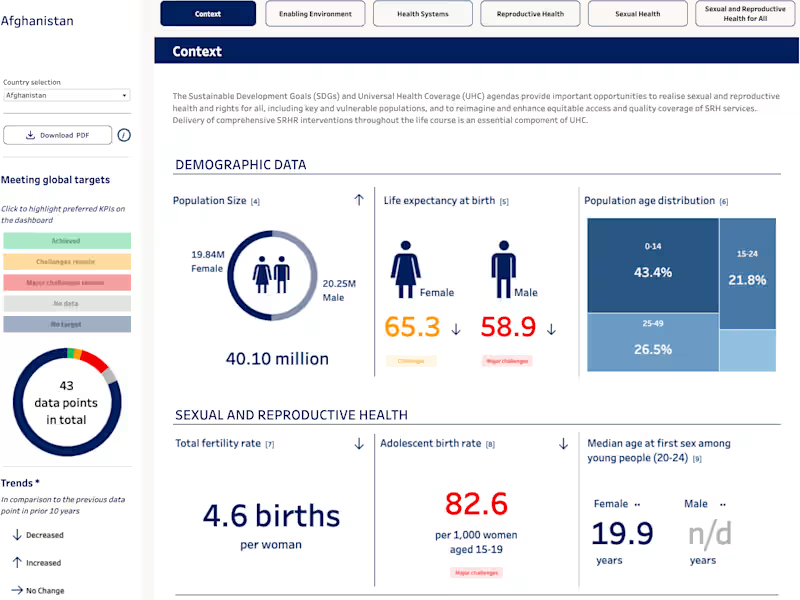

I turn raw, messy business data into a reporting layer a decision-maker actually reads: a one-glance dashboard (spend by month/category, price movements), breakdowns by supplier and category, price-trend tracking, and a ledger where every figure reconciles (net + VAT = gross, totals tie back). Rebuilds into a multi-sheet Excel workbook. Works from any CSV, spreadsheet or accounting export.
1
121


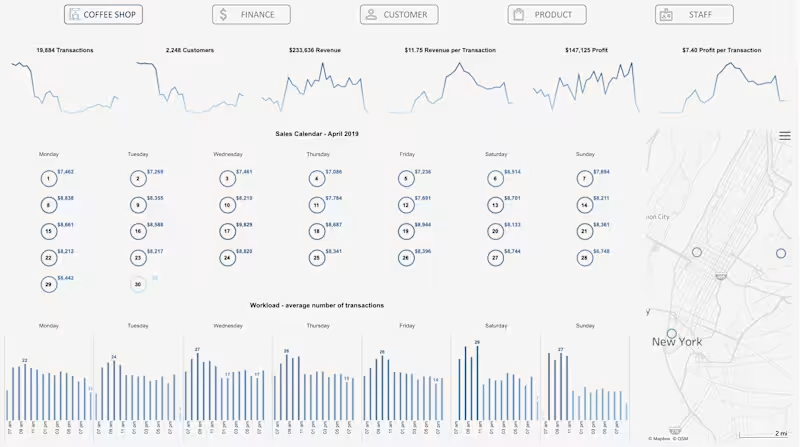


Developed a comprehensive SaaS analytics system to track MRR dynamics and Unit Economics.
Backend: Wrote complex SQL scripts (Window functions, CTEs) to transform raw payment data into monthly cohorts.
Frontend: Built a Tableau dashboard for monitoring LTV, Churn Rate, and Revenue expansion/contraction.
Result: Business can now identify exactly why revenue is changing and track customer lifetime value in real-time.
0
66

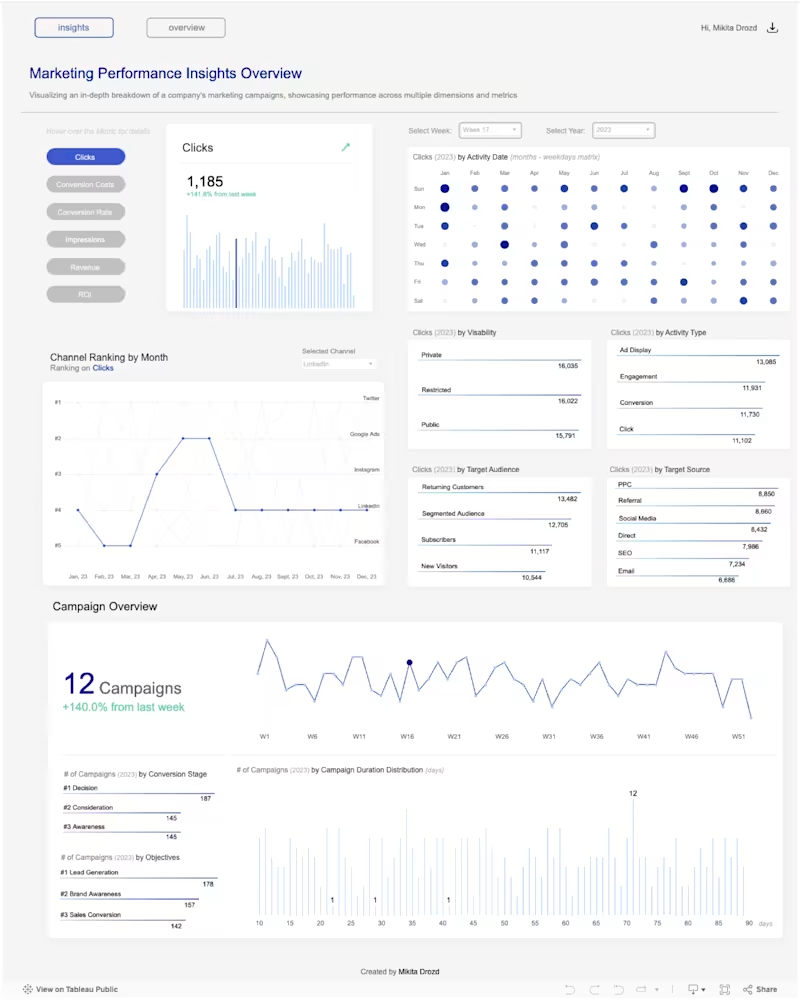

GA4 Ecommerce Analysis & Tableau Dashboard
In this project, I transformed raw Google Analytics 4 data into an interactive Tableau dashboard.
Key highlights:
Processed 1.7GB of data in BigQuery using SQL (UNNEST, CTE).
Visualized the full User Purchase Journey and conversion rates.
Analyzed performance by device, OS, and landing pages to identify growth opportunities.
0
66