Aspiring Data Analyst skilled in Power BI & dashboards
Data Scientist: Python, RStudio, ML, BI, NLP, DL, LLM
Data Scientist: Python, RStudio, ML, BI, NLP, DL, LLM
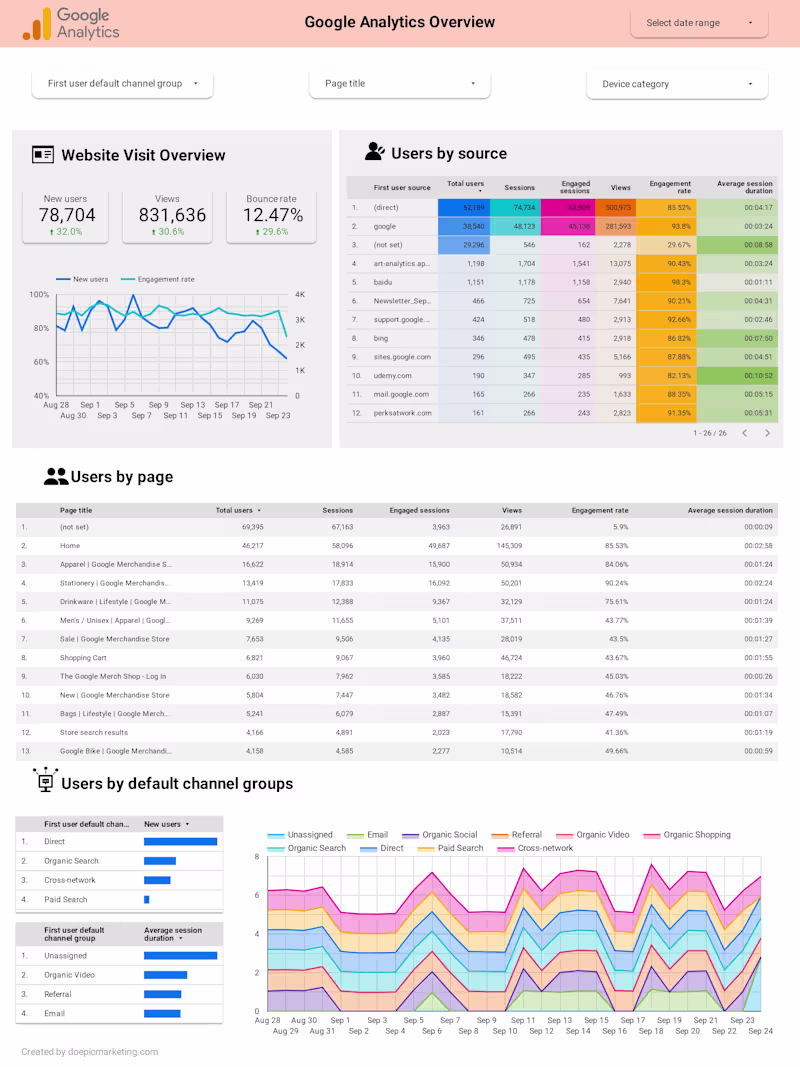
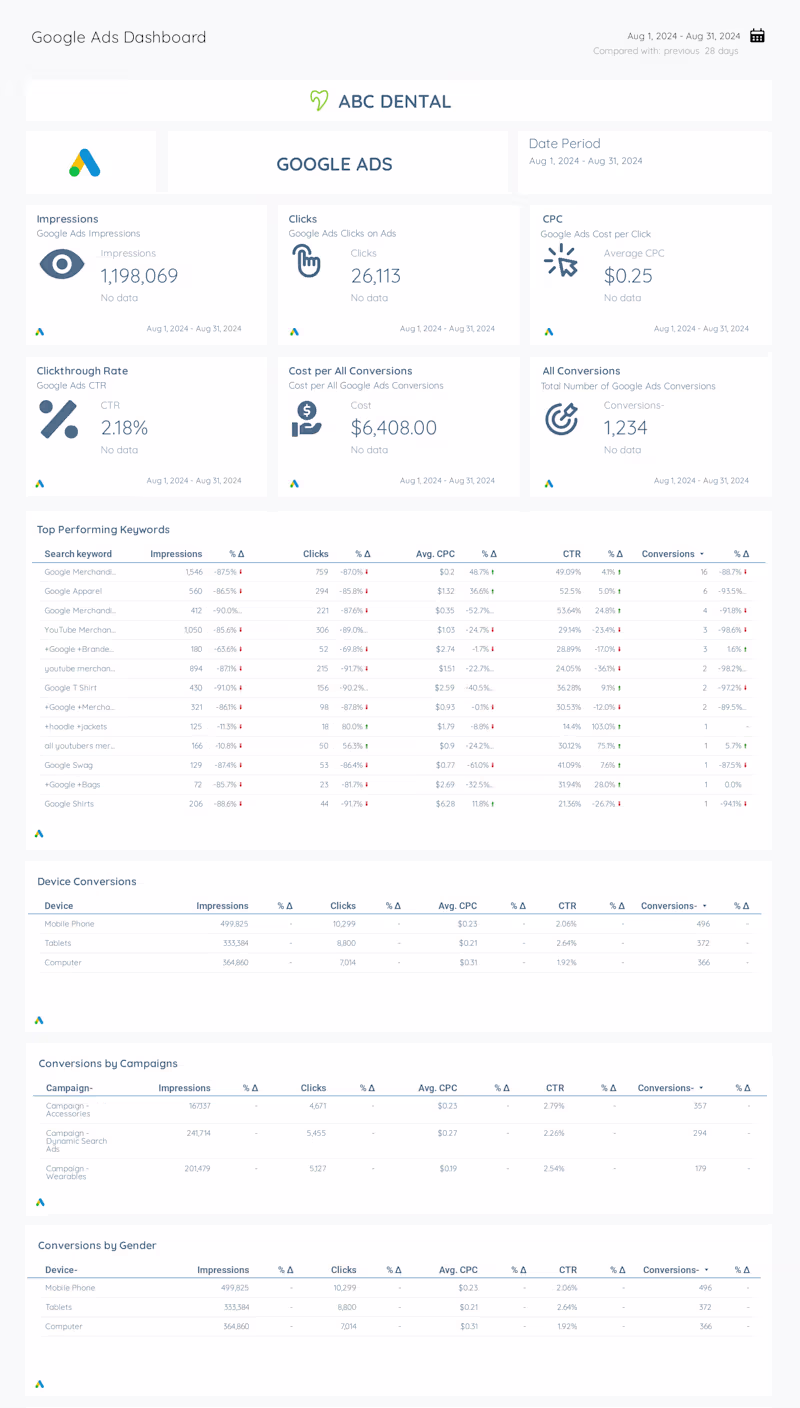
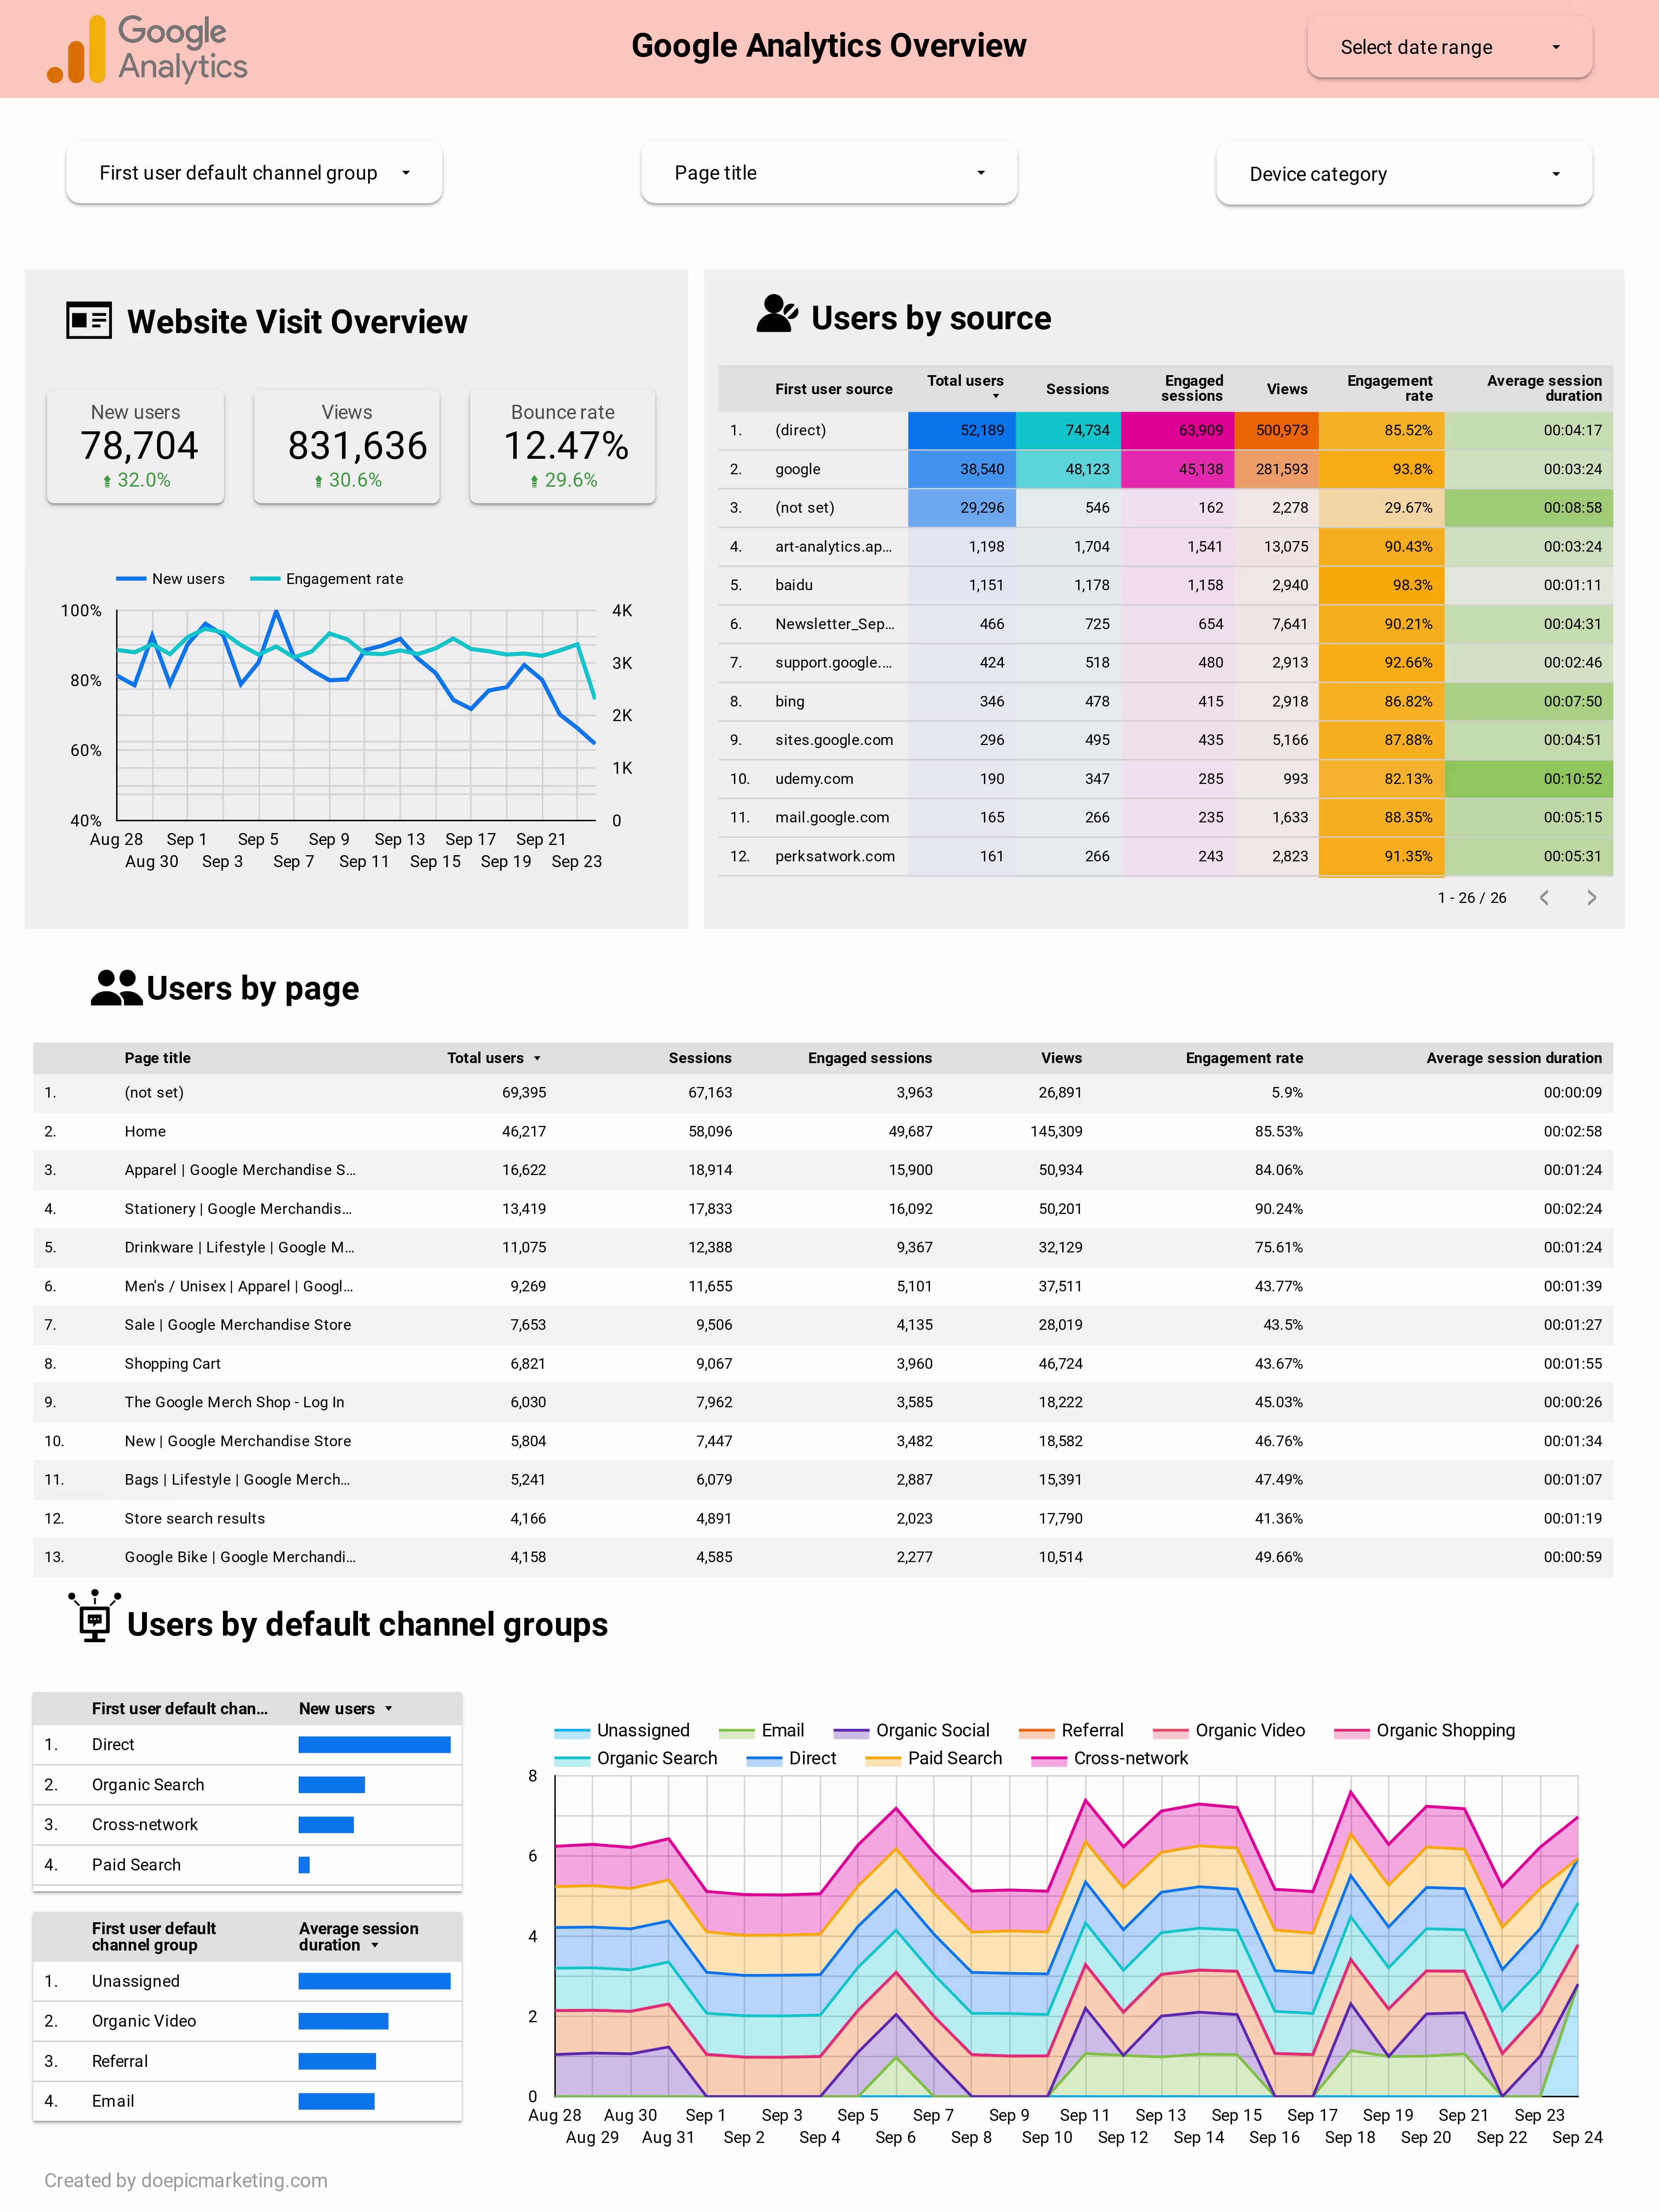
Looker Studio Expert | Google Analytics 4 & GTM expert
Looker Studio Expert | Google Analytics 4 & GTM expert
View more →
Building high-performance web applications that scale.

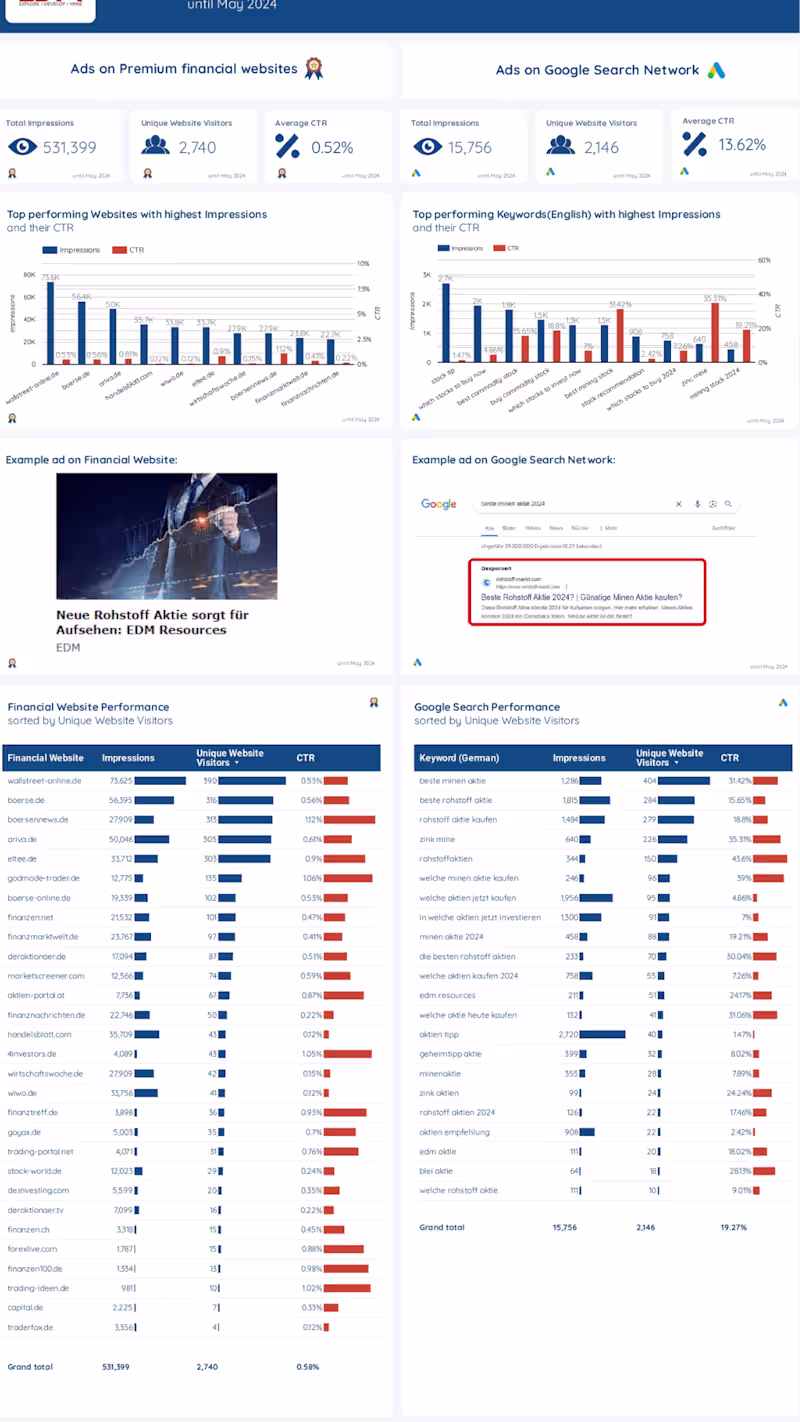
Data Insights & Stunning Visuals Expert
Data Insights & Stunning Visuals Expert
View more →
I turn data into information, and information into insight.
I turn data into information, and information into insight.

View more →
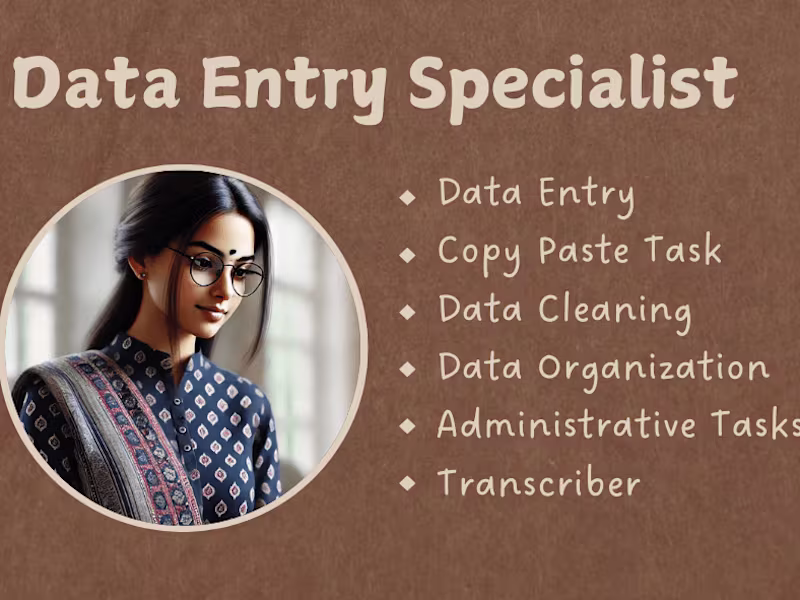
Data Entry and Excel Pro:Cleaning, Formatting and Organizing
Data Entry and Excel Pro:Cleaning, Formatting and Organizing


View more →
Motion & Visual Designer - Helping Brands Win Attention
Motion & Visual Designer - Helping Brands Win Attention