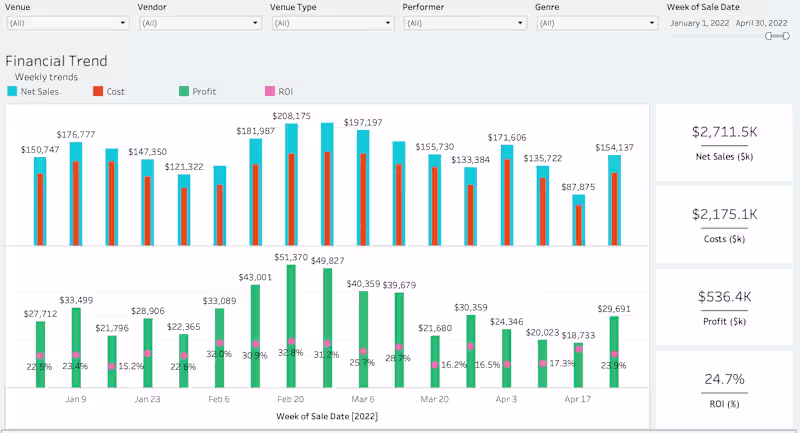
Projects in UnderwoodProjects in UnderwoodFinancial dashboards shouldn’t just show trends — they should explain what’s driving profitability.
In this project, I built a Tableau dashboard that connects weekly sales, costs, profit, and ROI in a single view, allowing leaders to see where and when returns were actually being generated.
What I focused on:
Aligning sales, cost, and profit to the same time grain
Making ROI visible alongside volume, not buried in spreadsheets
Enabling quick comparisons across venues, vendors, and performers
The result:
Teams could identify high-ROI weeks and segments and make informed decisions about pricing, spend, and future bookings.