Freelancers using Microsoft Excel in TaguigFreelancers using Microsoft Excel in Taguig
SAP MM/WM & Power BI Specialist | Inventory & Supply Chain
New to Contra
SAP MM/WM & Power BI Specialist | Inventory & Supply Chain
Cover image for πŸš€ Project Spotlight: Upgrading Excel
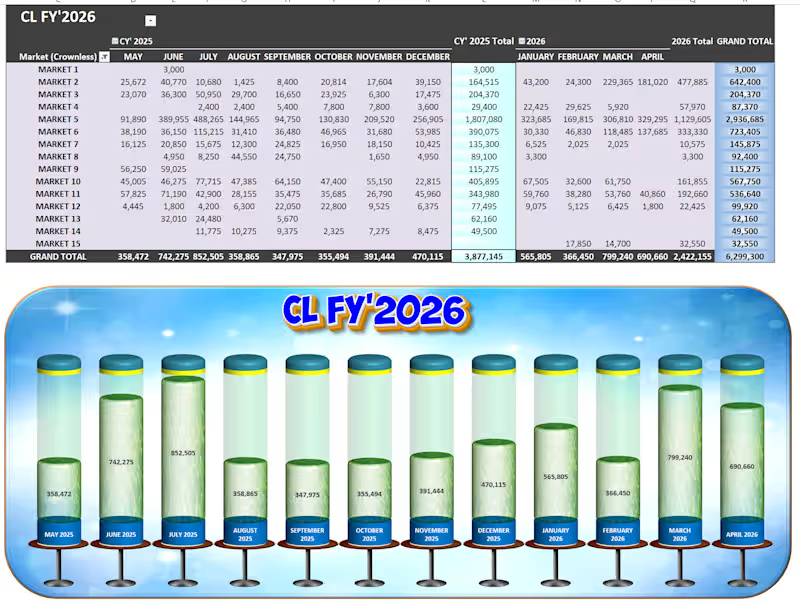
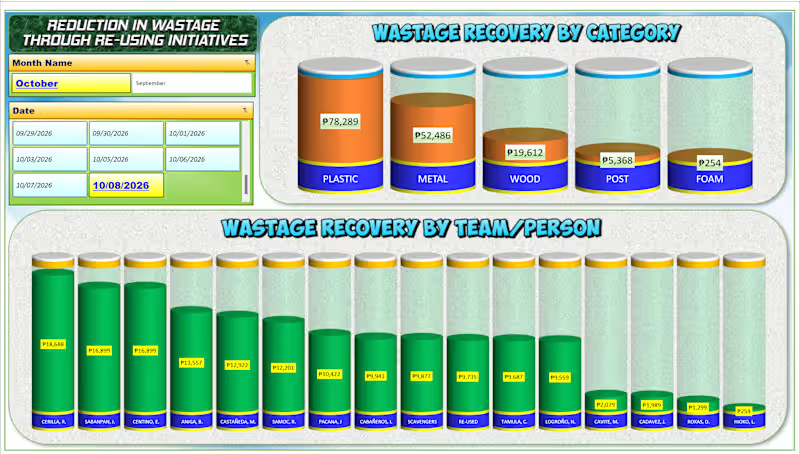
πŸš€ Project Spotlight: Upgrading Excel to an Executive Web-App UI πŸ“Šβœ¨ Most corporate reporting falls into two traps: it is either a dense, unreadable wall of numbers, or a pretty graphic that has to be manually redrawn every single week. I built this CL FY'2026 Market Performance Tracker to prove that you can achieve automated, heavy-duty backend engineering AND an immersive, software-like user experience entirely within native systems. Here is the exact 3-tier workflow behind this build: βš™οΈ Tier 1: The Automated Pipeline (Power Query) No manual data entry. No copy-pasting. Raw transactional data is fed directly into Power Query, which acts as the automated data-cleaning engine. With a single click, the query automatically shapes, cleans, and runs ETL processes on thousands of rolling rows, refreshing the dashboard in seconds. πŸ“Š Tier 2: The Core Logic Matrix (Dynamic Pivot Table & 3D Chart) β€’ The Grid: The transformed data consolidates seamlessly into a multi-period Pivot Table, mapping 15 distinct regional markets across an active 12-month calendar. It handles everything effortlessly, highlighting Market 5 as our heavy hitter with 2,936,685 in total volume. β€’ The Volumetric Display: The lower chart panel isn't a stagnant graphicβ€”it is a live, native 3D Pivot Chart configured into cylinder metrics. As new numbers hit the backend table, the liquid fill-levels automatically rise or drop in real time to show progress against a 6,299,300 Grand Total. 🎨 Tier 3: The Premium UI Skin (Photopea Enhancement) To lift the dashboard completely out of the standard "spreadsheet look," I engineered a high-fidelity background framework inside Photopea. Dropping the functional, live Excel components into this polished visual skin provides an immersive app environment, clean visual hierarchy, and polished title framing without compromising a single cell of live functionality. The Takeaway: Spreadsheets don't have to be boring to be powerful. By treating data architecture like a product, you give clients and executive teams instant clarity at a single glance. πŸ› οΈ Built with: Microsoft Excel (Power Query, Pivot Tables, 3D Charting) & Photopea (UI Layout Design).
0
21
Cover image for Replicating Complex Industrial Dashboards in
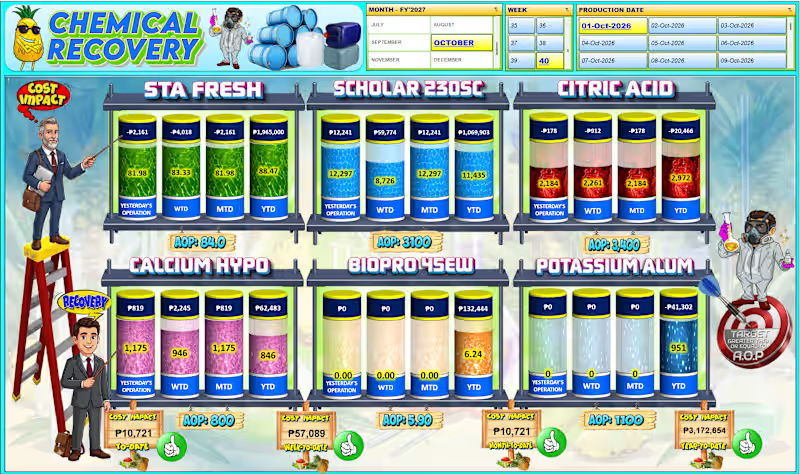
Replicating Complex Industrial Dashboards in Microsoft Excel πŸ› οΈ Check out this highly visual, gamified Chemical Recovery Performance Dashboard! It tracks multi-layered KPIs, rolling timelines, and budget variances across six different industrial chemical lines. While this specific interface uses a custom graphic skin, a dashboard with this exact level of complexity can be built entirely within Microsoft Excel using advanced data modeling and native features. If you are looking to build or optimize a tracking system like this, here is how we can replicate its core logic in Excel: πŸ“… Dynamic Time Slicing: Recreate the top control panel using Excel Slicers connected to a central Calendar Table. This allows users to filter the entire view by Month, Week Number, or a specific Production Date with a single click. πŸ“ˆ Rolling Timelines (Yesterday, WTD, MTD, YTD): Build out the top metric rows using dynamic SUMIFS or DAX formulas (Power Pivot) that automatically calculate data across moving operational windows based on your slicer selection. πŸ§ͺ Gauge & Cylinder Progress Charts: Replicate the fluid container visual by customizing Stacked Column Charts. By using custom shape overlays or image-fill data series, we can make the charts look like filling liquid tanks that change color based on target thresholds. πŸ’° Financial Variance & AOP Tracking: Link the bottom footer directly to variance calculation tables. This dynamically surfaces the Cost Impact To-Date and flags performance against the Annual Operating Plan (AOP) using conditional KPI indicators. Whether your data is in manufacturing, logistics, or finance, you don't need expensive proprietary software to get highly engaging, interactive visuals. If your team needs a clean, automated dashboard to monitor complex KPIs, let's connect! I can design tailored spreadsheet systems that turn raw operational data into actionable executive insights.
0
50
Talent Acquisition | HR Operations | Remote
9
Followers
Talent Acquisition | HR Operations | Remote
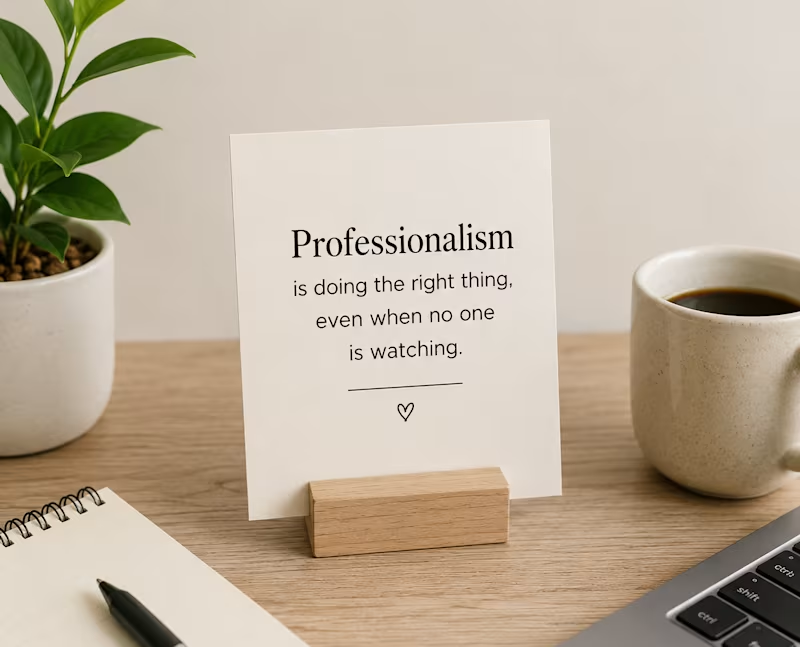
Cover image for You can tell a lot
You can tell a lot about a person by how they treat people they don’t need anything from. Professionalism isn’t only about how you speak to your boss, your client, or someone who can help your career. It also shows in how you treat the applicant who didn’t get the job. The new employee who is still learning. The colleague who made a mistake. The person who followed up twice because they were waiting for your response. And even the people you may never work with again. Because being respectful when there’s something to gain is easy. Character shows when there isn’t. As I gain more experience working with different people, I’m learning that professionalism and kindness don’t have to be separate. You can set boundaries and still be respectful. You can give honest feedback without making someone feel small. You can say β€œno” without being rude. And you can hold people accountable without forgetting that there’s still a human being on the other side of the conversation. At the end of the day, people may forget the exact words you said or the position you held. But they’ll remember what it was like working with you. Be professional, but never forget to be human. #Professionalism (https://www.linkedin.com/search/results/all/?keywords=%23professionalism&origin=HASH_TAG_FROM_FEED) #WorkplaceCulture (https://www.linkedin.com/search/results/all/?keywords=%23workplaceculture&origin=HASH_TAG_FROM_FEED) #Leadership (https://www.linkedin.com/search/results/all/?keywords=%23leadership&origin=HASH_TAG_FROM_FEED) #CareerGrowth (https://www.linkedin.com/search/results/all/?keywords=%23careergrowth&origin=HASH_TAG_FROM_FEED) #HumanResources (https://www.linkedin.com/search/results/all/?keywords=%23humanresources&origin=HASH_TAG_FROM_FEED) #KindnessAtWork (https://www.linkedin.com/search/results/all/?keywords=%23kindnessatwork&origin=HASH_TAG_FROM_FEED) #Connections (https://www.linkedin.com/search/results/all/?keywords=%23connections&origin=HASH_TAG_FROM_FEED)
0
91
Customer Success & CX Operations | SaaS & eCommerce

$10k+
Earned
2x
Hired
5.0
Rating
29
Followers
Customer Success & CX Operations | SaaS & eCommerce

ServiceNow ITOM Engineer | AI Automation
New to Contra
ServiceNow ITOM Engineer | AI Automation
Senior Market Research and Intelligence Analyst