The network for creativity
Join 1.25M professional creatives like you
Connect with clients, get discovered, and run your business 100% commission-free
Creatives on Contra have earned over $150M and we are just getting started
Back to feedPost

🚀 Project Spotlight: Upgrading Excel to an Executive Web-App UI 📊✨
Most corporate reporting falls into two traps: it is either a dense, unreadable wall of numbers, or a pretty graphic that has to be manually redrawn every single week.
I built this CL FY'2026 Market Performance Tracker to prove that you can achieve automated, heavy-duty backend engineering AND an immersive, software-like user experience entirely within native systems.
Here is the exact 3-tier workflow behind this build:
⚙️ Tier 1: The Automated Pipeline (Power Query)
No manual data entry. No copy-pasting. Raw transactional data is fed directly into Power Query, which acts as the automated data-cleaning engine. With a single click, the query automatically shapes, cleans, and runs ETL processes on thousands of rolling rows, refreshing the dashboard in seconds.
📊 Tier 2: The Core Logic Matrix (Dynamic Pivot Table & 3D Chart)
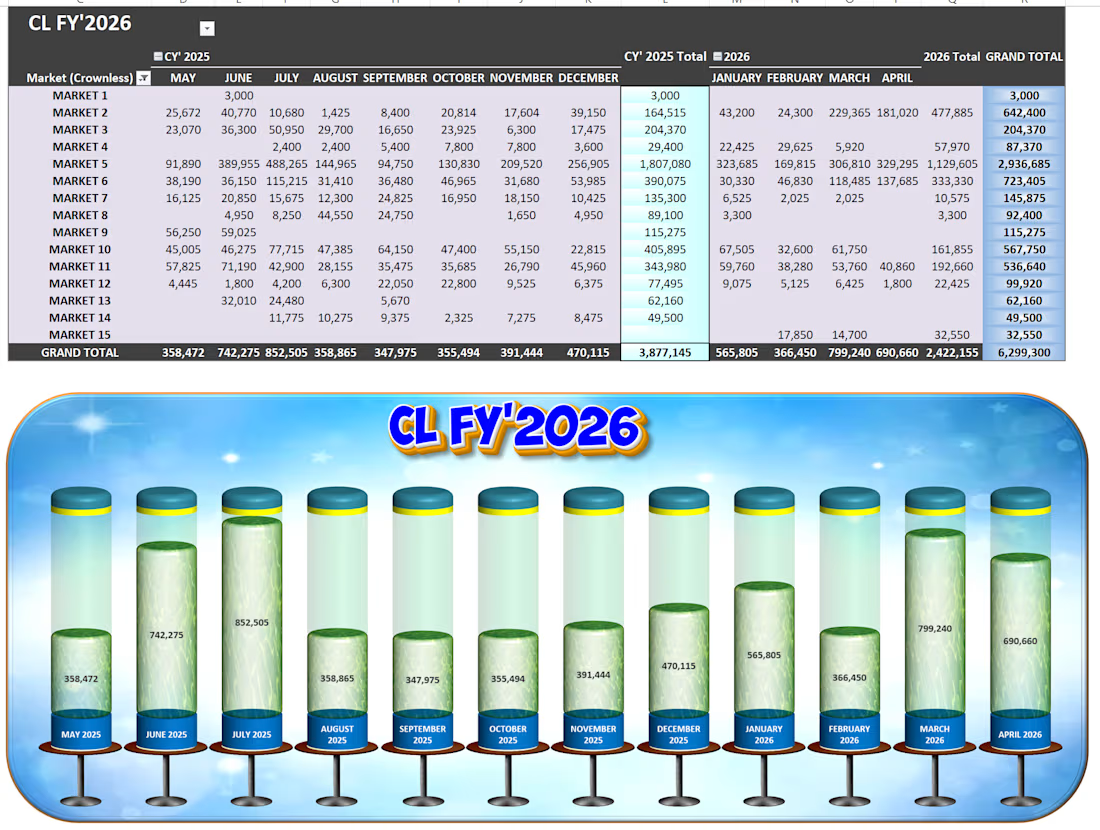
• The Grid: The transformed data consolidates seamlessly into a multi-period Pivot Table, mapping 15 distinct regional markets across an active 12-month calendar. It handles everything effortlessly, highlighting Market 5 as our heavy hitter with 2,936,685 in total volume.
• The Volumetric Display: The lower chart panel isn't a stagnant graphic—it is a live, native 3D Pivot Chart configured into cylinder metrics. As new numbers hit the backend table, the liquid fill-levels automatically rise or drop in real time to show progress against a 6,299,300 Grand Total.
🎨 Tier 3: The Premium UI Skin (Photopea Enhancement)
To lift the dashboard completely out of the standard "spreadsheet look," I engineered a high-fidelity background framework inside Photopea. Dropping the functional, live Excel components into this polished visual skin provides an immersive app environment, clean visual hierarchy, and polished title framing without compromising a single cell of live functionality.
The Takeaway: Spreadsheets don't have to be boring to be powerful. By treating data architecture like a product, you give clients and executive teams instant clarity at a single glance.
🛠️ Built with: Microsoft Excel (Power Query, Pivot Tables, 3D Charting) & Photopea (UI Layout Design).


The network for creativity
Join 1.25M professional creatives like you
Connect with clients, get discovered, and run your business 100% commission-free
Creatives on Contra have earned over $150M and we are just getting started
Challenges
View all


Related posts

MAE — Art Direction & Brand Visual Identity
A visual identity concept developed for MAE, built around the idea of “Controlled Energy — Movement in Contrast.” The direction explores the tension between individuality and constant movement, using a sharp central subject surrounded by blurred figures to create a strong visual narrative.
The Challenge
The goal was to create a visual language that felt distinctive, contemporary, and emotionally engaging without relying on excessive graphics or conventional branding. The challenge was to communicate movement and energy while keeping the brand feeling refined, minimal, and controlled.
The Solution
I developed an art direction centered around contrast — stillness vs. movement, focus vs. distraction, and individuality vs. the crowd.
The orange environment creates a bold visual signature, while the motion-blurred silhouettes represent the constant movement surrounding the individual. The sharply focused central figure becomes the visual anchor, communicating confidence, identity, and control.
The same visual language was then extended into the brand composition through minimal typography, logo placement, graphic symbols, and structured spacing, creating a system that can work across campaigns, social content, editorial layouts, and brand communications.
My Role
Art Direction · Brand Identity · Visual Concept · Graphic Design · Typography · Brand Composition
I was responsible for developing the visual concept, defining the art direction, establishing the graphic language, and translating the concept into a cohesive brand presentation.
Concept → Art Direction → Visual System → Brand Application
Logo DesignProduct DesignAdobe IllustratorAdobe PhotoshopAdobe Premiere ProBrand DesignVisual Designvisualidentity


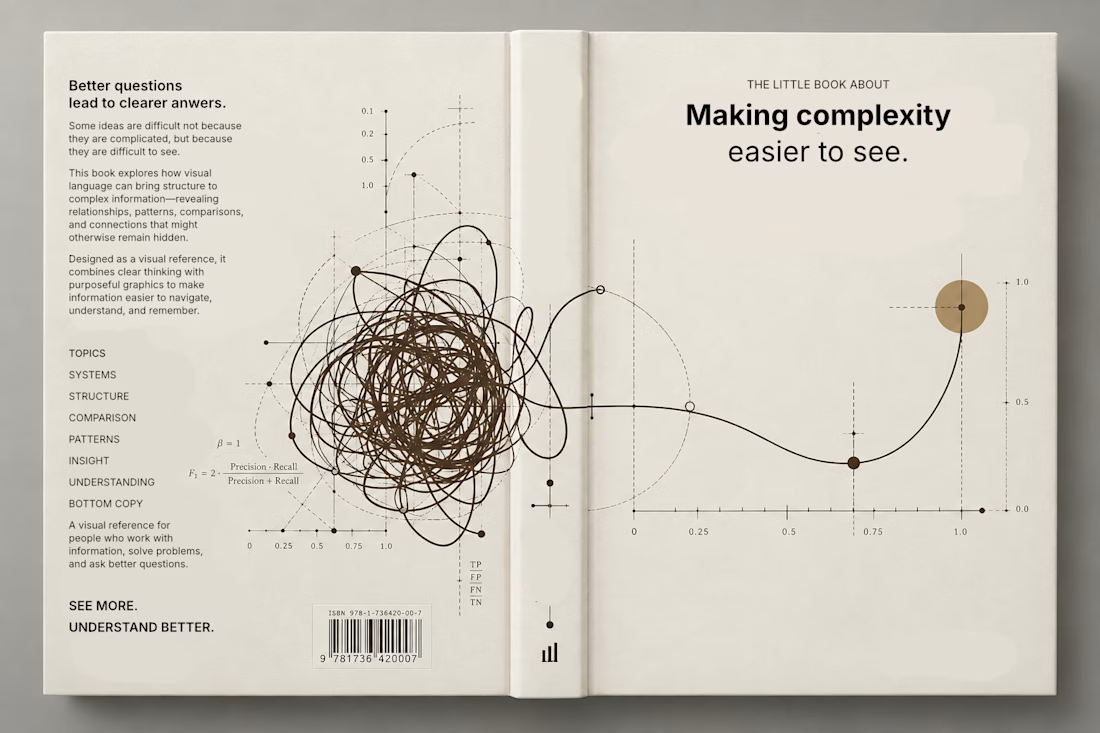
Currently exploring a book design focused on making complex information easier to understand through visual language. Playing with typography, data visualization, and graphic systems to give the subject a more editorial feel.

This is a trully elegant and impressive design concept.
I love it.

Concrete, walnut and marble: can a raw material palette still feel warm?
🏛️ Here's a new executive office visualization, 4 views, built around texture contrast and soft daylight. Full case study on my profile.
Planning a project that needs convincing visuals? Let's talk.


Amazing job, keep going! 😍✨