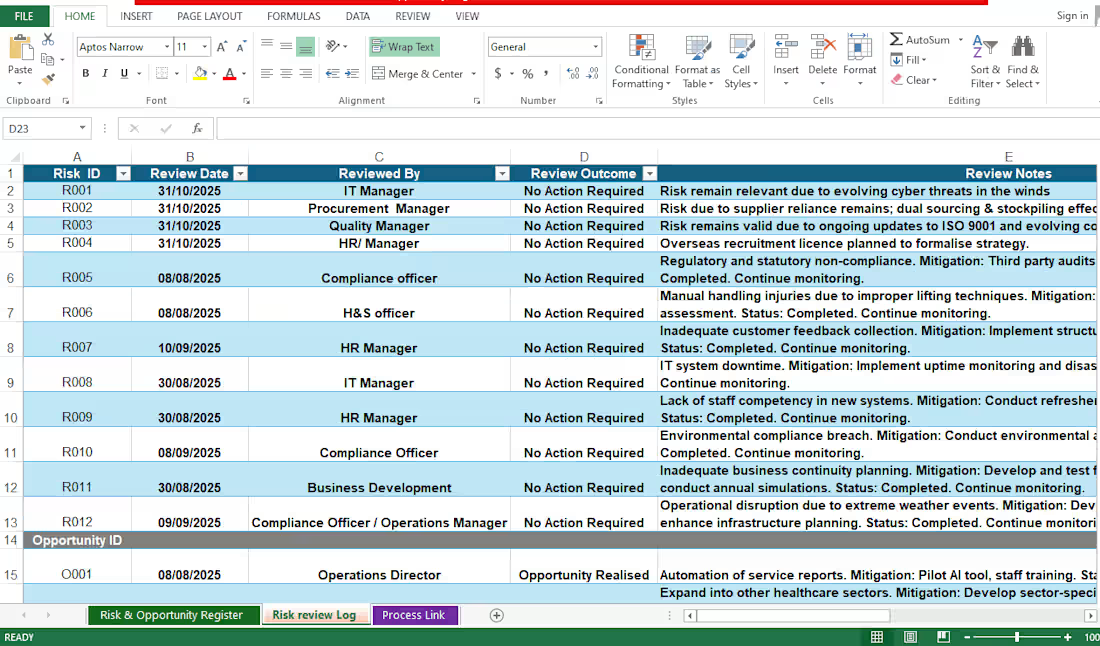
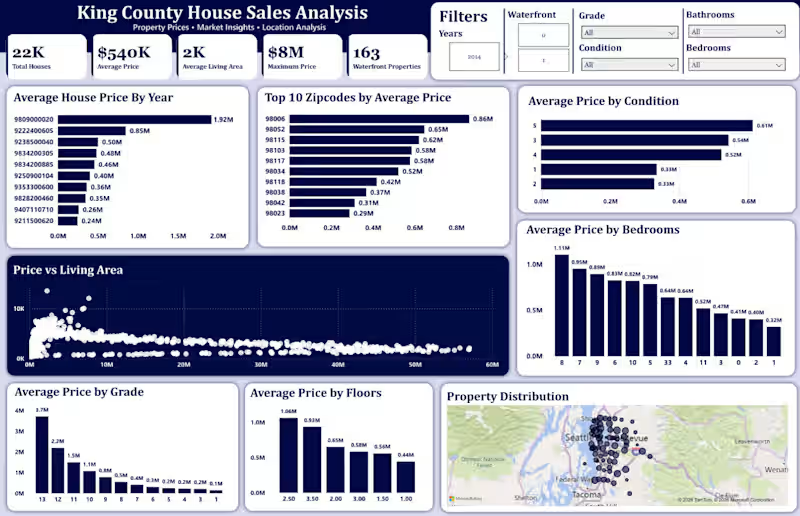
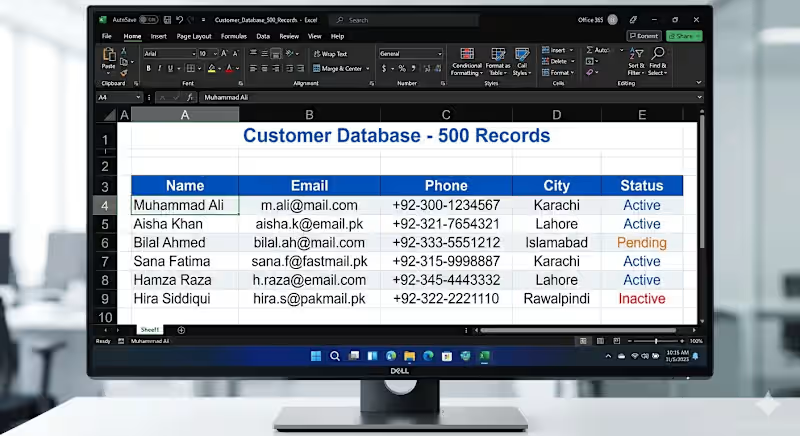
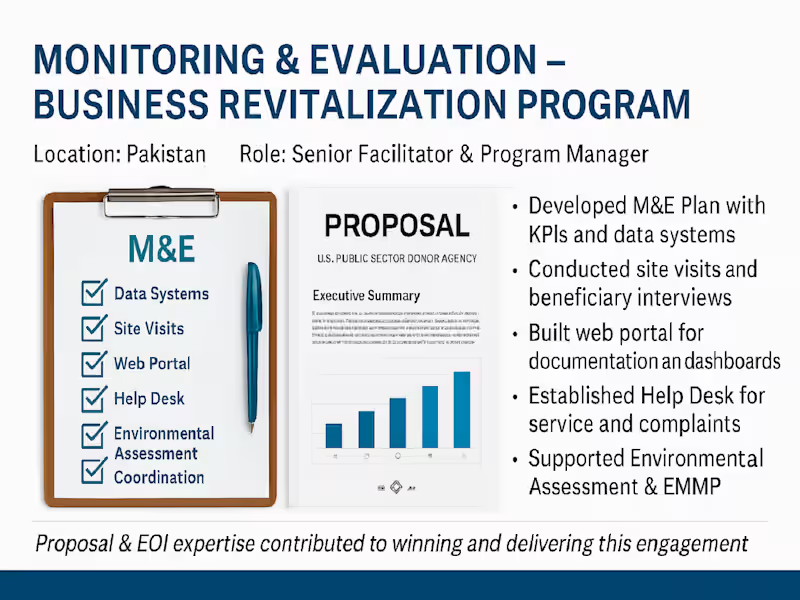
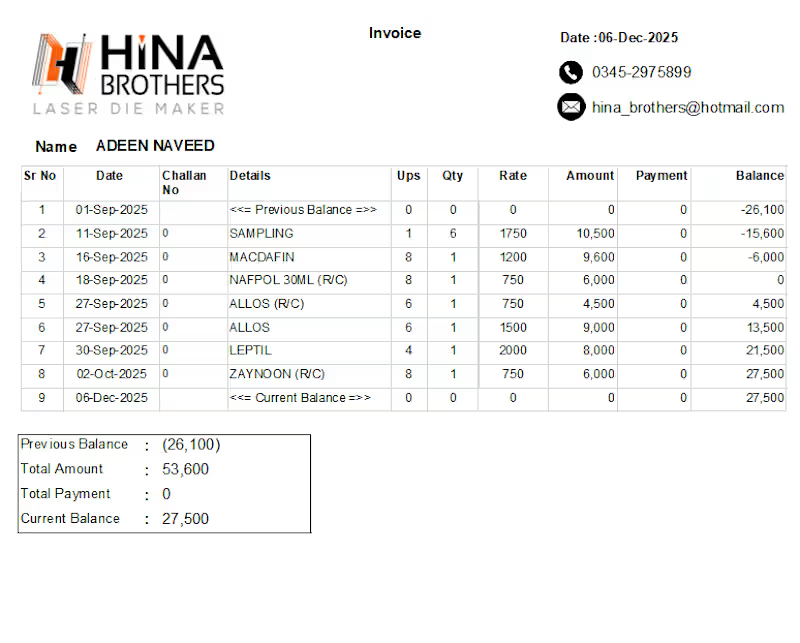
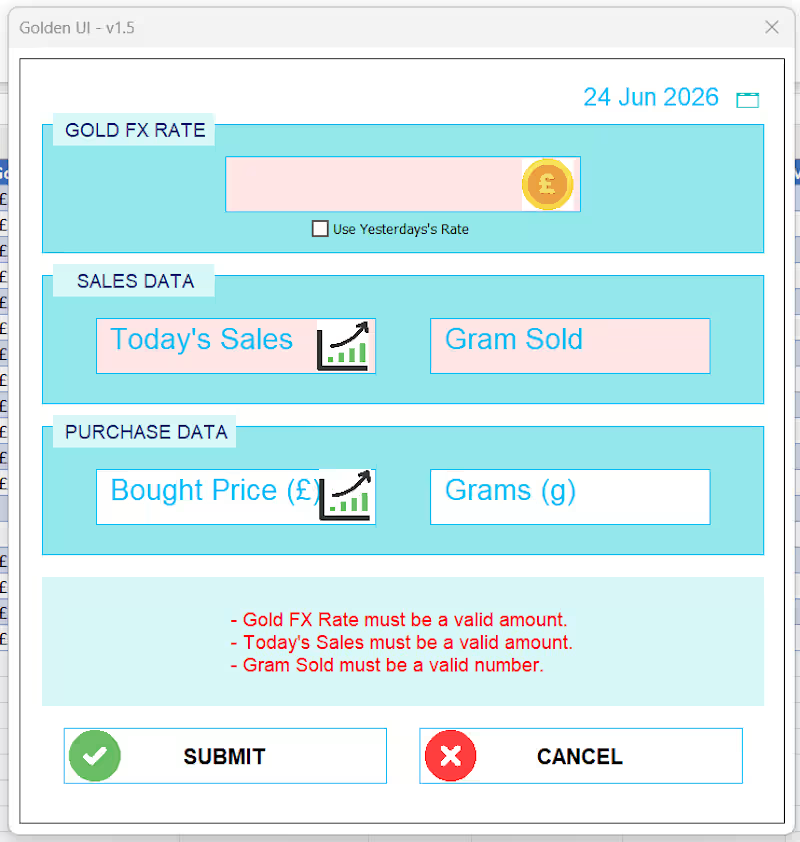
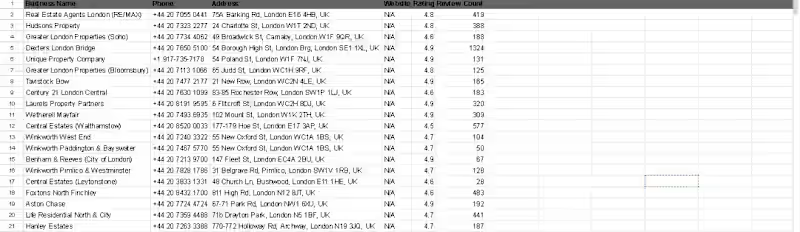
Projects using Microsoft Excel in SindhProjects using Microsoft Excel in SindhExpert in Excel & Google Sheets automation using VBA, Google Apps Script, formulas, macros, and APIs. I build automated workflows for data entry, reporting, calculations, dashboards, data processing, email notifications, imports/exports, and repetitive business tasks—turning manual spreadsheet processes into reliable, efficient solutions.
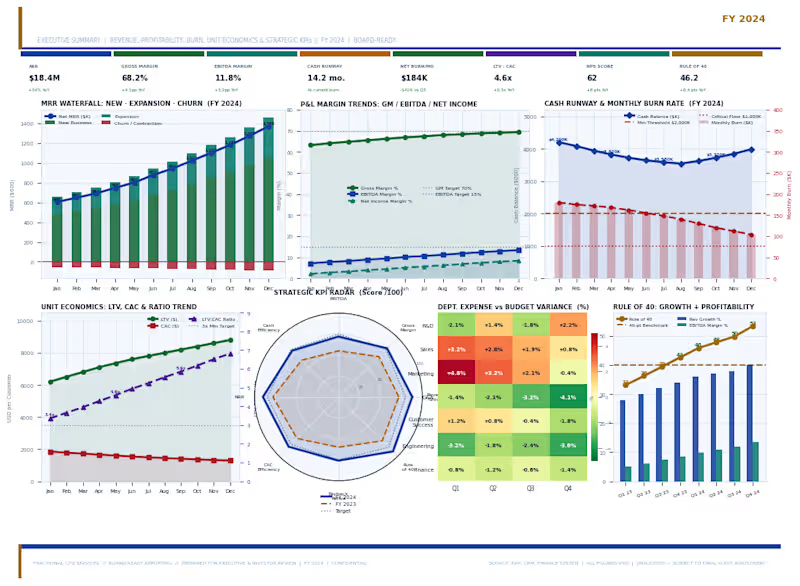
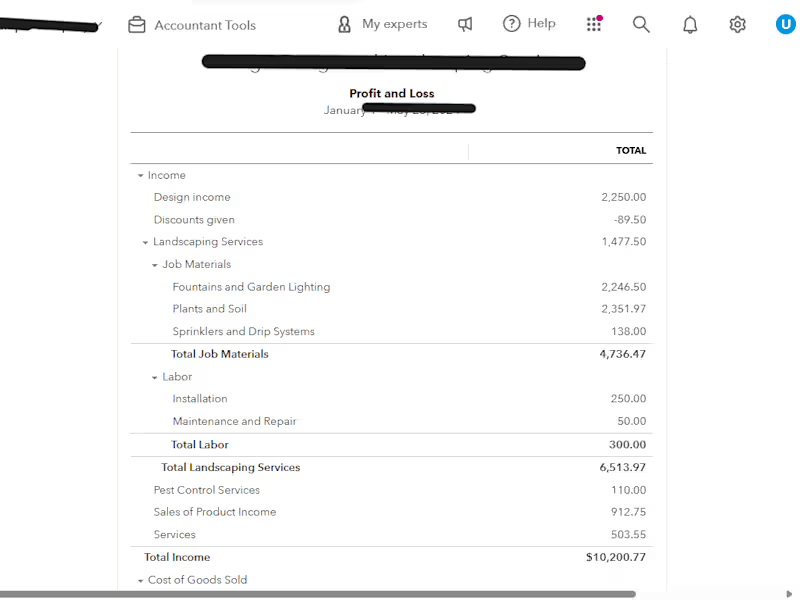
I provide institutional-grade CFO financial insights and KPI reporting solutions for startups, SMEs and growth-stage businesses. With 17+ years of Big Four advisory experience, I analyze financial statements, operational drivers and business performance metrics to create executive-level dashboards and decision-ready reports. Services include KPI architecture, variance analysis, profitability diagnostics, cash flow analytics, budgeting insights, revenue trend analysis, unit economics, margin optimization, burn-rate tracking and board-ready management reporting. Deliverables are built using Excel, Power BI or Google Sheets with scalable reporting structures, automated formulas and visual dashboards. My process includes financial data review, KPI mapping, analytical modeling, insight generation, scenario testing and executive reporting recommendations.
Why Work With Me?
17+ years of experience in finance, accounting & strategy across global markets
Expert in IFRS, US GAAP, and corporate reporting standards
Worked with Deloitte, Oman LNG, & leading financial consultancies
Delivered financial models & valuations for deals exceeding $100M Why ERP systems like SAP, Oracle, and Odoo won't save your business — and what will
After years in FMCG warehouse operations and now working as a freelance supply chain consultant, I keep seeing the same mistake in local industries across Pakistan.
Every business owner, every operations manager, every CEO believes the same thing:
"If we get SAP, everything will be fixed."
It won't. Here's why — and what actually will.
The misconception
ERP systems — SAP, Oracle, Odoo, Microsoft Dynamics — are seen as the solution to every operational problem. Inventory inaccurate? Get an ERP. Deliveries delayed? Get an ERP. Team making mistakes? Get an ERP.
But this thinking gets it completely backwards.
ERP systems are tools. Powerful ones. But they are only as good as the humans using them — and humans, trained or untrained, make mistakes every single day in every single company.
What I saw firsthand
I consulted with a company that had spent millions implementing SAP.
Six months after go-live, their inventory data was still wrong.
The reason? Nobody had agreed on what a "received" delivery actually meant.
Was it received when the truck arrived? When the goods were scanned? When they were inspected? When they were put away in the correct location?
No SOP. No definition. No standard.
Every operator decided for themselves. The ERP logged whatever they entered.
Garbage in. Garbage out.
SAP didn't cause the problem. The missing process did. SAP just made it faster and more expensive.
The truth about AI
Now everyone is talking about AI as the next fix.
AI will not save you either.
AI works on specific, structured, accurate knowledge. If your fundamentals are missing — if your SOPs don't exist, your processes aren't documented, your data isn't clean — AI has nothing meaningful to work with.
I've seen this firsthand too. A business tried to use AI-powered demand forecasting on inventory data that hadn't been accurately recorded for 18 months. The AI produced confident, detailed forecasts. Every single one was wrong — because the underlying data was wrong.
The AI wasn't the problem. The missing process was.
What actually holds a company together
The backbone of every thriving operation is not its software. It's its systems and fundamentals:
→ SOPs — documented, followed, and updated regularly
→ Work processes — clear steps that any trained team member can follow
→ SLAs — defined expectations between teams, suppliers, and customers
→ Data standards — everyone agrees on what "received", "dispatched", and "completed" actually mean
Get these right first.
Then your ERP becomes powerful — because it's recording accurate, consistent data.
Then your AI becomes useful — because it has clean data to learn from.
Then your team stops making the same mistakes every quarter — because there's a standard to follow.
The formula
Software is the amplifier. Your fundamentals are the signal.
If the signal is broken, no amplifier in the world will fix it.
What this means for your business
Before your next software investment, ask these questions:
Do we have documented SOPs for our core processes?
Does every team member know what "done" means for their task?
Are our SLAs defined and measured?
Is our data accurate enough to trust?
If the answer to any of these is no — fix that first. The software can wait.
Need help with this?
This is exactly what my Warehouse SOP Audit service covers. In 5 days I'll review your current processes, identify where your fundamentals are missing, and give you a prioritised action plan — before you spend another rupee on software.
👉 Book a discovery call or view my services below.
https://contra.com/tabish_khan_r5d8g4t1/services?r=tabish_khan_r5d8g4t1 Problem:
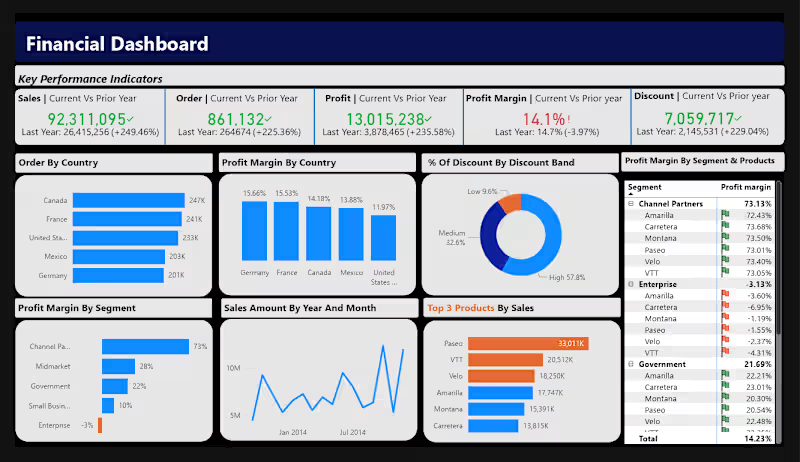
Finance data was difficult to analyze across sales, profit, orders, discounts, countries, and customer segments.
Solution:
Created an interactive Power BI dashboard with KPI cards, sales trends, profit analysis, country performance, and segment-level insights.
Tools:
Power BI, Power Query, DAX, Excel, Data Modeling
Result:
Delivered a clear executive dashboard for tracking financial performance, identifying trends, and making faster business decisions.