The network for creativity
Join 1.25M professional creatives like you
Connect with clients, get discovered, and run your business 100% commission-free
Creatives on Contra have earned over $150M and we are just getting started
Back to feedPost
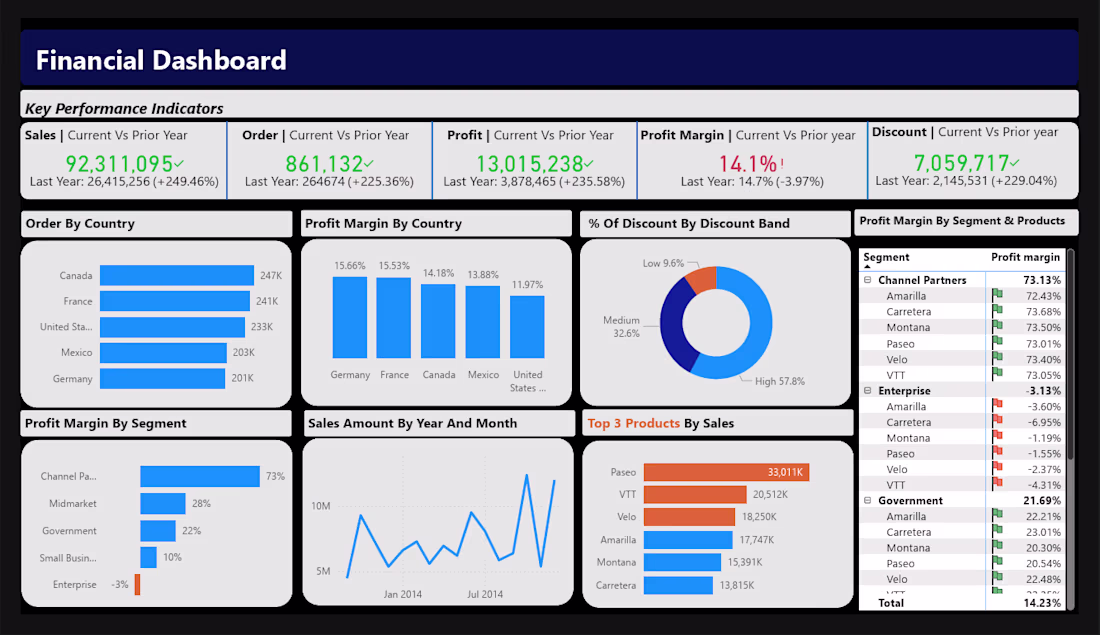
Problem:
Finance data was difficult to analyze across sales, profit, orders, discounts, countries, and customer segments.
Solution:
Created an interactive Power BI dashboard with KPI cards, sales trends, profit analysis, country performance, and segment-level insights.
Tools:
Power BI, Power Query, DAX, Excel, Data Modeling
Result:
Delivered a clear executive dashboard for tracking financial performance, identifying trends, and making faster business decisions.
The network for creativity
Join 1.25M professional creatives like you
Connect with clients, get discovered, and run your business 100% commission-free
Creatives on Contra have earned over $150M and we are just getting started
Related posts
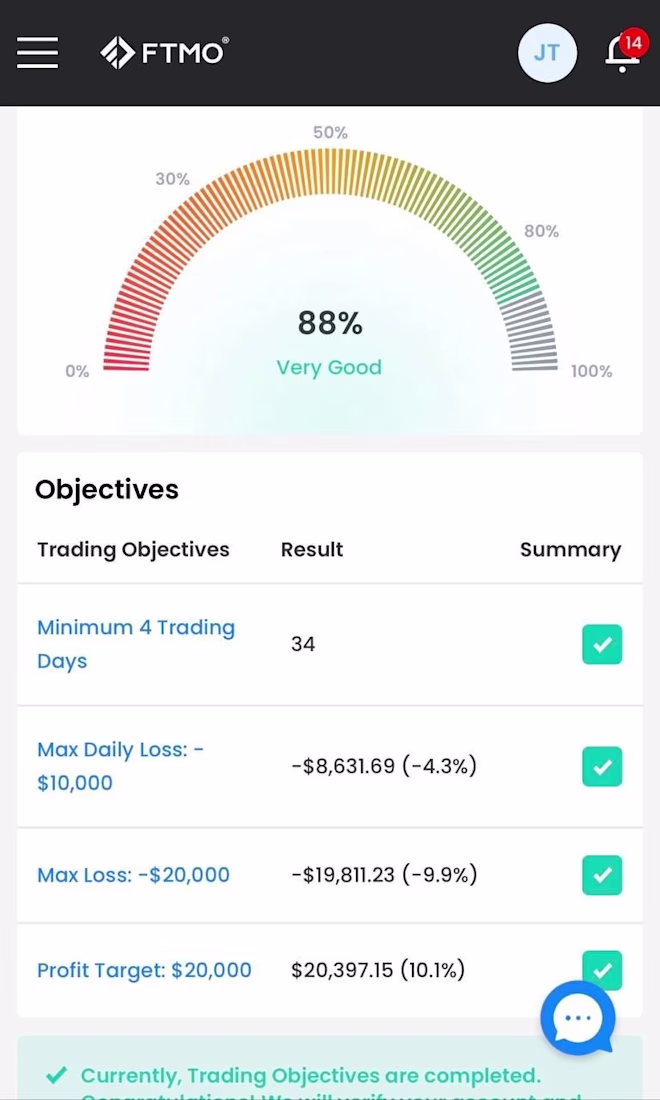
FTMO $200K Challenge Passed | Prop Firm EA Recovery
Description
The client came to me with an FTMO $200K Challenge account that was already 9% into drawdown. I adjusted and optimized the trading bot to better manage risk and improve execution. The account recovered and successfully passed Phase 1.
What I did:
Optimized the Expert Advisor
Improved risk management
Fine-tuned trade entries and exits
Reduced unnecessary trades
Made the EA more stable for prop firm rules
If you need help building, fixing, or optimizing an MT4/MT5 EA for prop firms like FTMO, feel free to get in touch.
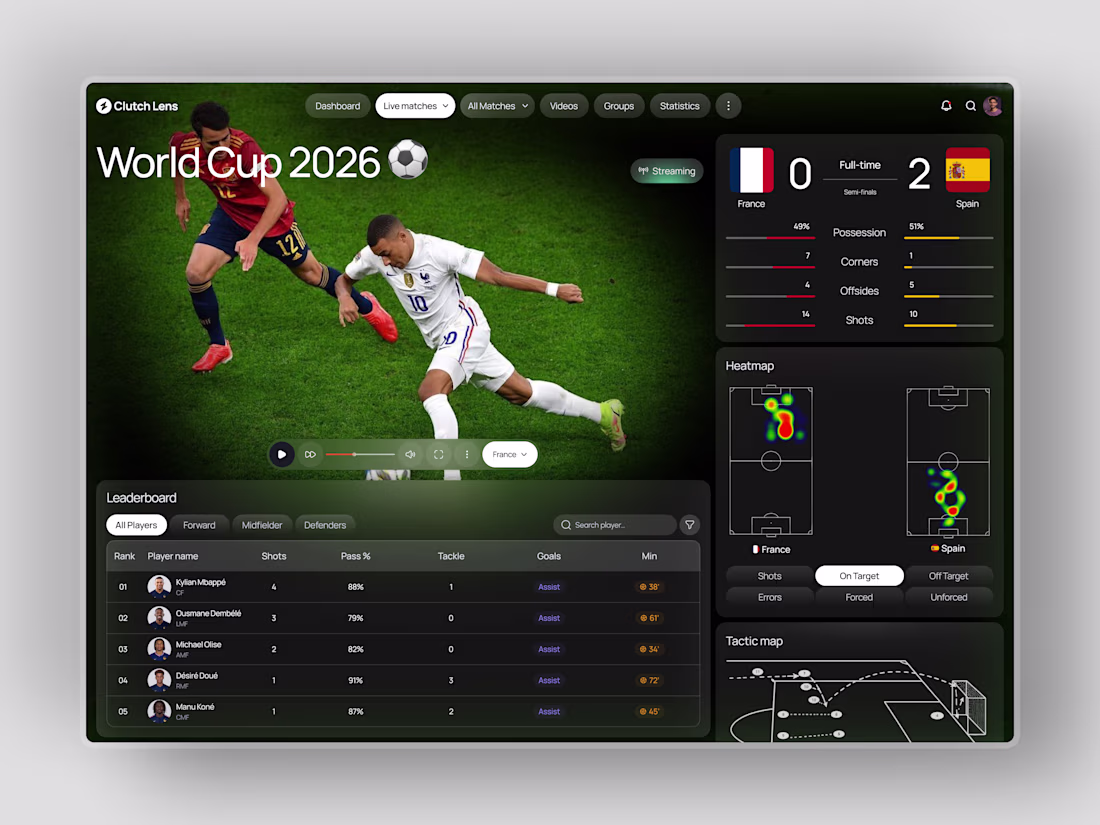
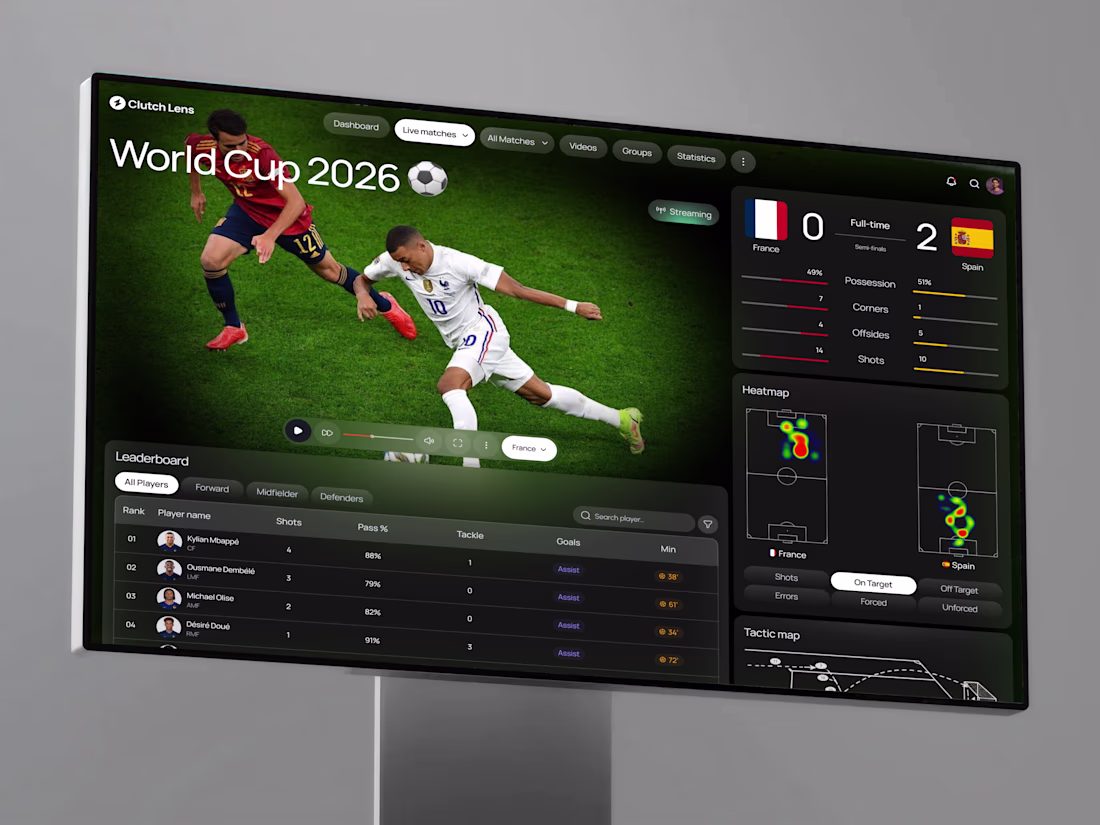
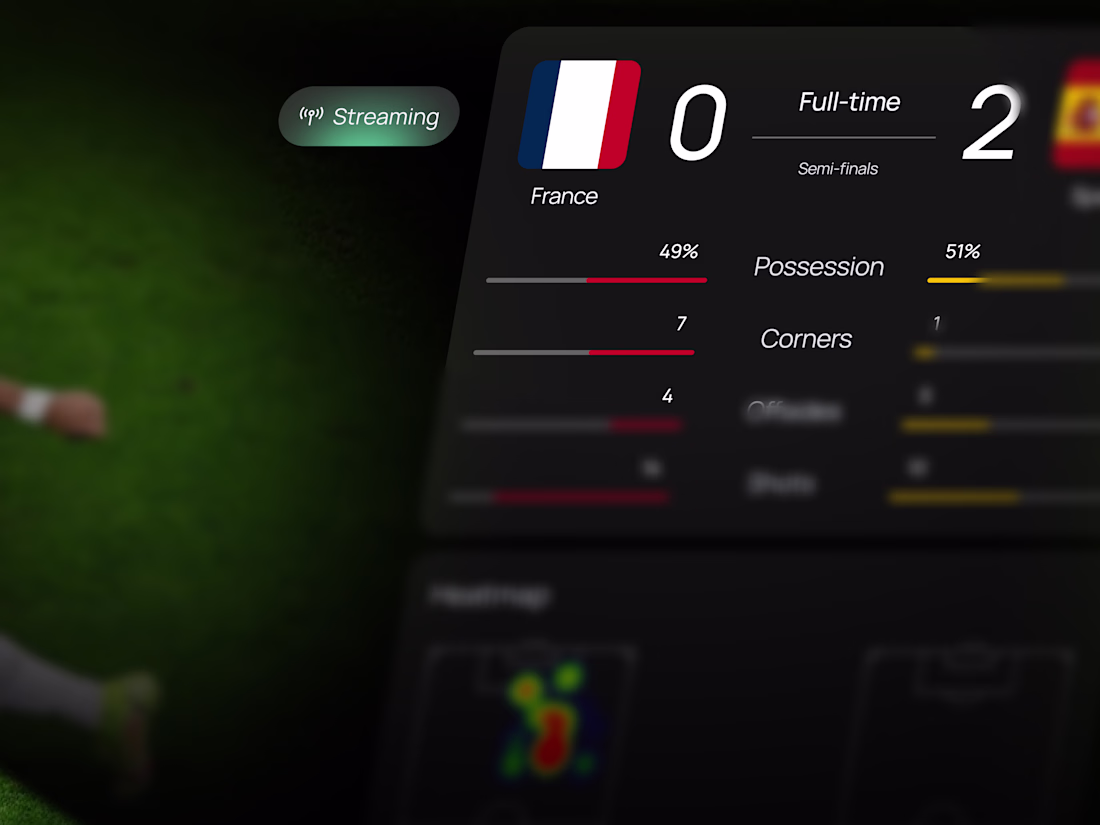
Live football data has always existed. A dashboard that makes it feel this immediate hasn't.
Clutch Lens brings the entire match into one screen: live streaming, real-time scoreboard, possession and shot stats, dual team heatmaps, player leaderboard, and a tactic map that shows exactly how the game is being played, not just who's winning it.
France 0 VS Spain 2. Semi-finals. World Cup 2026. Every number that matters, right where it should be.
Dark. Live. Built for the football obsessed.
Designing a sports analytics platform that needs to feel this considered? Let's build it together.
Tools: Figma
#SportsUI #DashboardDesign #FIFA2026 #WorldCup2026 #UIDesign #DarkUI #ContraFreelance
Amazing design
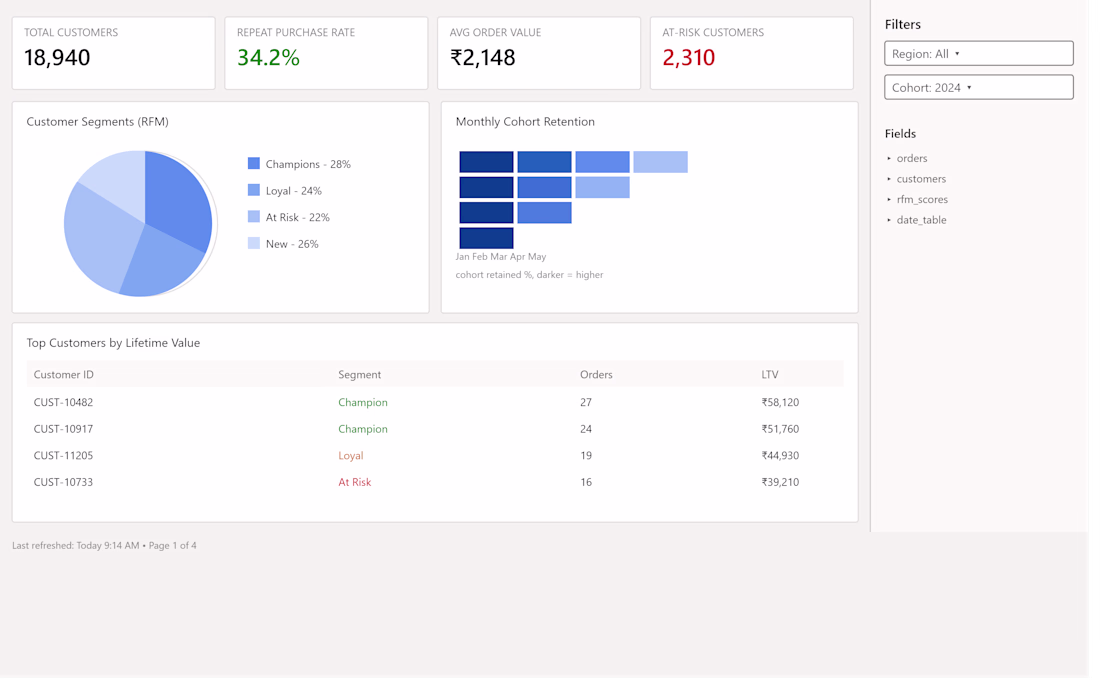
Built this one for an e-commerce customer behavior project - 18,000+ customers, segmented using RFM (Recency, Frequency, Monetary) analysis.
The interesting part wasn't the segmentation itself, it was what it revealed: nearly 22% of customers were "at risk" of churning, and most businesses wouldn't know that until those customers had already stopped buying.
This is the kind of insight that's usually sitting in your order data already, it just needs the right lens. Happy to take a look at your numbers if you're curious what's hiding in yours.
Tools used: Power BI, SQL, Python (Pandas, Scikit-learn for clustering)
Trending
Claude
Claude has entered the design space. How are you using Claude Design?
Contra University
Learn from expert creatives how to earn more using next-gen AI tools.
creativeaiflow
Creative AI workflows are evolving. What tools do you use, and what are their strengths and weaknesses?
freelancerlife
Freelancer life is wins, pivots, and everything in between. What’s yours right now?