The network for creativity
Join 1.25M professional creatives like you
Connect with clients, get discovered, and run your business 100% commission-free
Creatives on Contra have earned over $150M and we are just getting started
Back to feedPost

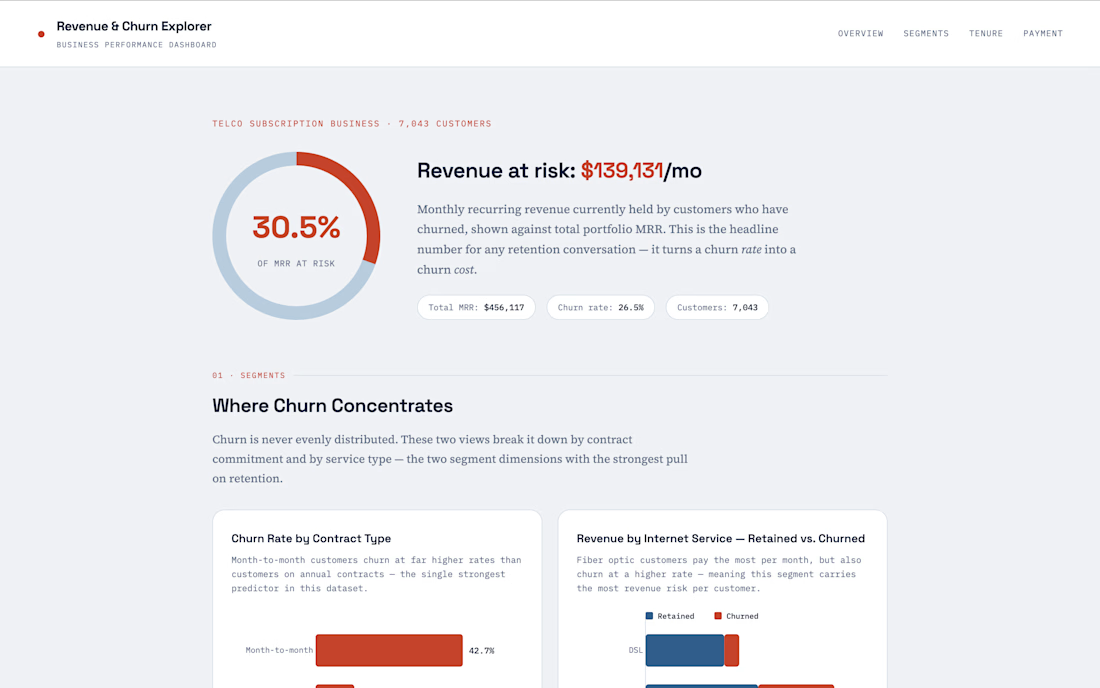
An interactive D3.js dashboard analyzing revenue, churn, and customer segments for a telecom subscription business (7,043 real customers). Calculates "Revenue at Risk" turning a churn rate into a churn cost and finds that contract type is the strongest churn predictor (42.7% for month-to-month vs. 2.8% for two-year contracts), while payment method is a surprisingly strong signal on its own: electronic check users churn at 45.3%, nearly 3x automatic payment methods.


The network for creativity
Join 1.25M professional creatives like you
Connect with clients, get discovered, and run your business 100% commission-free
Creatives on Contra have earned over $150M and we are just getting started
Trending

Claude
Claude has entered the design space. How are you using it?

Contra University
Learn from expert creatives how to earn more using next-gen AI tools.
Brand Design
The best brand designers are on Contra. Scroll to see what's trending in brand design. What are you building?
creativeaiflow
Creative AI workflows are evolving. What tools do you use, and what are their strengths and weaknesses?
freelancerlife
Freelancer life is wins, pivots, and everything in between. What’s yours right now?
Related posts

Spent the weekend cleaning out my camera roll. Somewhere in there I noticed something I'd swiped past a thousand times, that subtle parallax shift when you move between photos.
So I rebuilt it for the web.
- Spring physics, no animation library
- Rubber band effect at the edges
- Full keyboard navigation
- Screen reader support
Didn't want to just leave it as a demo. If you can't use a mouse, it still works. If you can't see it, it tells you what photo you're on.


Love that you didn't stop at making it look good. Accessibility is what makes it complete.

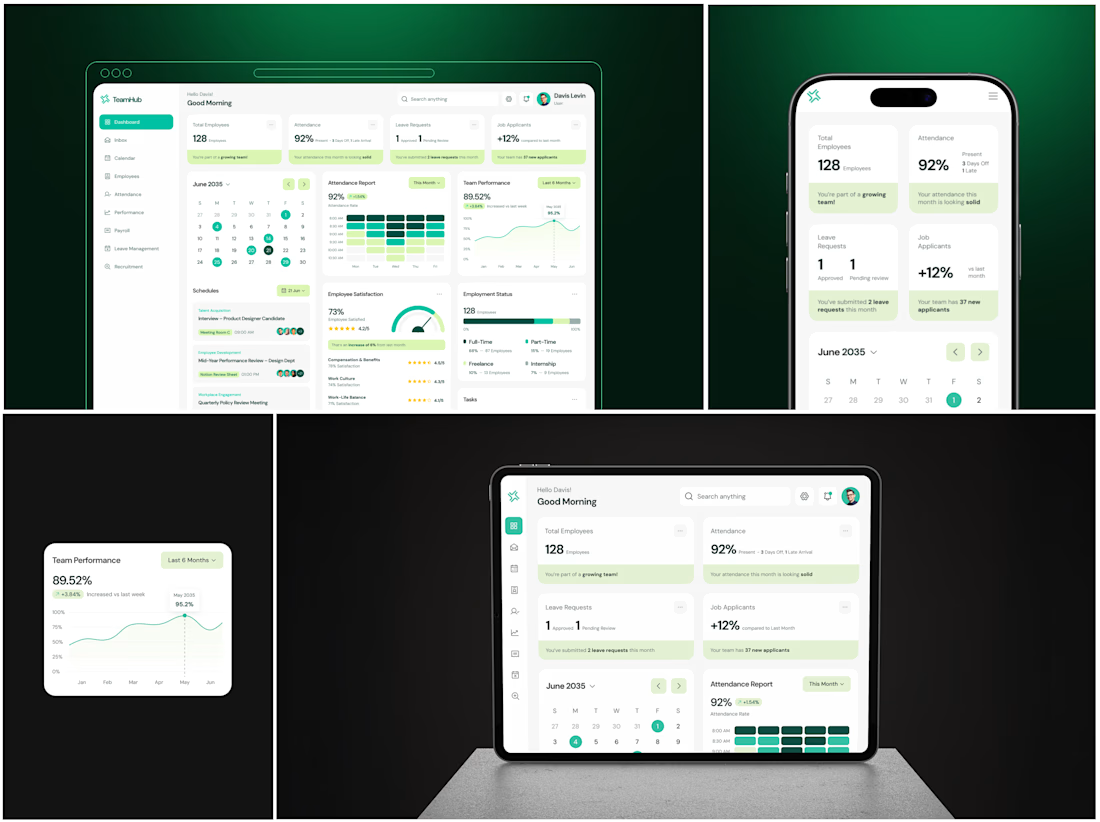
🚀 Just published my latest HR Management Platform case study.
A modern SaaS dashboard focused on employee management, attendance, performance tracking, and HR analytics.
Feedback is always welcome!


Introducing ELVN Revenue Knowledge Graph — an evidence layer for industrial revenue operations
Industrial companies rarely have a shortage of data.
The real problem is fragmentation.
Product demand lives in the catalog. RFQs arrive through websites and inboxes. Supplier evidence sits in sourcing workflows. Quotes move through CRM or documents. Orders, invoices, payments, and margin belong to operational and financial systems.
ELVN Revenue Knowledge Graph connects these records into one explainable commercial chain:
Product → RFQ → Supplier → Quote → Order → Payment → Margin
The module works as a reproducible projection above existing systems. It does not replace the CRM, ERP, catalog, finance platform, or Revenue Operations workflow that owns each record.
Every relationship carries provenance. Product identity uses Manufacturer + exact MPN. Financial facts require currency and observation time. AI is optional, disabled by default, and separated from verified commercial evidence.
Operational capabilities include:
• Quote Control Tower
• RFQ-to-revenue attribution
• Supplier-response intelligence
• Product and MPN demand analysis
• Margin explanation
• Catalog-enrichment prioritization
• Account and opportunity timelines
• Reconciliation and exception investigation
• Tenant isolation and role-based access
• Optional human-reviewed AI recommendations
The result is more than another analytics dashboard: teams can understand what happened, why it happened, which evidence supports the conclusion, and what action should happen next.
Available through selected Design Partner and private implementation engagements.
Typical one-time ranges:
• Readiness assessment: $5,000–$15,000
• Design Partner pilot: $20,000–$50,000
• Business implementation: $50,000–$150,000
• Enterprise program: $150,000–$500,000+
Hosting, maintenance, support, and optional model usage are scoped separately.
Explore the product:
studio.elvn.monster
ELVN Revenue Knowledge Graph
Know why revenue happened.