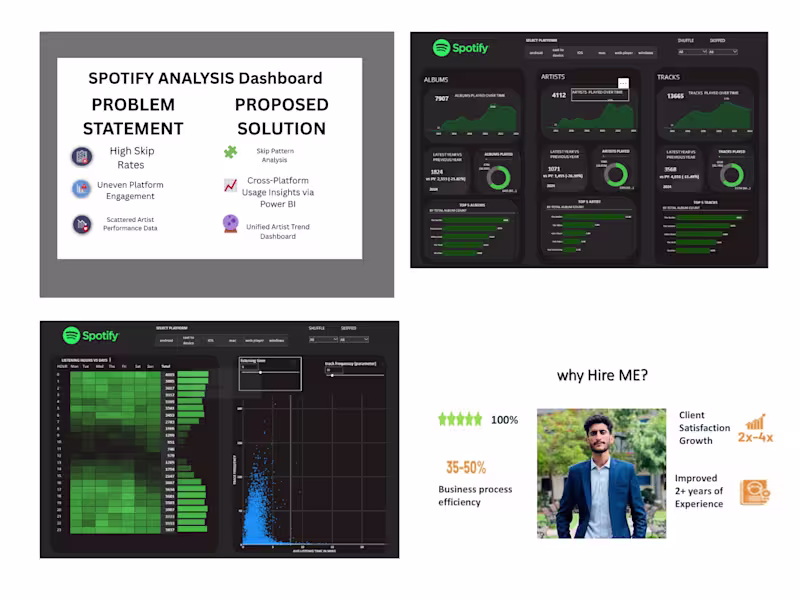
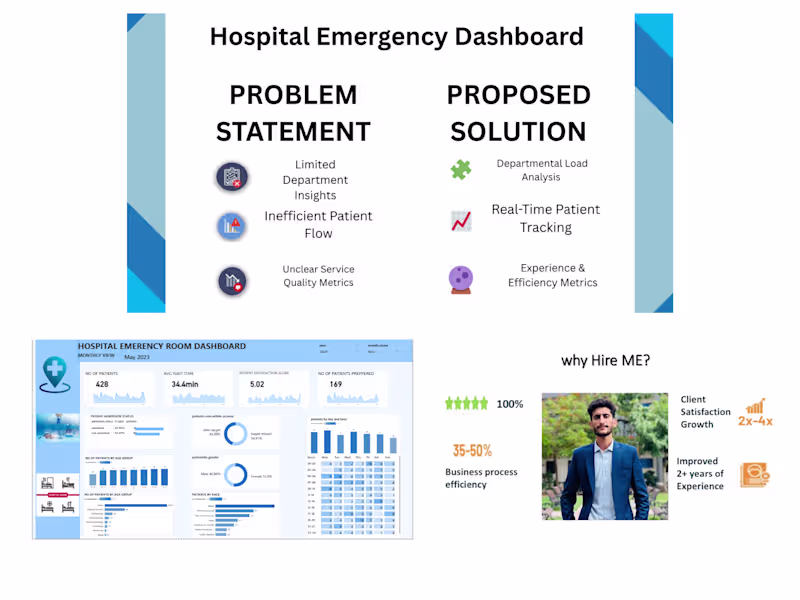
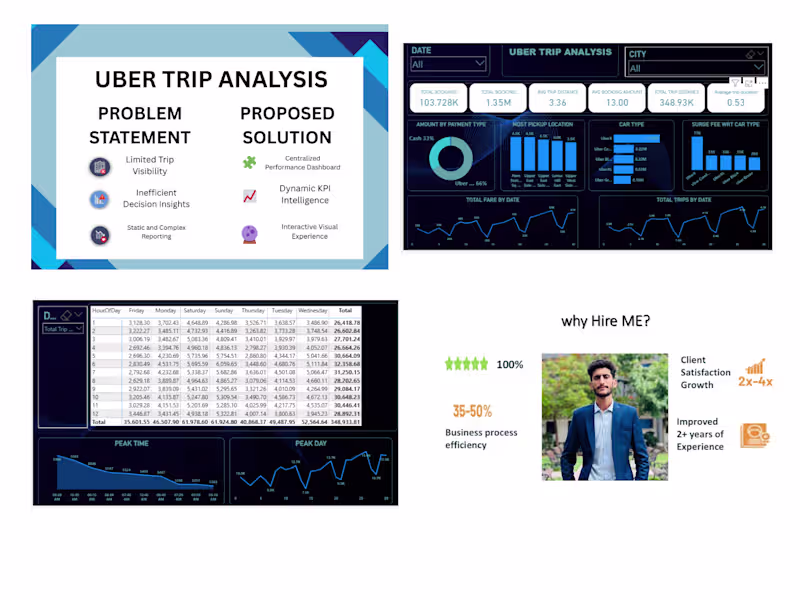
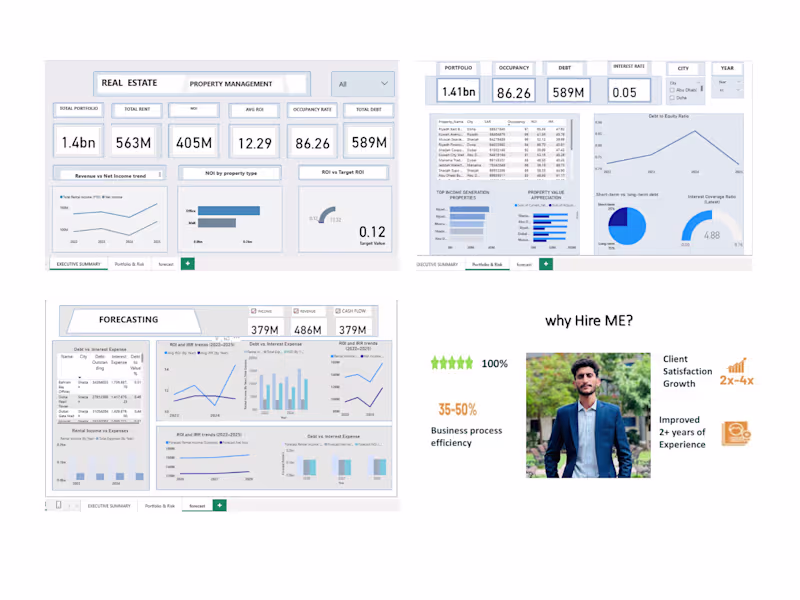
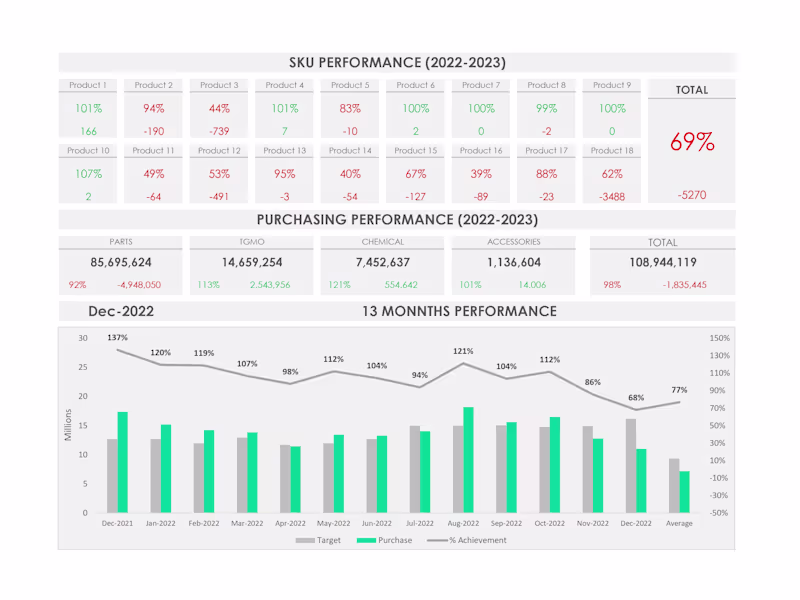
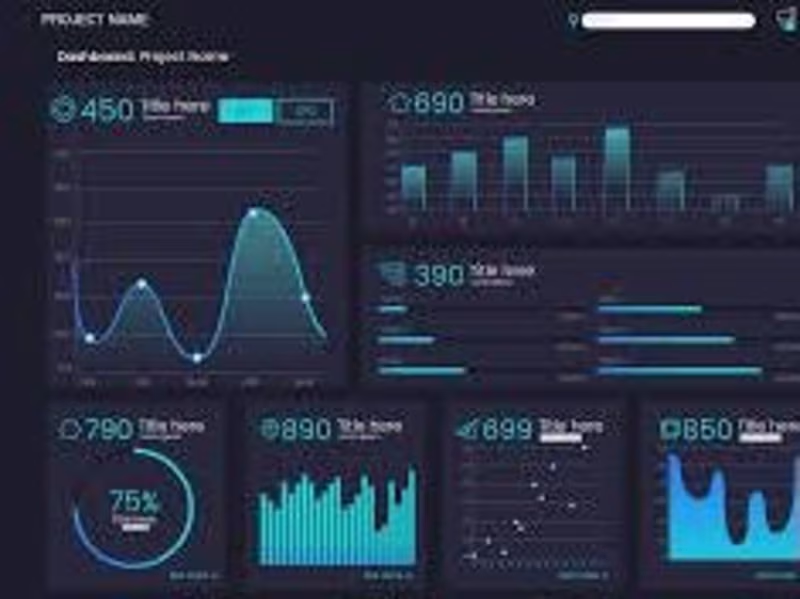
Data Analysis & Visualization | Power BI Specialist
Data Analysis & Visualization | Power BI Specialist
Data Scientist providing actionable insights
Data Scientist providing actionable insights
View more →
Google Sheets | Apps Script | Google Ads Script Professional
Google Sheets | Apps Script | Google Ads Script Professional
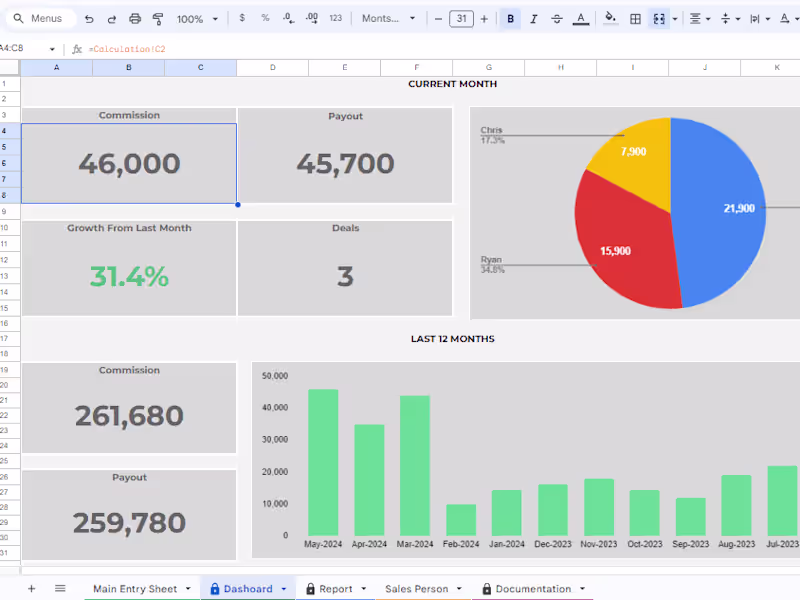
Automating Workflows: Your Data Science Partner
Automating Workflows: Your Data Science Partner
Turning complex data into actionable insights
Turning complex data into actionable insights


View more →
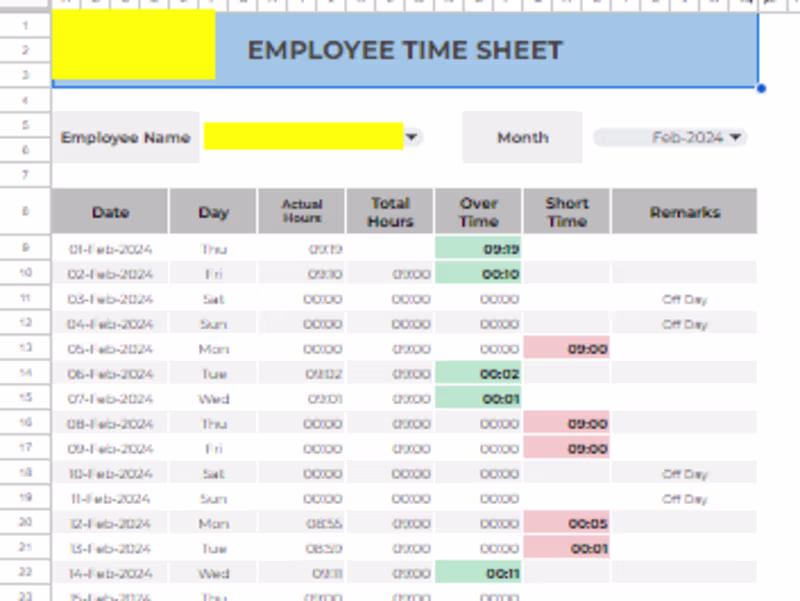
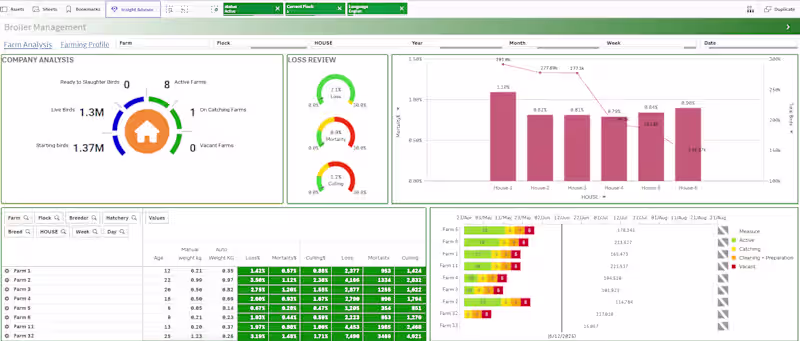
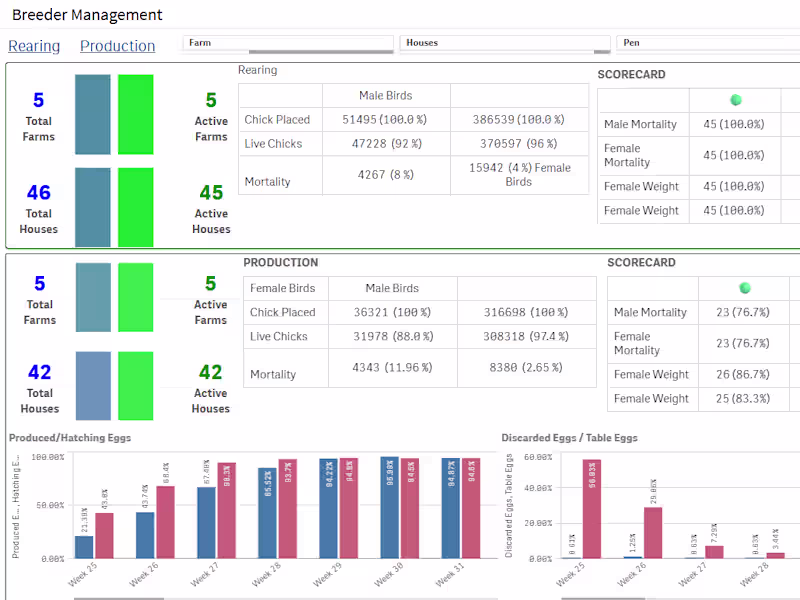
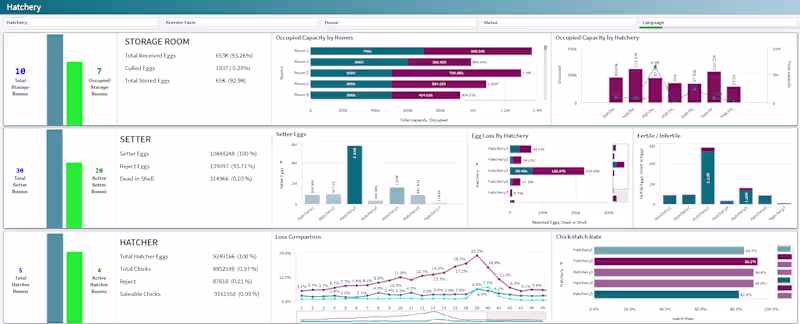
Transforming complex data into clear, strategic insights.
Transforming complex data into clear, strategic insights.

View more →
Creative WEB3 Artist | Visualizer | UI Designer


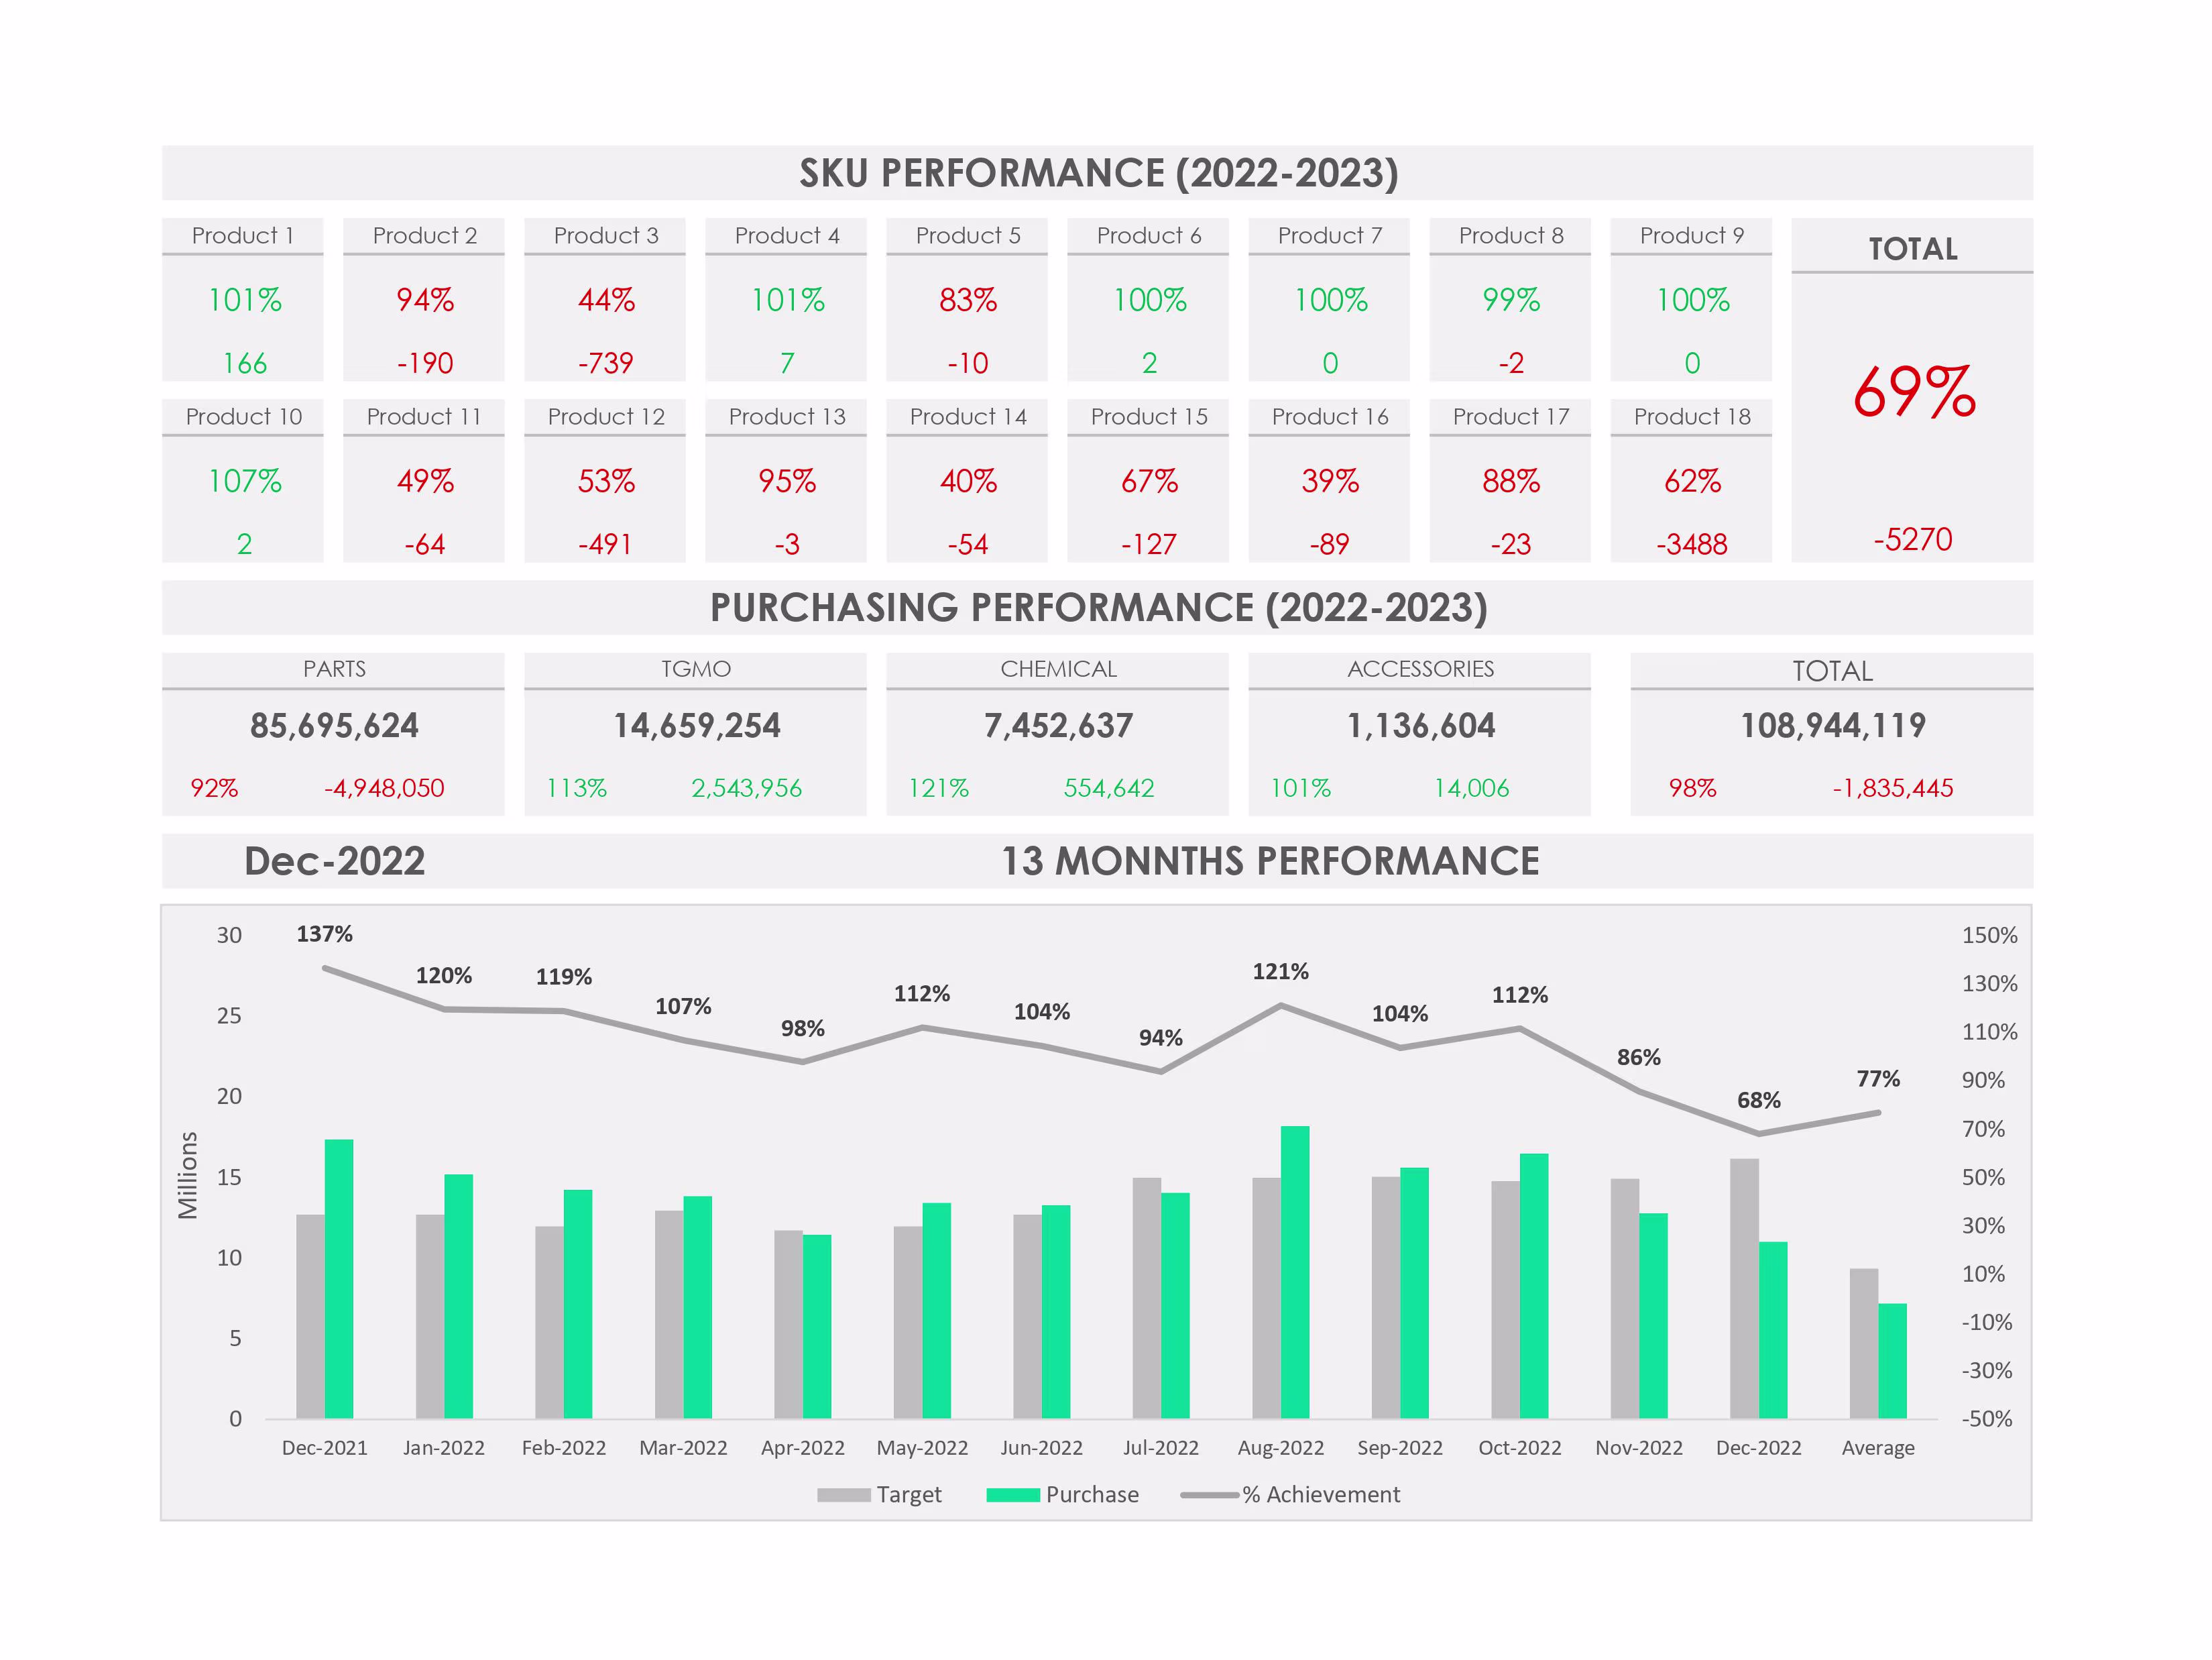
Data Analyst | Power BI, SQL, Python | From data to decision
Data Analyst | Power BI, SQL, Python | From data to decision