Data Analysis Projects in SindhData Analysis Projects in SindhProblem:
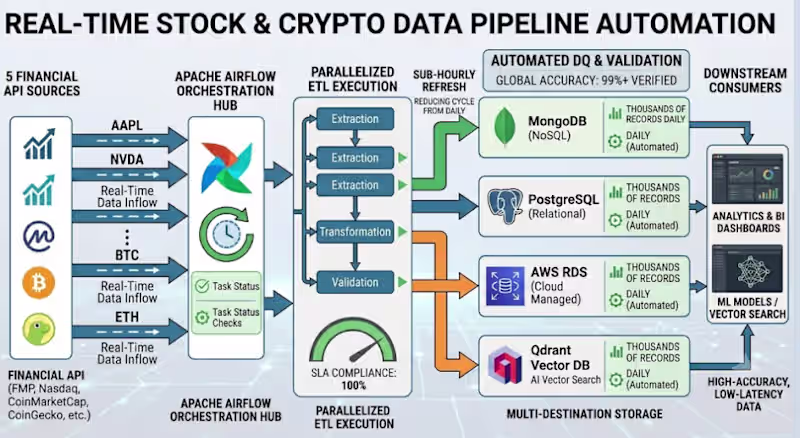
Financial data from stocks and crypto APIs was scattered, refreshed manually, and not ready for analytics or ML use.
Solution:
Built an Apache Airflow pipeline to collect, transform, validate, and load real-time financial data from multiple APIs into PostgreSQL, MongoDB, AWS RDS, and Qdrant.
Tools:
Apache Airflow, Python, PostgreSQL, MongoDB, AWS RDS, Qdrant, APIs
Result:
Automated sub-hourly data refresh, processed thousands of records daily, and delivered clean data for dashboards, analytics, and vector search. Stop Managing Files. Start Managing Your Growth.
Do you own your data, or does your data own you?
Most businesses I work with share the same frustration: "I know I saved that file, but I have no idea where it is."
Recently, I audited a massive 180GB+ ecosystem spread across four different Google Drives—Personal, Business, Rentals, and Property Inspections. It was a digital labyrinth of duplicates, mismatched names, and fragmented folders.
The transformation?
In just 3 days, we moved from 180GB of digital noise to a streamlined, multi-tier architecture where every file is exactly two clicks away.
Why does this matter?
Organization isn't just about "cleaning up"; it’s about mental bandwidth. When your operations are structured:
You stop wasting 20% of your day searching for documents.
Your team syncs effortlessly across devices.
Your business is ready to scale without the clutter.
I specialize in turning digital chaos into high-efficiency systems—whether it’s Cloud Storage Architecture, B2B Lead Databases, or Operational Workflows.
If your Google Drive or Dropbox feels like a junk drawer, let's fix that.
Drop a "System" in the comments if you’re ready to reclaim your storage (and your time)!
#DigitalOrganization #Operations #Efficiency #CloudStorage #WorkflowOptimization #SystemsBuilding Spotify Analysis Dashboard
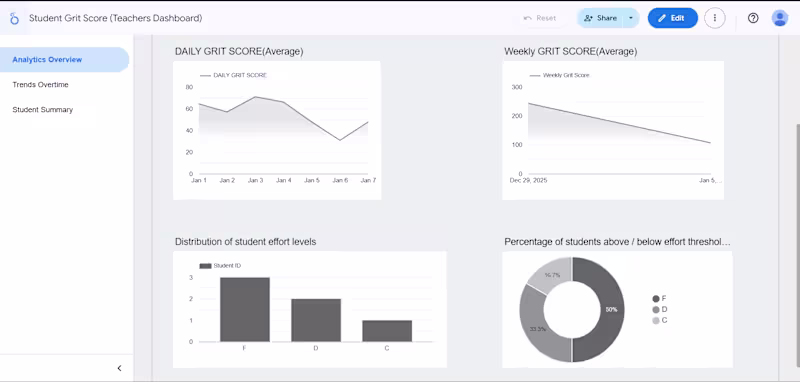
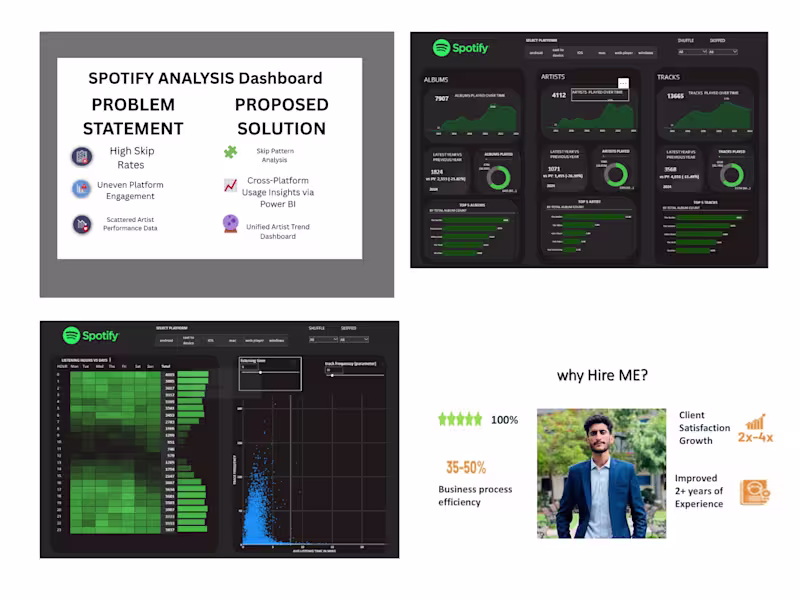
Turned raw Spotify streaming data into a clear, interactive dashboard that reveals how listeners actually engage with music.
Built in Power BI using SQL and DAX, this project explores user behavior across devices, identifies skip patterns, and highlights top-performing artists and tracks.
With dynamic visuals powered by key metrics like reason_start, reason_end, platform, and ms_played, the dashboard uncovers:
• Why users skip songs or stop playback
• Which platforms drive the most engagement
• Which artists and albums perform best by time and device
Perfect for music analysts, record labels, or streaming teams who want actionable insights into listener habits and engagement trends.