Freelancers using Python in Pune
Sign Up
Post a job
Sign Up
Log In
Filters
2
Projects
People
Sunny Mehta
Pune, India
Data Analyst & BI Dev | Dashboards, SQL, Python & ETL
New to Contra
Follow
Message
Data Analyst & BI Dev | Dashboards, SQL, Python & ETL
0
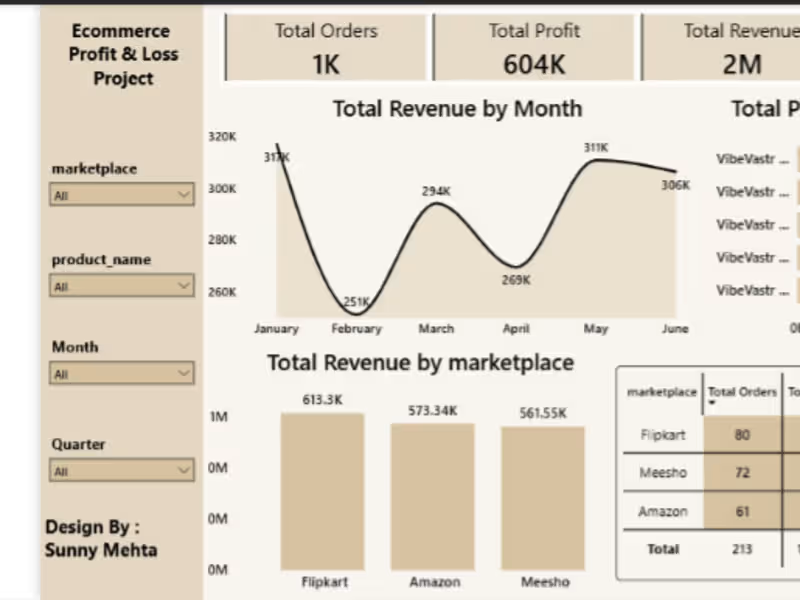
Marketplace Profitability & P&L Engine Overview This project is an end-to-end E-commerce Marketplace Analytics solution built using MySQL, SQL, Power BI, and Excel. The objective of this project is to analyze marketplace profitability across multiple sales channels by calculating revenue, product costs, marketplace commissions, shipping expenses, and net profit. The project simulates a real-world marketplace operations environment where business teams need visibility into product performance, marketplace profitability, and operational KPIs. Business Problem E-commerce businesses often track revenue but fail to understand true profitability. This project helps answer key business questions: Which marketplace generates the highest profit? Which products are most profitable? How do commissions impact margins? What is the overall profit margin? How does shipping cost affect profitability? Tech Stack MySQL SQL Power BI Microsoft Excel Data Sources Products Contains SKU-level product information. Fields: SKU Product Name Category Cost Price Selling Price Orders Contains marketplace order transactions. Fields: Order ID Order Date Marketplace SKU Quantity Marketplace Charges Marketplace commission structure. Fields: Marketplace Commission Percentage Shipping Cost Shipping cost by marketplace. Fields: Marketplace Shipping Cost Returns Order return information. Fields: Order ID Return Status SQL Implementation The project uses multiple SQL tables and joins to create a unified profitability dataset. Key SQL Concepts Used: CREATE TABLE INNER JOIN SQL Views Aggregations Calculated Metrics A consolidated analytical view was created: vw_marketplace_pnl This view combines all business logic and serves as the primary source for Power BI reporting. Profitability Metrics Revenue Revenue = Quantity × Selling Price Product Cost Product Cost = Quantity × Cost Price Commission Cost Commission Cost = Revenue × Marketplace Commission % Shipping Cost Shipping Cost = Quantity × Shipping Cost Profit Profit = Revenue − Product Cost − Commission Cost − Shipping Cost Profit Margin % Profit Margin % = Profit / Revenue Power BI Dashboard Executive Summary KPIs: Total Revenue Total Profit Total Orders Profit Margin % Marketplace Analysis Revenue by Marketplace Profit by Marketplace Marketplace Performance Comparison Product Analysis Top Profitable Products Product Revenue Analysis Product Profitability Ranking Trend Analysis Revenue Trend Profit Trend Order Trend Project Architecture Excel → MySQL → SQL View → Power BI Dashboard Key Outcomes Built a scalable marketplace profitability model. Centralized business logic using SQL Views. Automated profitability calculations. Delivered interactive executive dashboards for decision-making. Simulated a real-world marketplace operations analytics workflow. Skills Demonstrated SQL Data Modeling Business Intelligence Power BI E-commerce Analytics Marketplace Operations Profitability Analysis Data Visualization Author Sunny Mehta Open to opportunities in: E-commerce Operations Marketplace Management Business Analytics Operations Analytics Data Analytics
0
15
3
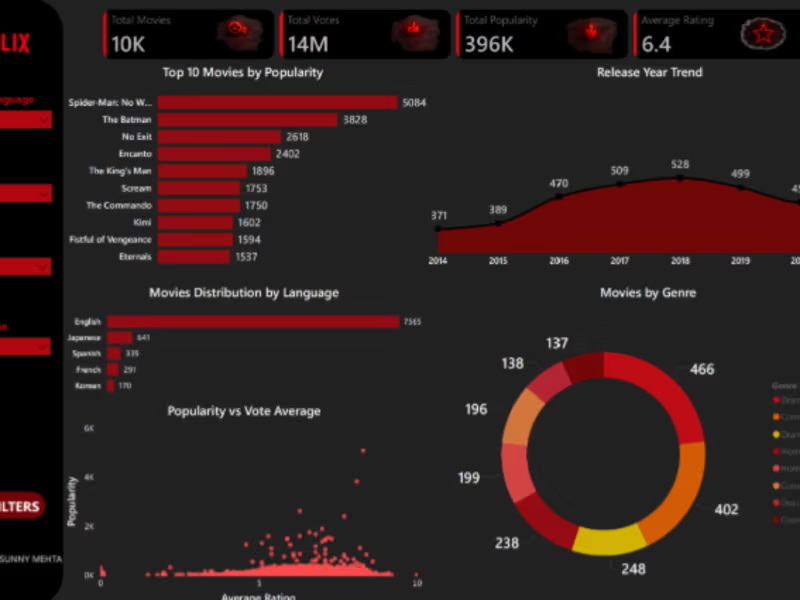
Netflix Movies Analysis Dashboard using Power BI Project Overview Interactive Power BI dashboard analyzing Netflix movie trends, popularity, ratings, genres, and language distribution. KPIs Total Movies Total Votes Total Popularity Average Rating Dashboard Features Top 10 Movies by Popularity Release Year Trend Movies Distribution by Language Genre Analysis Popularity vs Vote Average Tools Used Power BI Power Query DAX Data Modeling
3
79
1
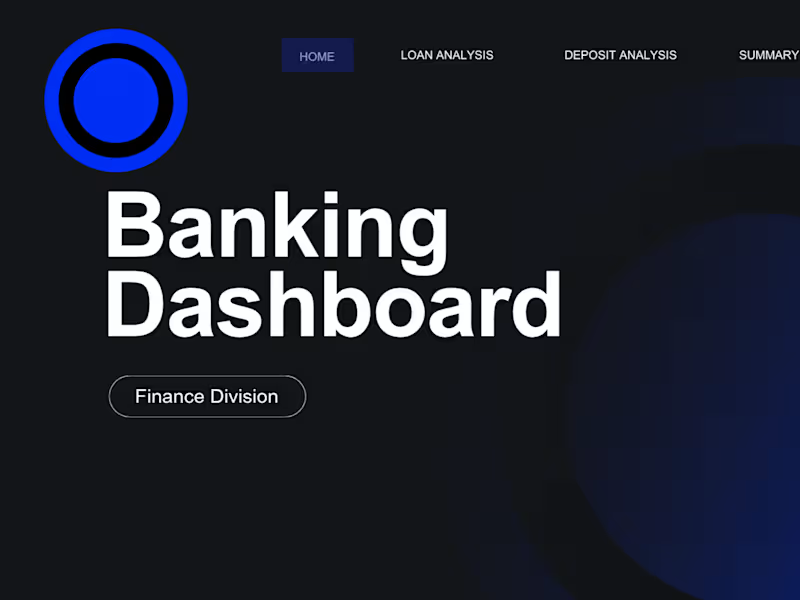
Banking Data Analysis Dashboard Develop a basic understanding of risk analytics in banking and financial services and understand how data is used to minimise the risk of losing money while lending to customers Solution – With our dashboards which are created using Power BI latest tools helps the company to make a decision based on the applicant’s profile like if the applicant is likely to repay the loan then approving the loan otherwise not. About Dataset – This dataset basically contains information about bank details ,various client details which consists of multiple tables which are interlinked with each other through keys like primary key and foreign key. The various tables are Banking Relationship, Client-Banking, Gender, Investment Advisor and Period. KPI’S: In which followings KPIS are present : Total Clients : Total Clients KPI represents total number of clients in banking. Total Clients = DISTINCTCOUNT('Clients - Banking'[Client ID] ) Total Loan : Total Loan gives you information about the bank loan + Business lending + credit cards balance of particular investor , gender. Total Loan = [Bank Loan] + [Business Lending] + [Credit Cards Balance] Bank Loan : Bank Loan gives you information what is the loan amount of loan to be repaid by the client to bank. Bank Loan = SUM('Clients - Banking'[Bank Loans] ) Business Lending : Business lending gives you information about the loan amount given to small business. Business Lending = SUM('Clients - Banking'[Business Lending] ) Total Deposit Total Deposit gives you information about the amount deposited by particular investors in bank Total Deposit = [Bank Deposit] + [Savings Account] + [Foreign Currency Account] + [Checking Accounts] Total Fees : Total Fees is nothing but the amount charged by the bank for account set-up , maintenance charges etc. Total Fees = SUMX('Clients - Banking' , [Total Loan] * 'Clients - Banking'[Processing Fees] ) Bank Deposit : Bank deposit is the money put in the bank. Bank Deposit = SUM('Clients - Banking'[Bank Deposits] ) Checking Account Amount : Checking account amount is nothing but which offers easy access to your money for daily transactional needs. Checking Accounts = SUM('Clients - Banking'[Checking Accounts] ) Total CC Amount : Total CC Amount is a short-term source of financing for a company by a bank. Total CC Amount = SUM('Clients - Banking'[Amount of Credit Cards] ) Saving Account Amount : A savings account is an interest-bearing deposit account held at a bank. Savings Account = SUM('Clients - Banking'[Saving Accounts] ) Foreign Currency Amount : Foreign Currency Account means an account held in a currency that is not the currency of India or Bhutan or Nepal. Foreign Currency Account = SUM('Clients - Banking'[Foreign Currency Account] ) Engagement Account : Engagement Banking is nothing but puts the customer at the center and aims to deliver the digital experiences they expect. Engagment Length = SUM('Clients - Banking'[Engagment Days]) Credit Cards Balance : It is the total amount of money currently owned by a cardholder to their credit card bank. Credit Cards Balance = SUM('Clients - Banking'[Credit Card Balance] ) 📊 Tools Used Excel (Data Cleaning) SQL (Data Processing) Python (EDA) Power BI (Dashboard) 📈 Key Insights Private banks dominate loan distribution European segment shows highest deposits Low-income customers have high loan dependency
1
47
1
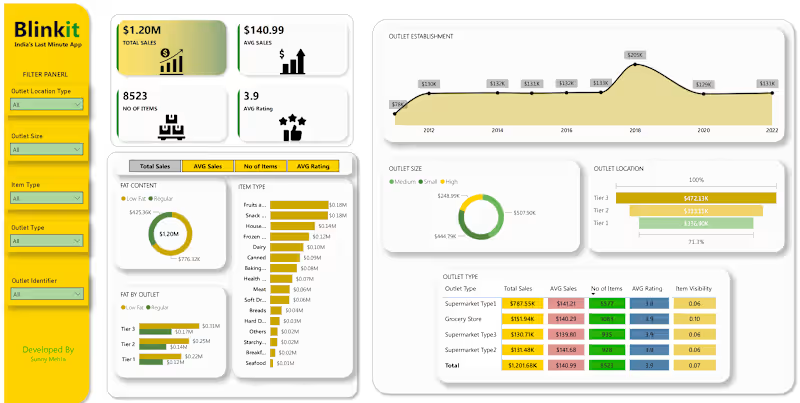
Blinkit-Sales-Dashboard This project is an interactive Power BI dashboard developed to analyse Blinkit's sales performance, outlet operations, product distribution, and customer-related metrics. The dashboard converts raw retail sales data into meaningful business insights through visualisation and KPI tracking. The objective of this project is to monitor business performance, identify sales trends, evaluate outlet efficiency, and support data-driven decision-making. Key KPIs Total Sales: $1.20M Average Sales: $140.99 Number of Items: 8,523 Average Rating: 3.9 Dashboard Features Sales Analysis Tracked total revenue and average sales performance to understand overall business growth. Outlet Performance Analysed outlet sales based on the following: Outlet Size Outlet Location Type Outlet Establishment Year Outlet Type Product Category Analysis Identified top-performing product categories contributing the highest revenue. Customer & Product Insights Compared low-fat and regular products to understand purchasing trends and monitored customer ratings for performance evaluation. Interactive Filters Added slicers for: Outlet Location Type Outlet Size Item Type Outlet Type Outlet Identifier These filters allow users to dynamically explore data and generate business insights. Project Outcome This project demonstrates practical skills in business intelligence, KPI reporting, analytical thinking, and dashboard development using Power BI. It highlights the ability to transform raw business data into business insights for decision-making. Developed By Sunny Mehta
1
59
Python
(4)
Follow
Message
Daniyal Shaikh
Pune, India
Expert Data Analyst & Machine Learning Specialist | Python
Follow
Message
Expert Data Analyst & Machine Learning Specialist | Python
0
E-Commerce Reverse Logistics Analysis and Prediction
0
7
0
Online Retail Price Analysis - Flipkart vs Amazon
0
5
0
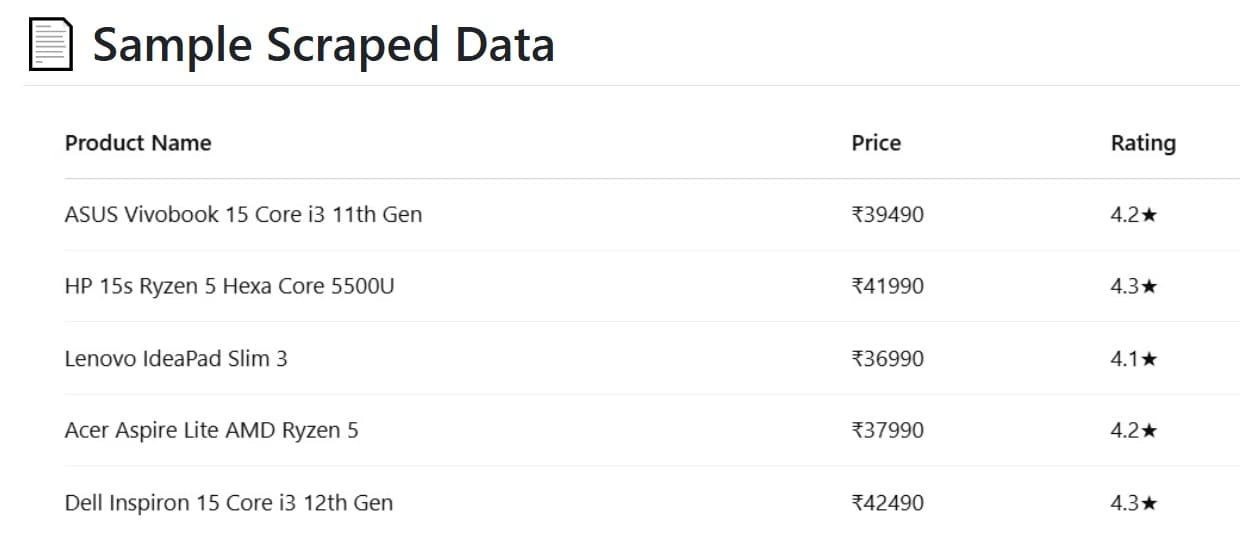
Flipkart Laptop Web Scraping Project
0
5
View more →
Python
(3)
Follow
Message
Kaustubh Bhiwsankar
Pune, India
Data Analytics Professional
Follow
Message
Data Analytics Professional
0
Geospatial Analysis and Feature Extraction 📊🌏
0
15
0
Dynamic Media Scraping Solution 🎭
0
8
0
End-to-End Data Analytics 📊💻🔍
0
12
View more →
Python
(3)
Follow
Message
Vikram Sheth
Pune, India
Data Engineering & Optimization Expert 🚀
Follow
Message
Data Engineering & Optimization Expert 🚀

0
Enterprise Data Optimization for Financial Firm
0
21
0
Database Design & Implementation
0
14
0
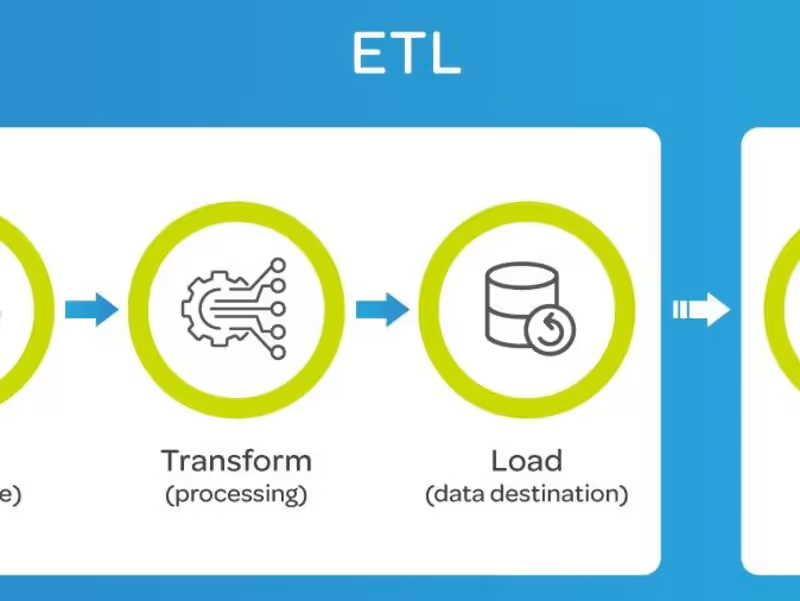
ETL Pipeline Development - For Data Analytics
0
16
0
Freelance Database Architect
0
18
Python
(3)
Follow
Message
Vikaskumar dane
Pune, India
DevOps Automation | Full stack Developer | Java Developer

5.0
Rating
25
Followers
Follow
Message
DevOps Automation | Full stack Developer | Java Developer

0
🚀 Troubleshooting Critical Terraform Drift in AWS Production Project Description / Post Body: I recently encountered a critical CI/CD failure while deploying a serverless backend to a new AWS environment. The pipeline was paralyzed due to "Resource Drift"—a mismatch between the Terraform state file and the actual infrastructure. The Challenge: A manual "hotfix" in the AWS Console created "ghost resources" (Secrets) that Terraform couldn't see. This caused repeated deployment failures and blocked the staging environment. The Solution: Instead of tearing down the environment, I used the terraform import workflow to: Documented the full fix in my technical blog (Link below) https://shorturl.at/ZJR3g
1
0
119
2
Hey fellow Contra builders! 👋✨ I'm Vikaskumar, a Full Stack Developer pioneering the future with Web3. Currently crafting a decentralized app using TypeScript, Next.js, Tailwind, Node.js, and Ether.js—where smart contracts meet sleek modern UI! (client returning from LinkedIn!) Check out this Next.js-powered UI sneak peek 👀. Looking to connect with new clients and collaborators here at Contra Too. Open to feedback, partnerships, and sharing ideas with fellow tech visionaries! 🚀 #web3project #fullstackdeveloper #nextjs #javascript #typescript #tailwindcss #etherjs #OpentoWork #thenewcontra
2
2
172
21
Hello community! 👋 I'm Vikaskumar, a Full Stack Developer from India passionate about building web solutions 🚀 Currently working on old client Project, an AI app that optimizes resumes for better job matches. Still in Process, with Authentication Love turning complex problems into clean, scalable code! Always excited to connect with fellow developers and collaborate on innovative projects 💻 Looking forward to connecting with you all✨ #shareyourwork #thenewcontra #fullstackdeveloper
21
233
0
From Manual Clicking to Terraform Magic
0
8
Python
(1)
Follow
Message
Rachit Bedi
Pune, India
AI developer & backend engineer 💻

$1k+
Earned
1x
Hired
5.0
Rating
4
Followers
Follow
Message
AI developer & backend engineer 💻

0
ChatGPT Prompt Engineer
0
50
0
Building Conversational AI Chatbot
0
34
0
Professional Technical Solution Consultant
0
15
View more →
Python
(2)
Follow
Message
Deepak Patil
Pune, India
Cloud Infrastructure Engineer | AWS, Serverless & AI Systems
Follow
Message
Cloud Infrastructure Engineer | AWS, Serverless & AI Systems
0
AI-Powered Document Summarizer & Chat System
0
2
0
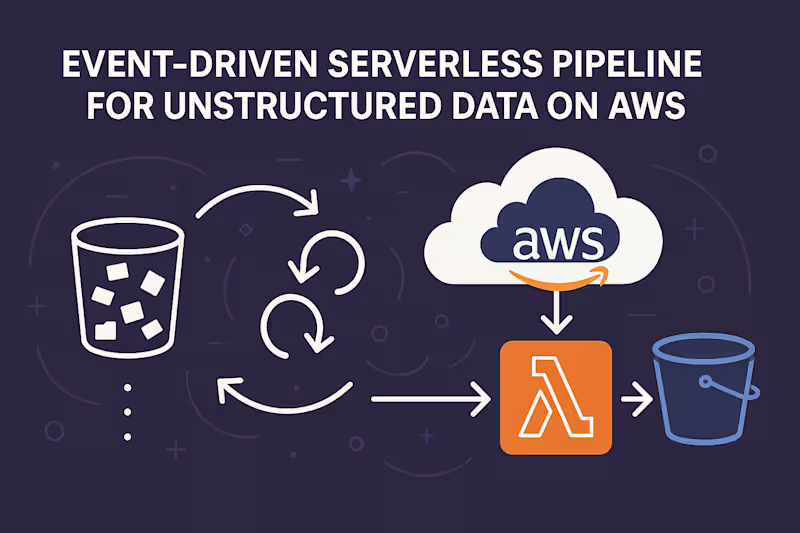
Event-Driven Serverless Pipeline for Unstructured Data on AWS
0
4
2
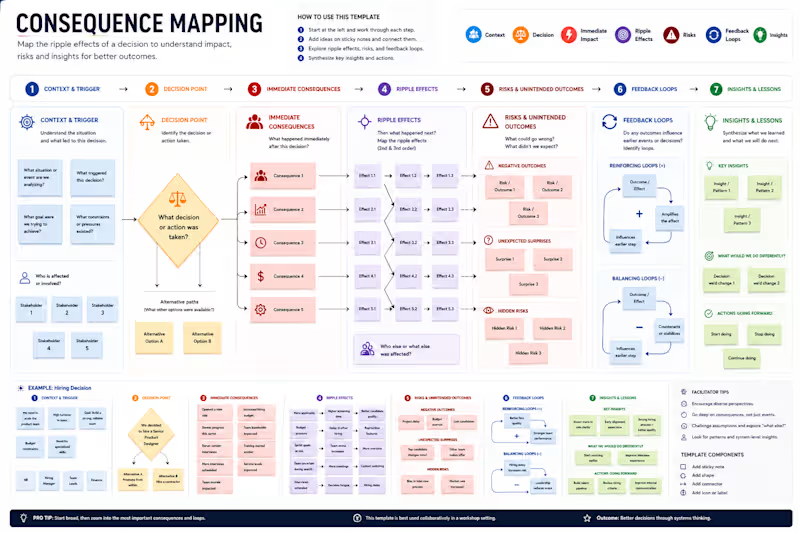
Clarity beats complexity. I built this consequence map to cut through noise and see decisions for what they really are — trade-offs with outcomes. No guesswork, no overthinking. Just cause → effect, laid out clean. Good decisions aren’t luck. They’re mapped.
2
138
0
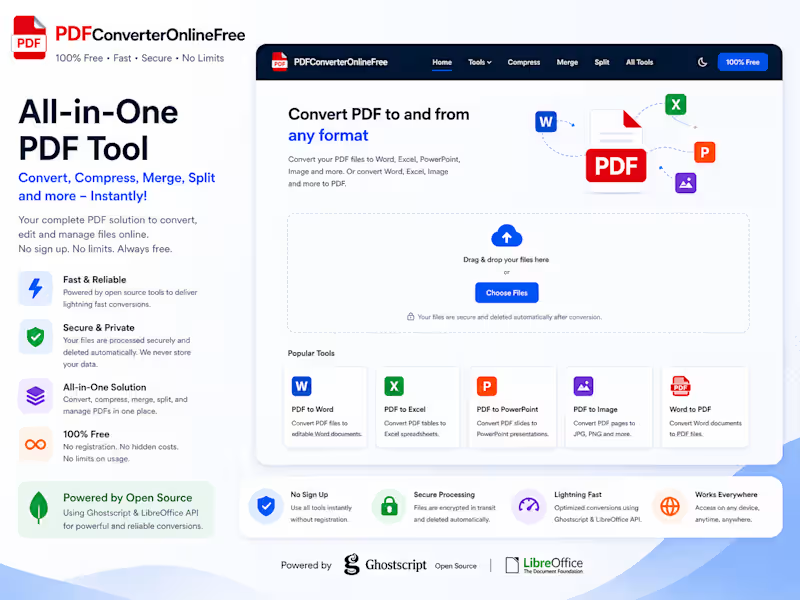
PDFConverterOnlineFree – Node.js PDF Tool I built this project as a practical, real-world PDF tool that runs completely online and doesn’t rely on any database. The idea was simple — most PDF tools out there are either paid, slow, or store user files. I wanted to create something lightweight, fast, and privacy-friendly using open-source tools. 🔗 Project Link: https://github.com/deepakpatilauthor/PDF-Tool-Node-JS-Project What this project does This web app lets users: Convert PDFs to formats like Word, Excel, and images Convert files back into PDF Merge, split, and compress PDFs Use everything without signing up All files are processed temporarily and deleted automatically, so nothing is stored. How I built it I used Node.js for the backend and connected it with: Ghostscript for handling PDF operations like compression LibreOffice for document conversions The whole system is stateless (no database), which keeps it simple and fast. Why I built it this way I wanted to prove that you don’t always need paid APIs or heavy infrastructure to build something useful. With the right open-source tools, you can create a solid, production-ready app. What I learned Working with system-level tools like Ghostscript and LibreOffice Handling file uploads and processing efficiently in Node.js Building a clean workflow without relying on a database Thinking about performance and user privacy Final thoughts This project is a good example of how I approach building tools — keep it simple, make it useful, and avoid unnecessary complexity.
0
110
Python
(2)
Follow
Message
Rohit Poddar
Pune, India
Data Analyst: Transforming Insights 📊
5.0
Rating
1
Followers
Follow
Message
Data Analyst: Transforming Insights 📊
0
Exploratory-Data-Analysis-on-Electric-Vehicle | Python
0
45
0
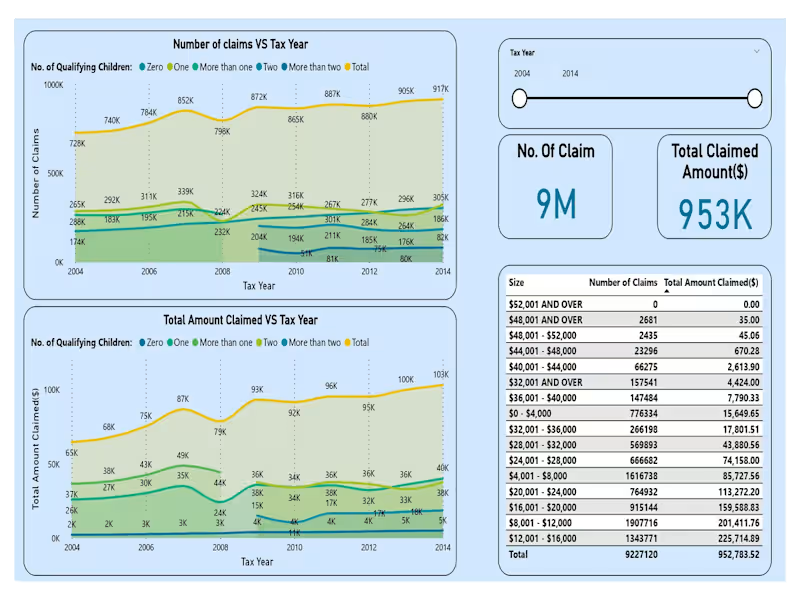
Data Visualisation and Storytelling using Power BI
0
98
0
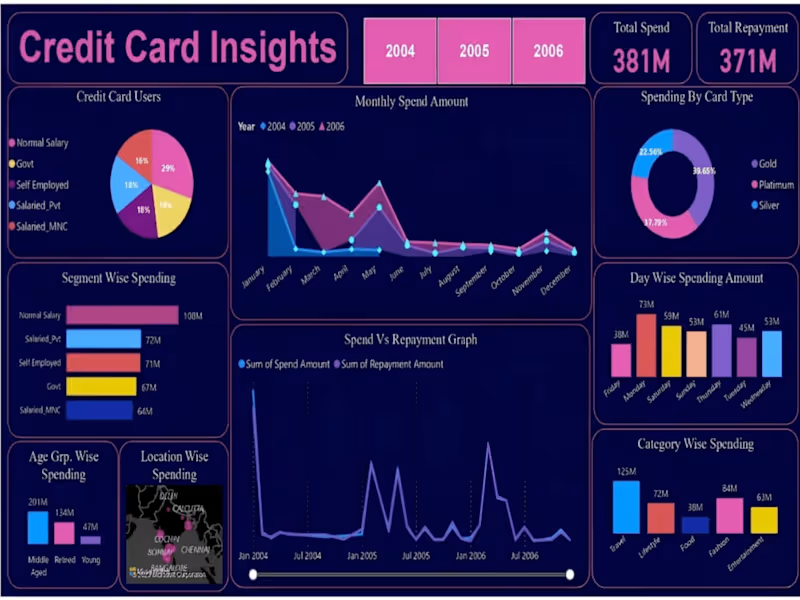
Credit Card Spending Pattern and Customer Acquisition | Power BI
0
70
0
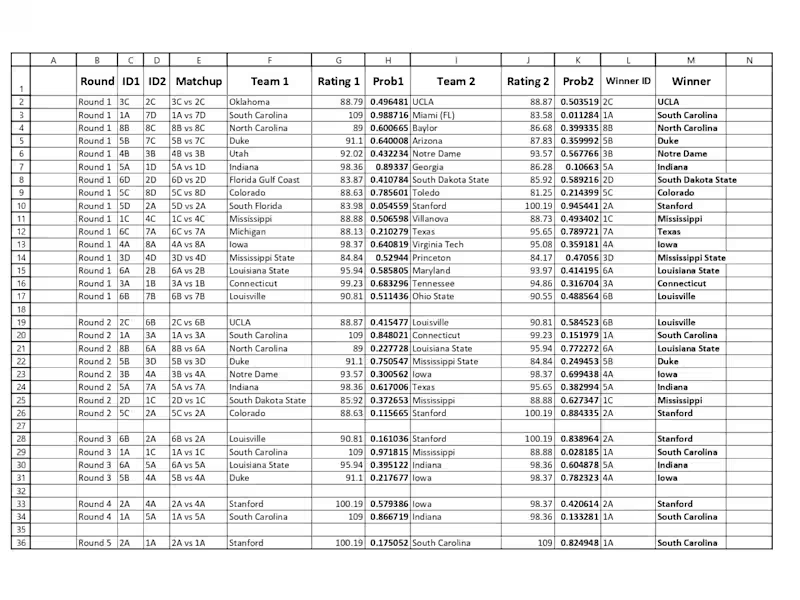
Excel Probabilistic Forecast Tool for March Madness
0
49
Python
(1)
Follow
Message
Explore people