
Senior Data Analyst | Business Intelligence Consultant
View more →

Data Analyst: Transforming Insights 📊

Financial Modeler & Analyst | Investment Modeling, FP&A

Post text
Building a financial model is not just about projecting revenue. It’s about understanding the full financial picture.
Here’s a recent SaaS / subscription business financial model I built, bringing together:
• Revenue streams and pricing
• EBITDA and profitability
• Operating costs
• Cash requirements and closing cash
• Quarterly and annual projections
• Scenario-driven financial planning
• Management dashboards and KPIs
The goal is to turn complex assumptions into a model that makes it easy to understand growth, profitability, cash flow, and funding requirements.
I build financial models that are dynamic, structured, and decision-focused — whether you’re evaluating an investment, planning growth, raising capital, or forecasting a new business.
Financial Modeling | Investment Analysis | FP&A | Forecasting | Financial Automation
#FinancialModeling #FinancialAnalysis #FP&A #SaaS #FinancialPlanning #Excel #BusinessFinance
0
49
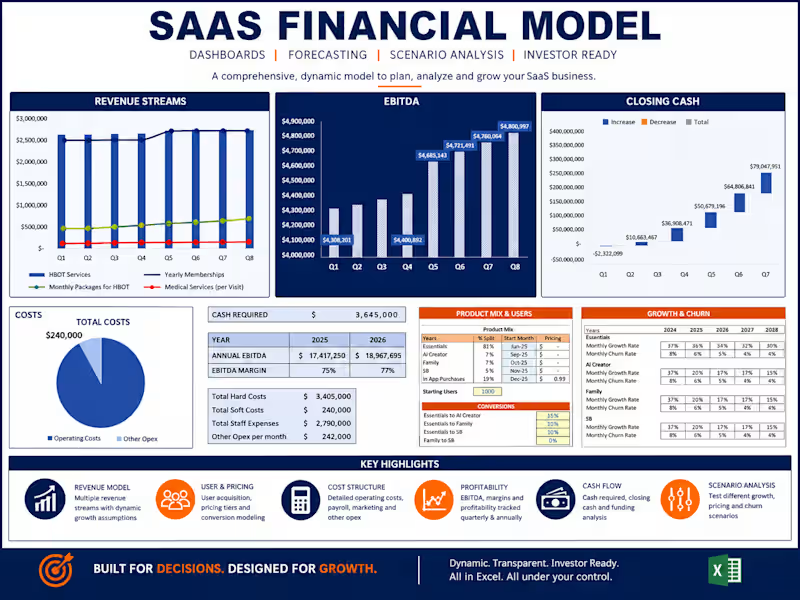
Building a SaaS financial model that goes beyond a basic revenue forecast.
This model brings the key drivers of a subscription business into one integrated framework:
Revenue & product mix
User acquisition, growth & churn
Pricing & conversion assumptions
Operating costs & headcount
EBITDA & profitability
Cash flow & funding requirements
Scenario & sensitivity analysis
Management dashboard & KPIs
The objective is simple: turn business assumptions into a clear financial picture that supports better decisions.
I build dynamic financial models for startups, SaaS businesses, investors, founders, and management teams—from early-stage planning to investment and growth analysis.
Financial Modeling | FP&A | Forecasting | Valuation | Investment Analysis | Financial Automation
#FinancialModeling #SaaS #FP&A #FinancialAnalysis #FinancialForecasting #Excel #FinancialAutomation #Startups
0
48


AI-Powered Solutions: Data Analysis to Web Apps
AI-Powered Solutions: Data Analysis to Web Apps



View more →

Data Analyst | Power BI, SQL & Business Analytics

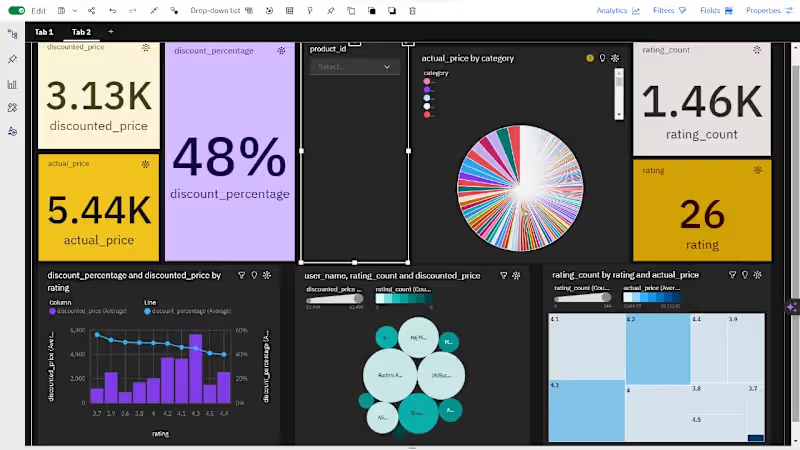
Developed an interactive Amazon Product Analytics Dashboard in Power BI to analyze 200+ product categories, pricing trends, discount effectiveness, customer ratings, and performance drivers. Leveraged Power Query, DAX, and advanced visualizations to transform raw e-commerce data into actionable business insights, enabling data-driven pricing and product strategy decisions.
0
53

Developed an interactive HR Analytics Dashboard using Excel, analyzing 1,470 employee records to track attrition, compensation trends, workforce demographics, promotion patterns, and organizational performance through dynamic KPI reporting and visualization.
0
60

Call Center Performance Analytics Dashboard
Tools: Excel, Advanced Formulas, KPI Design
Description:
Developed a comprehensive productivity dashboard tracking outbound connectivity, call efficiency, attendance, talk time, break utilization, and agent rankings. Designed performance scoring models and visual reporting systems to support workforce management and operational decision-making.
0
81

Data Scientist / Data Analyst
Data Scientist / Data Analyst




View more →