Data Visualization Projects in Pimpri-Chinchwad
Data Visualization Projects in Pimpri-Chinchwad
Sign Up
Post a job
Sign Up
Log In
Filters
2
Projects
People
Message
0
Mandar Chaudhari
pro
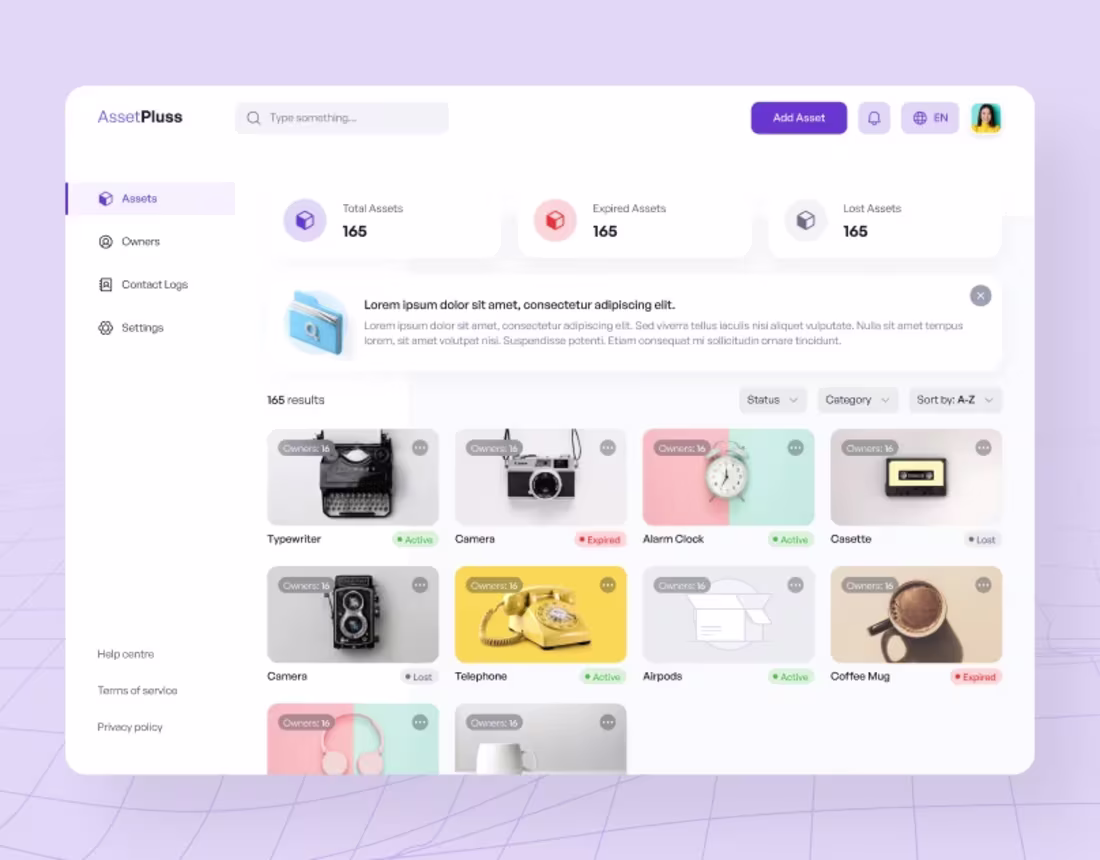
AssetPluss
0
5
Message
3
Dante .
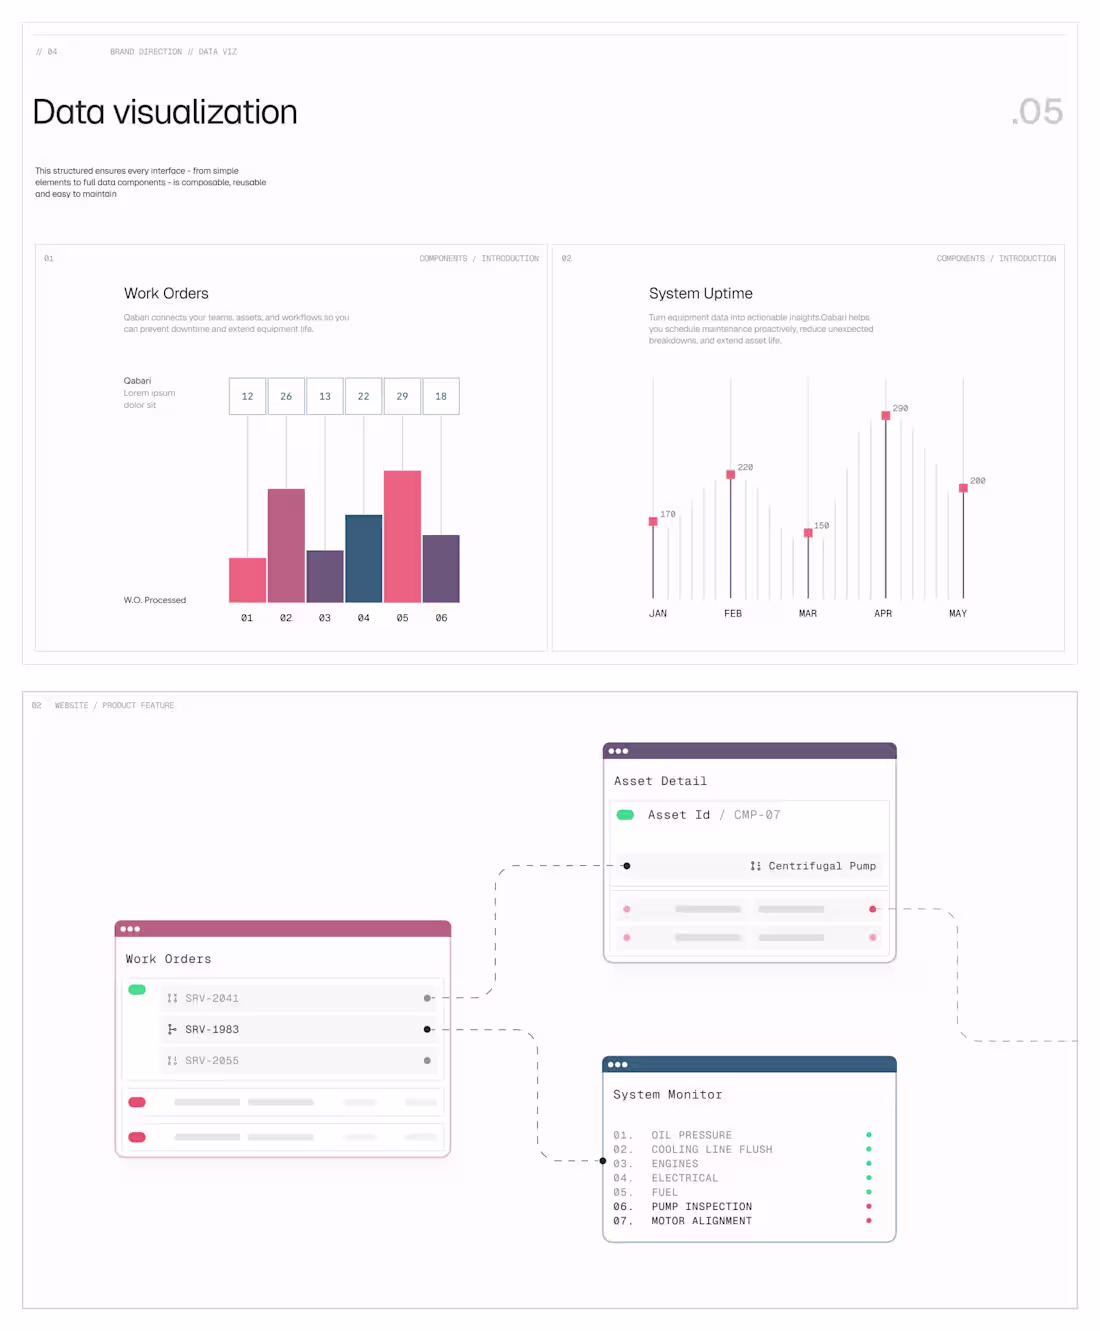
Data Visualisation // Product Features
3
96
Message
0
Smita S
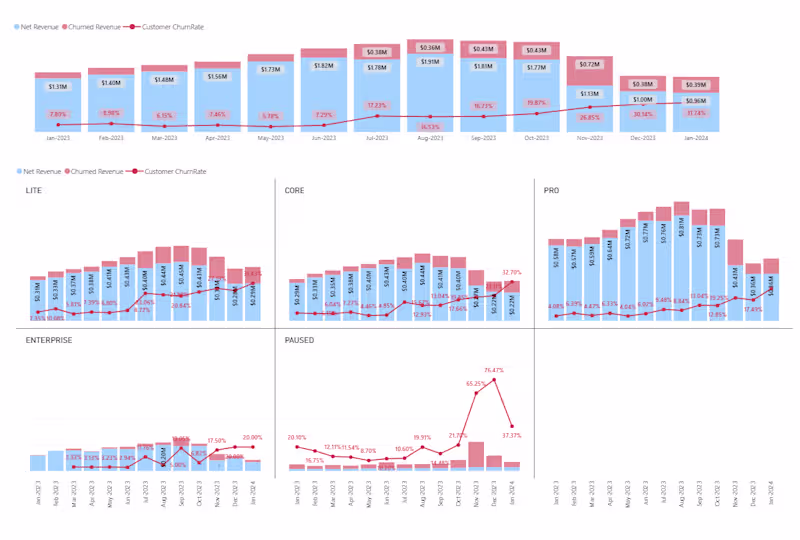
MRR & Churn Analysis Dashboard for SaaS Retention and Growth
0
39
Message
0
Rohit Poddar
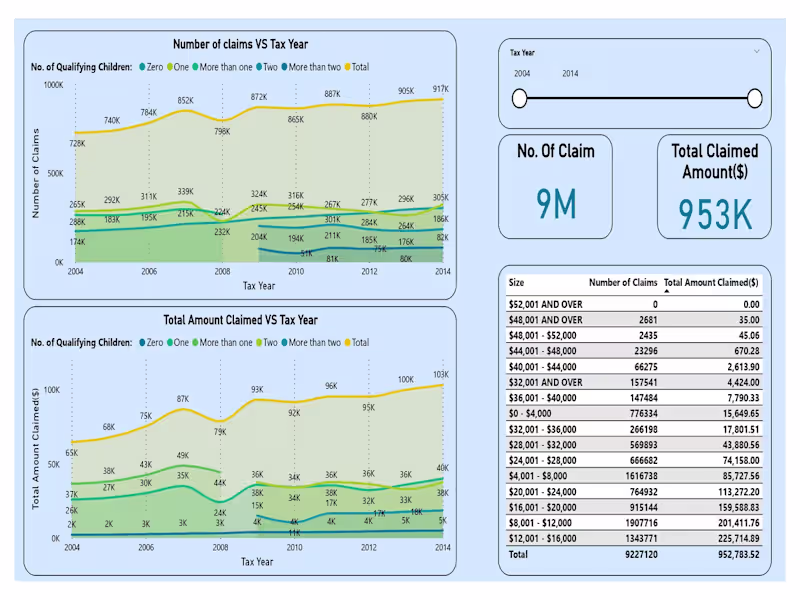
Data Visualisation and Storytelling using Power BI
0
97
Message
1
Umar Shaikh
main_palmer_penguin_EDA_2024-project
1
15
Message
1
Sarbjot Singh
Data Analytics Project | BlinkIT Grocery Sales Analysis Excited to share my latest Data Analytics project ,where I analyzed BlinkIT Grocery Sales Data and delivery data to uncover meaningful business insights 📈 📊 What I worked on: Analyzed sales performance across product categories, outlet types, sizes, and locations Identified top-performing item categories and customer preferences Studied the impact of outlet size, establishment year, and visibility on sales Converted raw data into actionable insights and business recommendations 💡 Key Insights: Fruits & Vegetables, Snack Foods, and Frozen Foods drive maximum sales FOR FULL PROJECT VIST GIT HUB –( https://lnkd.in/d34sdAPz )
1
60
Message
0
Riya Mota
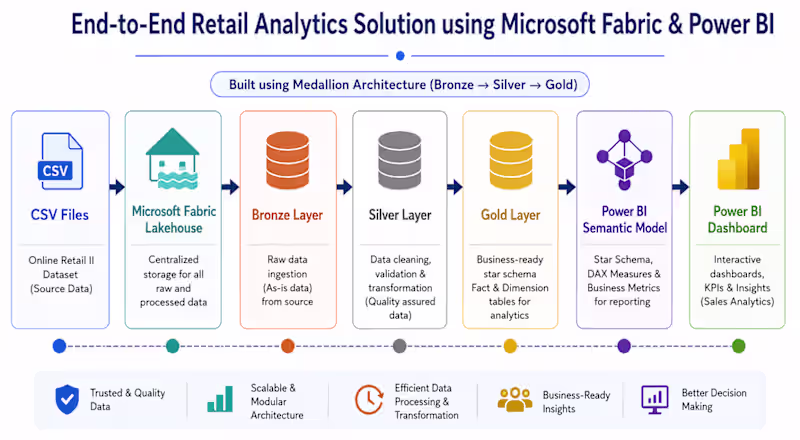
Microsoft Fabric Project - End-to-End Analytics Solution with Microsoft Fabric - Developed an end-to-end analytics solution using Microsoft Fabric, including Lakehouse, Notebooks, Pipelines, and semantic models to automate data ingestion and reporting workflows.
0
31
Message
0
VARSHA ZOKE
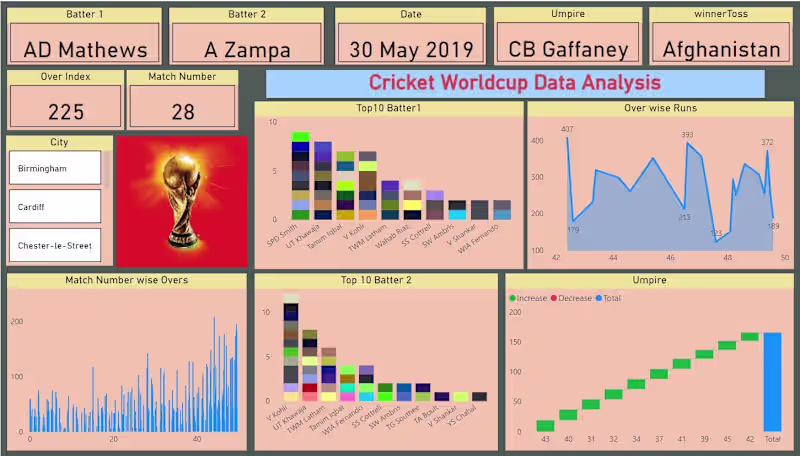
Cricket WorldCup Dashboard
0
8
Message
0
Ateeb Mahedvi
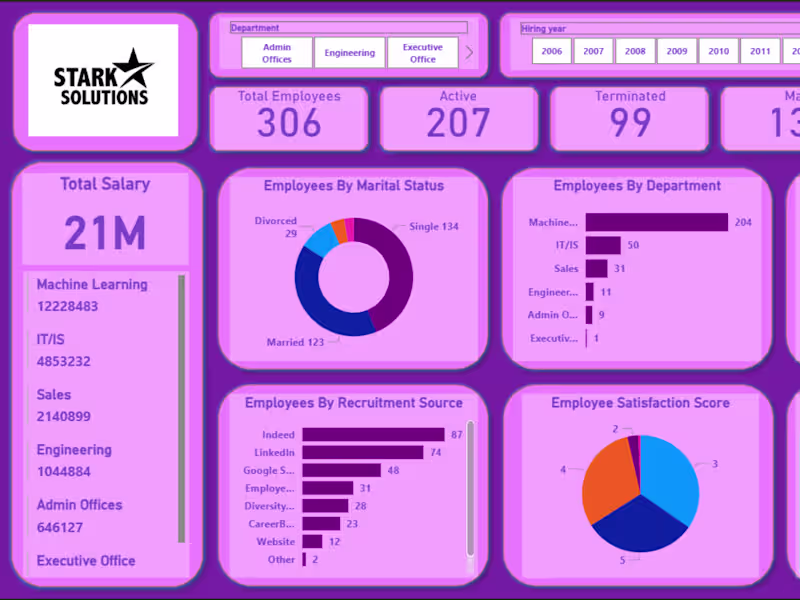
HR Analytics Dashboard
0
3
Message
0
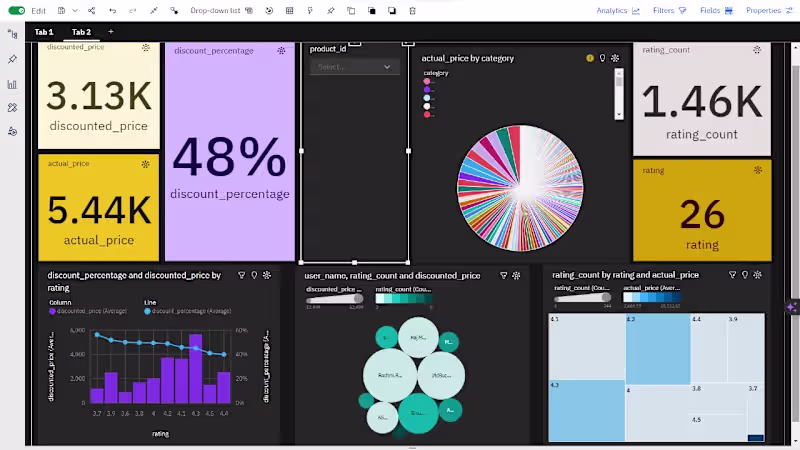
Amal Jose
Developed an interactive Amazon Product Analytics Dashboard in Power BI to analyze 200+ product categories, pricing trends, discount effectiveness, customer ratings, and performance drivers. Leveraged Power Query, DAX, and advanced visualizations to transform raw e-commerce data into actionable business insights, enabling data-driven pricing and product strategy decisions.
0
29
Message
1
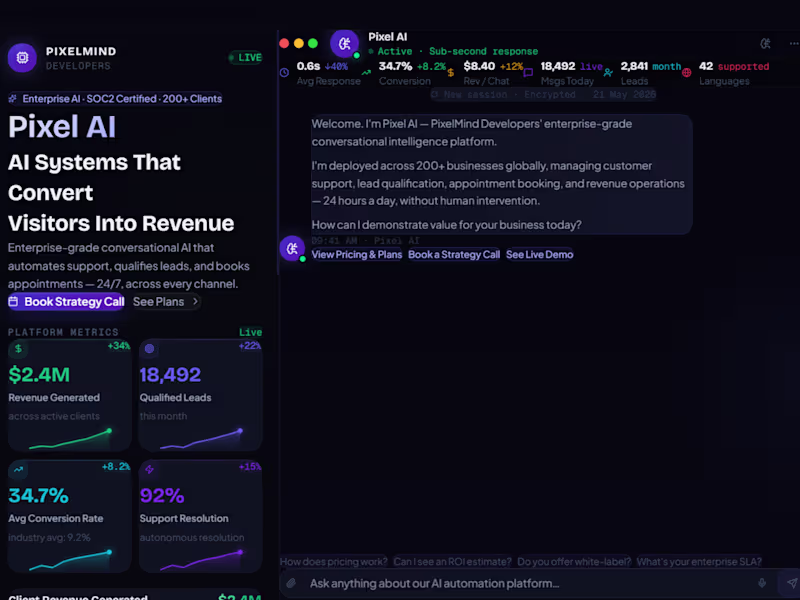
Umair Jamadar
AI Chatbot Development for Business Automation & Lead Handling
1
105
Message
0
Rutwik Ingale
E-commerce Upsell And Cross Sell Analysis
0
9
Message
0
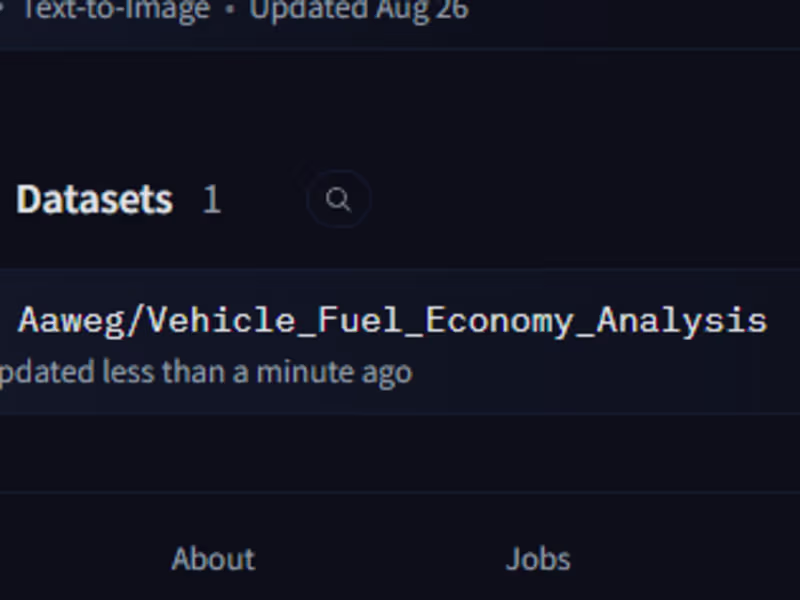
Aaweg Bhaladhare
Report of Vehicle: Fuel Economy Analysis
0
16
Message
0
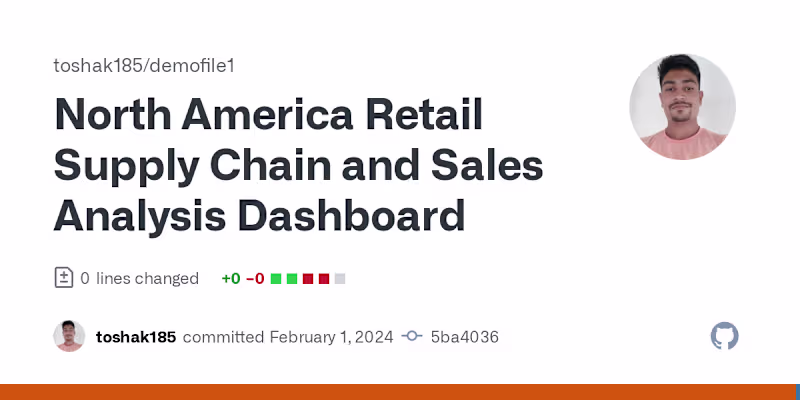
TOSHAK FALAK
North America Retail Supply Chain and Sales Analysis Dashboard
0
9
Message
0
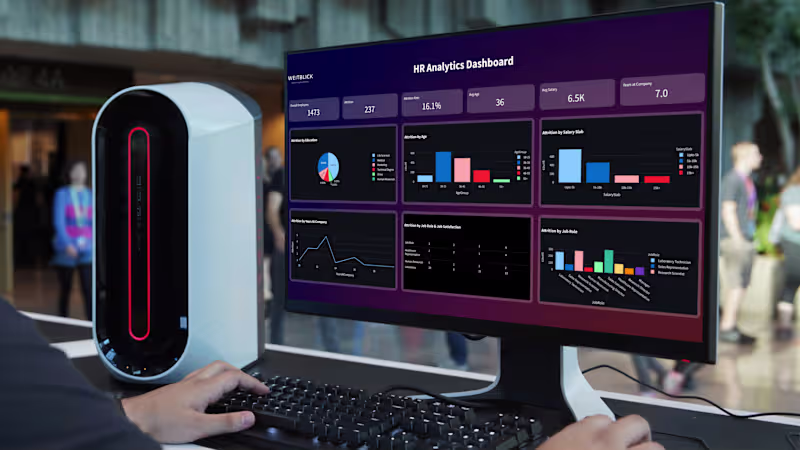
Weitblick
HR Analytics Dashboard - Streamlit
0
3
Message
0
saikat nandi
Sales Analysis E-Commerce Power BI
0
7
Explore projects