Data Visualization Projects in PakistanData Visualization Projects in PakistanOCR Receipt Parsing Microservice (AI-Powered Backend System)
Most receipt-based systems fail because the data is messy, inconsistent, and spread across formats that machines don’t naturally understand. People don’t realise it, but the real problem isn’t capturing receipts, it’s turning them into reliable, structured data that can actually be used.
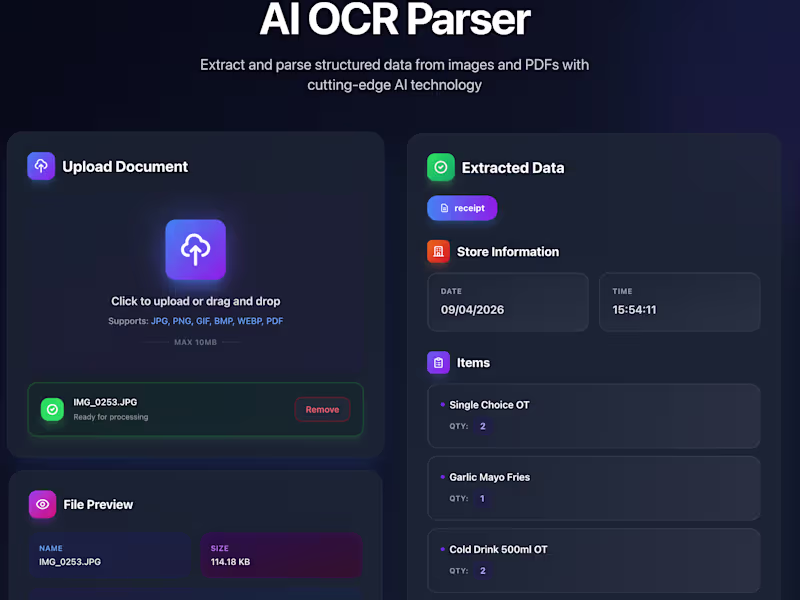
This system removes that friction entirely. You send a receipt (image or PDF), and it comes back as clean, structured JSON ready to plug into any workflow.
The core problem it solves:
Receipt data is chaotic. Different formats, inconsistent naming, missing structure, and OCR noise make it hard to extract anything usable. Even when OCR works, the output is raw text, not something you can build logic on top of.
This project builds a full processing layer that doesn’t just read receipts, it understands and standardises them.
What was built:
A backend microservice that acts as a structured data engine for receipts. The system accepts images or PDFs via an API, runs OCR, extracts merchant details, dates, totals, and line items, and converts everything into a strict JSON schema.
But the real value sits in what happens after OCR.
A normalization layer cleans and standardises item names so inconsistent inputs like “BANANA”, “Bananas”, or “Banana 1lb” all map to a single canonical item. Quantities and prices are cleaned, structured, and validated so the output becomes consistent across different stores and formats.
The system can also plug directly into Airtable, pushing structured items into a live database, enabling automated workflows like pantry tracking, expense logging, or analytics pipelines without needing a full backend system.
Everything is exposed through a simple /parse-receipt API, making it easy to integrate into mobile apps, SaaS products, or internal tools.
Technical architecture:
FastAPI-based microservice designed for simplicity and performance, with OCR powered by Tesseract or cloud services like AWS Textract and Google Vision depending on accuracy requirements. The parsing layer combines rule-based extraction with AI-assisted cleanup to handle real-world receipt noise.
The system is fully containerized using Docker, deployable on platforms like Render or Heroku, and comes with OpenAPI (Swagger) documentation for quick testing and integration.
Designed as a stateless service, it avoids database complexity and instead integrates with external systems (like Airtable), making it lightweight and easy to scale.
Business value built in:
This isn’t just an OCR tool, it’s a data standardization engine. The same system can power expense tracking apps, inventory systems, meal planning products, or financial analytics platforms.
Because the parsing and normalization layers are modular, the microservice can be exposed as a standalone API, creating opportunities for reuse across multiple products or even external licensing.