
Turning your fintech and web3 ideas into shipped products


Turning your fintech and web3 ideas into shipped products


Delivering Strategic Growth Through Data, Finance & Tech.

Apple’s Performance Is Not Built on Products Alone. It Is Built on Systems, Diversification, and Intelligent Decisions.
At Intersect Analytics, we scraped, transformed, and analyzed Apple Inc.’s sales and financial performance data using Python and Power BI to understand what drives one of the world’s most valuable companies.
The findings reveal an important lesson for every business:
Growth becomes sustainable when performance is measurable.
Key Findings From Apple’s Performance Analysis
📱 iPhone Continues Leading Revenue Generation
Apple’s iPhone business remains the company’s strongest revenue engine, demonstrating the importance of maintaining a strong core product while continuously innovating.
☁️ Services Revenue Continues Growing Rapidly
Subscription services, cloud ecosystems, and recurring revenue streams continue strengthening profitability and long-term business resilience.
🌍 Regional Diversification Reduces Risk
Apple’s strong performance across multiple global markets highlights the value of diversification in protecting businesses from overreliance on one market or customer segment.
📈 Strong Margins Reflect Operational Discipline
Sustained profitability demonstrates the importance of operational efficiency, cost management, and strategic investment.
📊 Performance Visibility Drives Better Decisions
Apple’s ability to track performance across products, regions, and financial metrics reinforces a simple reality:
What gets measured gets improved.
How We Built the Analysis
🐍 Python for Data Scraping & Transformation
📊 Power BI for Interactive Dashboard Development
📈 Business Performance & Financial Analytics
⚙️ Automated Reporting & KPI Monitoring
What This Means for Businesses
Most businesses are sitting on valuable data but spend too much time:
❌ Updating spreadsheets manually
❌ Preparing repetitive reports
❌ Chasing numbers across systems
❌ Making decisions with incomplete information
At Intersect Analytics, we help businesses turn raw data into automated dashboards, smarter reporting systems, and faster decision-making tools.
Our Services
✔ Power BI Dashboards & Business Intelligence
✔ Excel & Google Sheets Automation
✔ Python Data Analysis & Automation
✔ Financial Analysis & KPI Reporting
✔ SQL & Database Analytics
✔ Workflow Automation & Reporting Systems
Because successful businesses are not built by working harder alone.
They grow by building systems that save time, improve decisions, and scale performance.
INTERSECT ANALYTICS
Power BI | Automation | Financial Analysis | Business Intelligence
Decisions Backed by Data. Growth Driven by Insight.
📞 +254 723 632 207
1
57
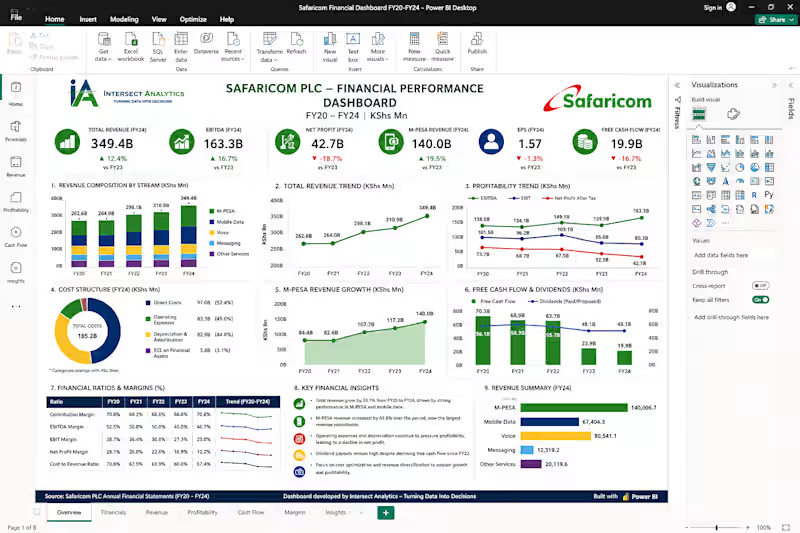
Safaricom Financial Performance Dashboard (FY20–FY24): Key Insights & Business Impact
The Safaricom Financial Dashboard provides a clear, data-driven view of performance over five years, highlighting both growth opportunities and critical financial pressures.
🔍 Key Findings
Strong Revenue Growth: Total revenue shows consistent growth, driven by digital transformation.
M-PESA Dominance: M-PESA has emerged as the largest revenue contributor, reinforcing its role as a core growth engine.
Mobile Data Expansion: Sustained growth in mobile data reflects increasing demand for digital services.
Decline in Traditional Revenue: Voice and messaging revenues continue to decline, signaling a shift in customer behavior.
Margin Pressure: Rising operating costs, direct costs, and ECL provisions are compressing profitability.
Profitability Decline: Net profit has decreased despite revenue growth—highlighting inefficiencies.
Cash Flow Concerns: Declining free cash flow indicates increasing capital demands.
High Dividend Payouts: Continued strong dividends despite cash flow pressure raise sustainability questions.
🚀 What This Means for Businesses
Growth alone is not enough — cost optimization and efficiency are critical
Businesses must track performance beyond revenue to understand true profitability
Real-time insights are essential to respond quickly to financial risks and opportunities
💼 How Intersect Analytics Adds Value
At Intersect Analytics, we go beyond dashboards — we deliver decision intelligence.
📊 Financial Analytics Expertise
Deep understanding of financial metrics, KPIs, and business drivers
⚙️ Custom Power BI Dashboards
Interactive, scalable dashboards tailored to your business needs
🔗 Data Integration & Automation
Seamless connection of multiple data sources with automated reporting
📈 Insight-Driven Decision Making
We don’t just show data — we explain the “why” behind it
🧠 Strategic Approach
Combining finance, analytics, and business strategy for real impact
✅ Why Choose Intersect Analytics
Proven experience in financial analytics & dashboard development
Solutions designed for clarity, scalability, and performance tracking
Strong focus on business impact — not just visuals
Reliable partner for end-to-end analytics and continuous support
📩 Looking to transform your financial data into actionable insights?
Let Intersect Analytics build a powerful, intelligent dashboard that drives smarter decisions and business growth.
1
1
72

🚀 Financial Analytics Dashboard | Power BI, Excel & Data Automation Experts
Turn your business data into clear, actionable insights with a professionally built Financial Analytics Dashboard. This Coca-Cola case study demonstrates how structured data, KPI tracking, and advanced visualization can uncover trends, improve profitability, and support smarter decision-making.
📊 What This Analysis Shows
Consistent revenue growth over 5 years
Strong profit margin expansion and cost efficiency
Clear visibility into financial performance trends
Data-driven insights for strategic planning and forecasting
💼 Our Services
We help businesses unlock the full value of their data through:
✔ Power BI Dashboard Development (interactive, executive-ready)
✔ Financial Analysis & Modeling (profitability, forecasting, KPIs)
✔ Excel & Google Sheets Automation (reports, dashboards, workflows)
✔ Data Cleaning & Transformation (structured, reliable datasets)
✔ Business Intelligence Solutions (end-to-end analytics systems)
🛠️ Tools We Use
Power BI • Excel • SQL • Python • Tableau • Google Sheets
⭐ Why Work With Us
Data-driven, business-focused insights
Clean, professional, and decision-ready dashboards
Scalable solutions that grow with your business
Strong expertise in finance, analytics, and automation
🎯 Who This Is For
Businesses needing financial dashboards
Companies struggling with manual reporting
Teams looking to automate data workflows
Decision-makers who want real-time insights
📩 Let’s build your custom analytics dashboard today
📱 WhatsApp: +254 723 632 207
👉 Don’t just collect data — turn it into a competitive advantage.
0
28
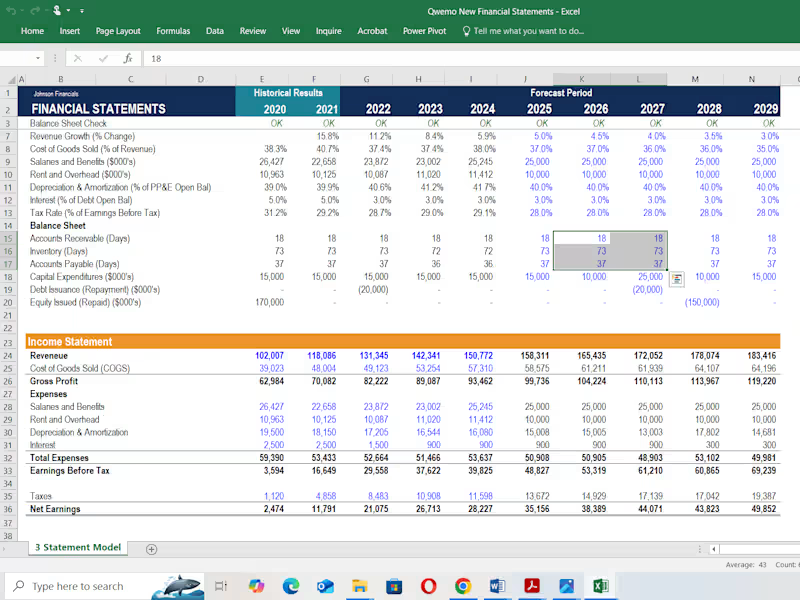

I will always meet your expectations on the fields stated
I will always meet your expectations on the fields stated


Accountant helping businesses keep clean, accurate books
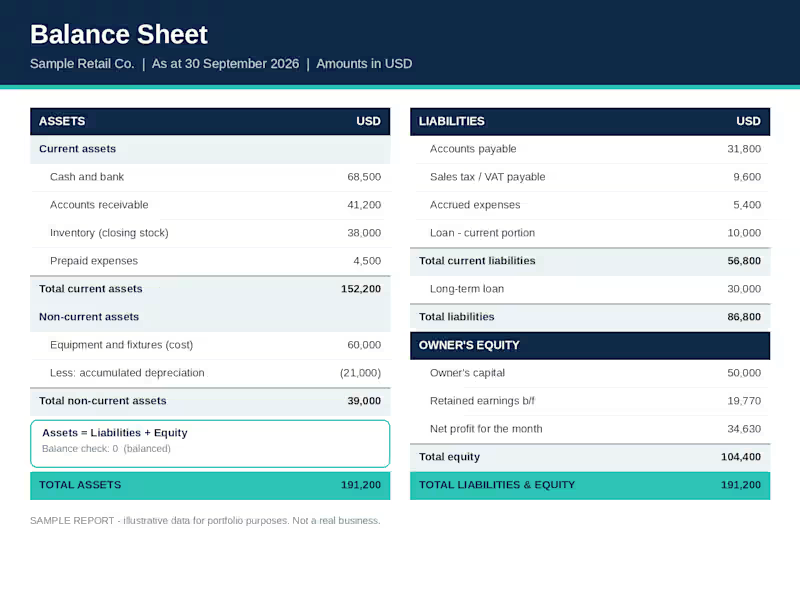
I prepare clear, accurate Balance Sheets that show business owners exactly what their business owns, what it owes, and what it is worth at the end of each month.This sample presents assets (current and non-current), liabilities (current and long-term) and owner's equity side by side, with net profit carried over from the monthly P&L. A built-in balance check confirms that assets equal liabilities plus equity.
What you get when we work together:
A clean, easy-to-read Balance Sheet every month, even if you're not an accountant
Figures that reconcile with your P&L and cash records
Accurate reports prepared in QuickBooks and Excel
Need monthly bookkeeping and financial reporting for your business? Send me a message and let's talk.
0
16
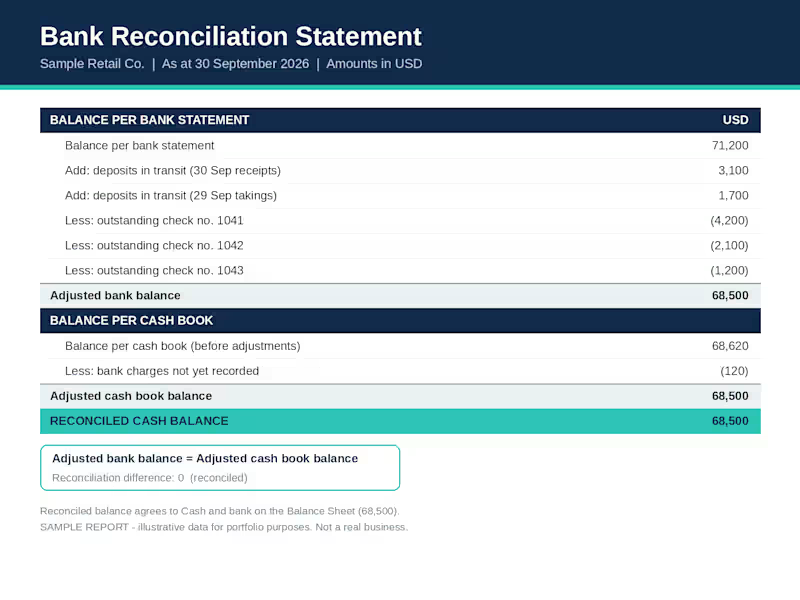
Bank reconciliation in Excel with live formulas. I match your bank statement to your books and explain every difference, so your cash figure is correct and agrees with your Balance Sheet and Cash Flow.
Need your accounts reconciled? Send me a message
0
15
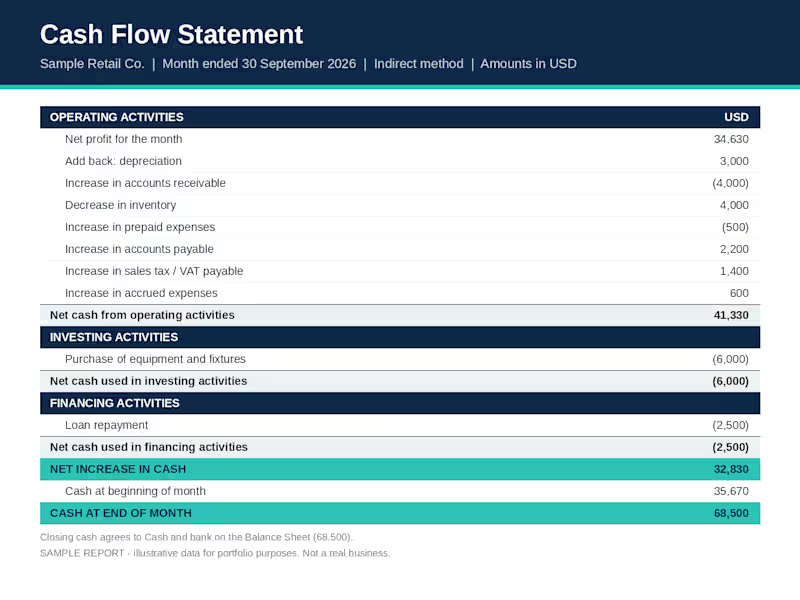
Cash is what keeps a business running, and profit alone doesn't tell you where it went. That's what this Cash Flow Statement shows.I started with the month's net profit and worked through the real movements in cash: customers paying late, stock bought or sold, bills paid, equipment purchased and loan repayments. The result is one simple page showing how much cash came in, how much went out, and why the bank balance changed.The closing cash agrees to the Balance Sheet, so every figure can be traced back. Prepared in QuickBooks and Excel using the indirect method
0
13
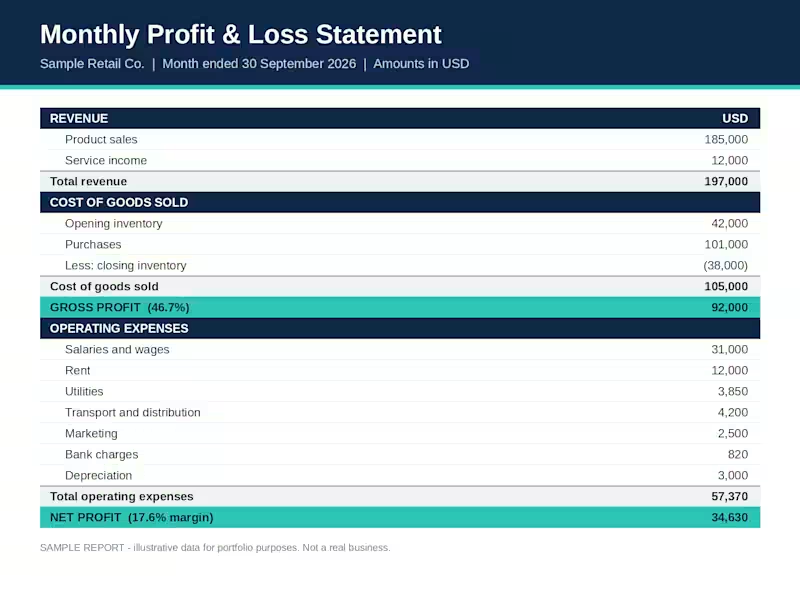
I create clear, accurate Monthly Profit & Loss Statements that help business owners see exactly how their business performed, in under a minute.This sample shows how I present a month's results: revenue by source, a full cost of goods sold calculation, gross profit, itemized operating expenses, and net profit, with gross and net margins highlighted. Every subtotal is checked and reconciled before delivery.
What you get when we work together:
A clean, easy-to-read monthly report, even if you're not an accountant.
Accurate figures prepared in QuickBooks and Excel
Reports delivered on time, every month
Need monthly bookkeeping and financial reporting for your business? Send me a message and let's talk.
0
15

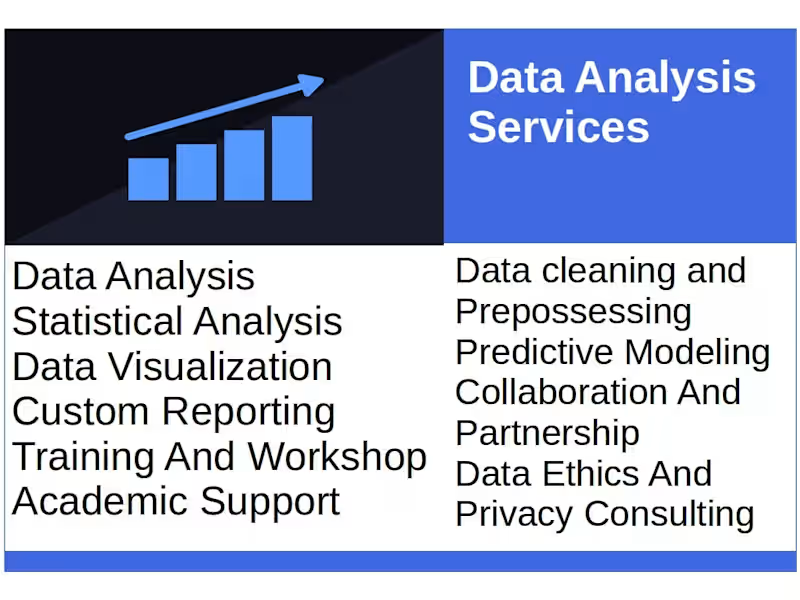
Statistician and Data Analyst Expert
Statistician and Data Analyst Expert

View more →

Financial Analyst,writer,Transcriptionist
Financial Analyst,writer,Transcriptionist



Financial analyst driving strategic decisions.

Finance-focused YouTube channel showcasing company analysis, financial modeling, valuation, and investor presentations. Highlights expertise in simplifying complex financial data into actionable insights.
0
20
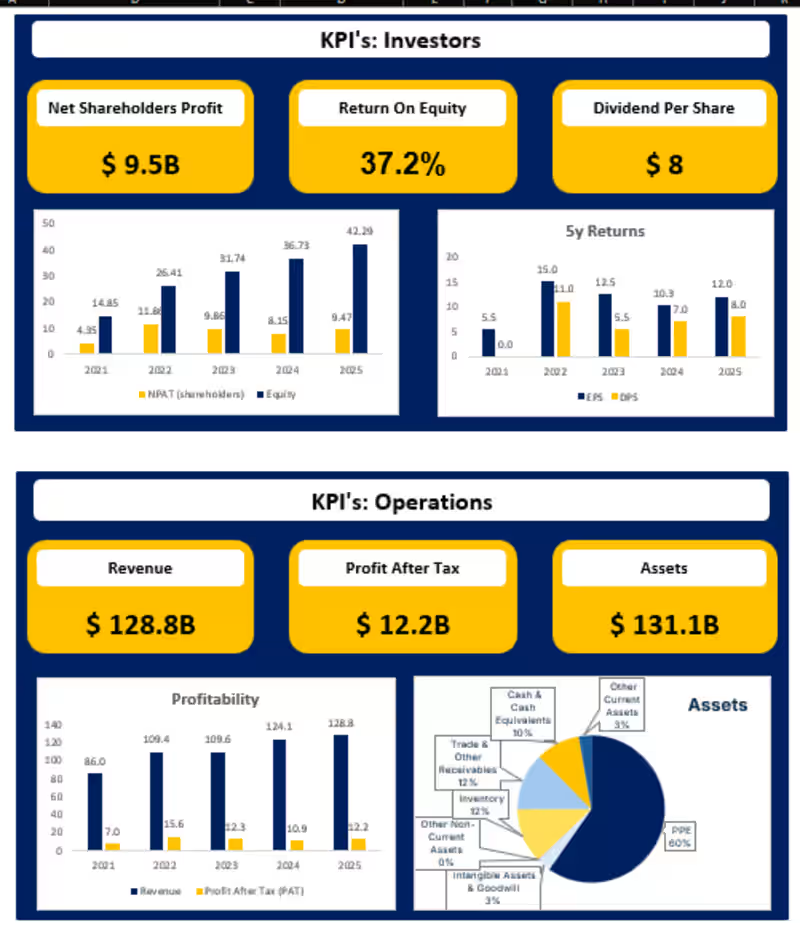

Helping businesses get paid faster and improve cash flow
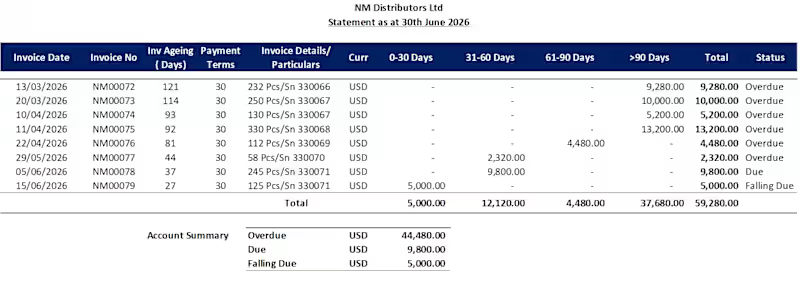
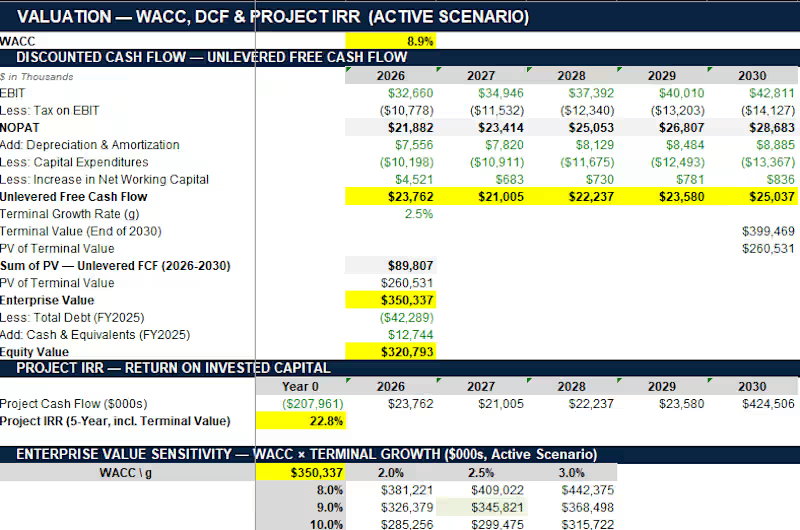
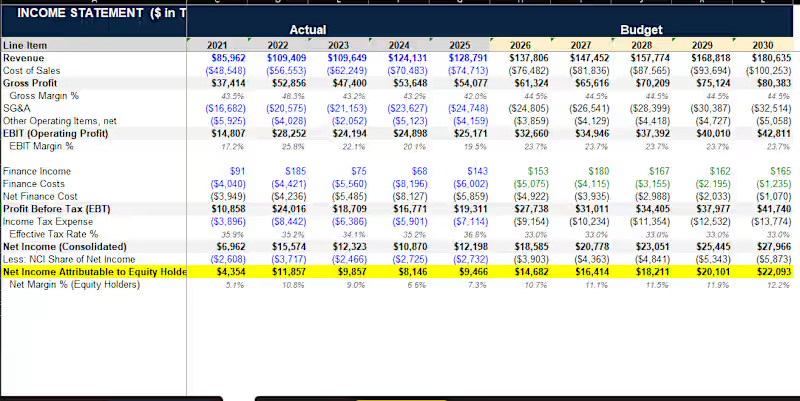
This project involved preparing a comprehensive customer aged statement to provide a clear overview of outstanding accounts receivable. The report categorized unpaid invoices by aging periods, helping the client identify overdue balances, prioritize collections, monitor customer payment behavior, and improve cash flow management through accurate and timely reporting.
0
54
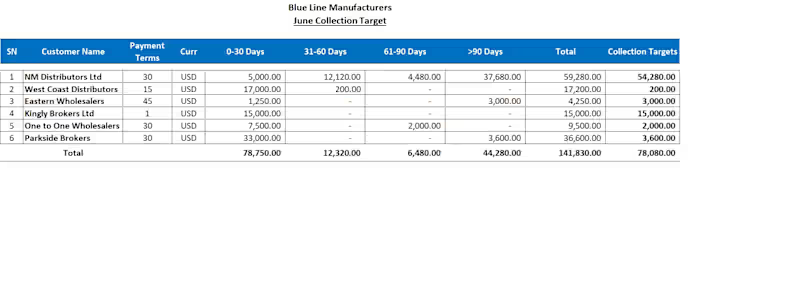
Now offering freelance Credit Control services. I specialize in payment reminders, account reconciliations, collections, dispute resolution, and receivables reporting to help businesses get paid faster.
0
159
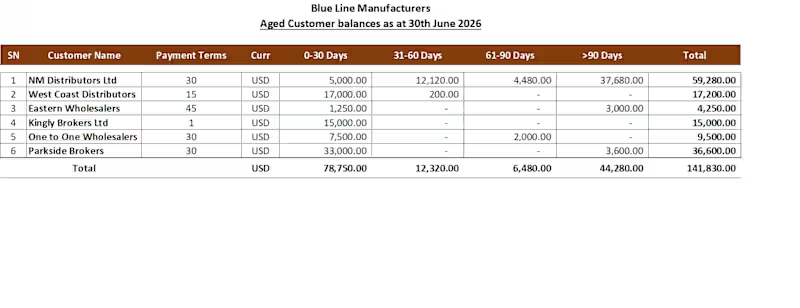
This project involved preparing a detailed customer aged balance report to provide a clear view of outstanding receivables per customer (account). The report enabled the client to identify overdue accounts, review credit terms for slow paying customers, prioritize collection efforts, monitor payment performance, and support informed credit management decisions, ultimately improving cash flow and reducing overdue debt.
0
100
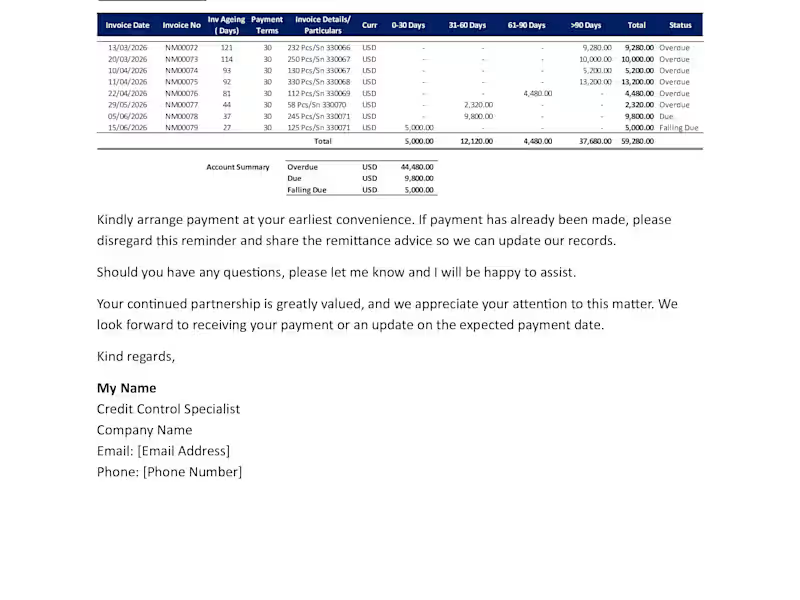
This project involved preparing a comprehensive customer aged statement to provide a clear overview of outstanding invoices. The report categorized unpaid invoices by aging periods, helping the client identify overdue balances, prioritize collections, monitor customer payment behavior, and improve cash flow management through accurate and timely reporting.
0
56