
Business Intelligence and Data Analyst
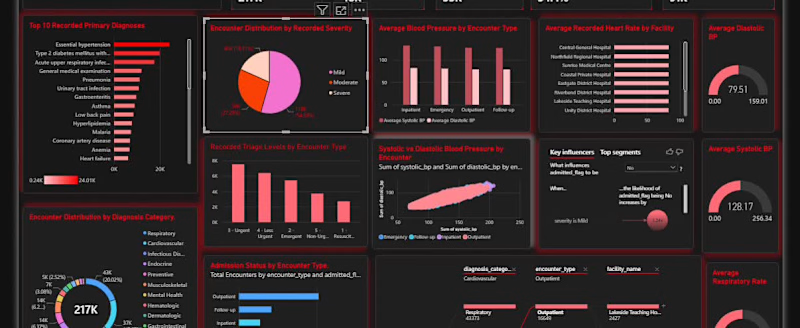
Healthcare Clinical Insights | Power BI Dashboard
This Clinical Insights dashboard explores the clinical characteristics of patient encounters, bringing together information on diagnoses, severity, encounter types, vital signs, laboratory results, chronic conditions, procedures, and follow-up patterns.
It helps transform clinical records into a more structured view of patient populations, presenting insights that can support clinical monitoring, healthcare planning, and informed decision-making.
Key areas of analysis include:
Diagnosis Analysis: Identifies the most frequently recorded diagnoses and understand how clinical conditions are distributed across encounters.
Patient Acuity & Severity: Examines the severity of recorded cases and understand the distribution of patients across different acuity levels.
Encounter Types: Explores the different types of healthcare encounters and how clinical activity is distributed.
Vital Signs Analysis: Examine srecorded vital signs to identify patterns and variations across patient encounters.
Laboratory Results: Explores laboratory findings and their distribution across recorded clinical encounters.
Chronic Conditions: Understands the prevalence and distribution of recorded chronic conditions within the patient population.
Procedures & Interventions: Analyses the types and frequency of procedures recorded during encounters.
Admissions & Follow-up: Explores patterns in hospital admissions, follow-up requirements, and continuity of care.
With interactive filters and multiple dimensions of clinical analysis, users can explore specific diagnoses, compare patient groups, and investigate patterns across reporting periods.
The bigger picture: Clinical data holds valuable information beyond individual patient records. When properly organised and analysed, it can help healthcare organisations understand disease patterns, monitor patient acuity, evaluate clinical activity, and identify areas that may require further attention.
Built with Power BI, this dashboard demonstrates how business intelligence can make complex healthcare data more accessible, meaningful, and useful for clinical and administrative decision-making.
0
113
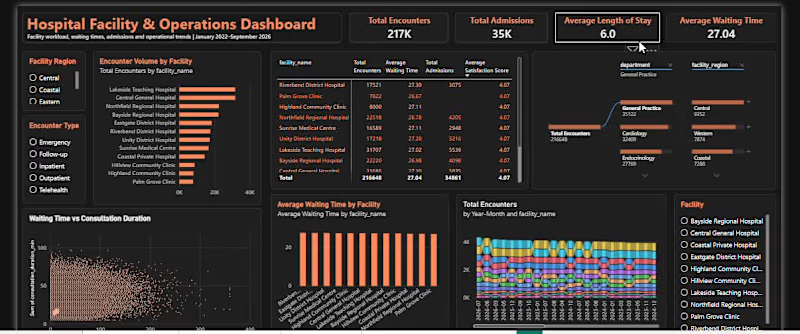
Healthcare Facility & Operations | Power BI Dashboard
How efficiently are healthcare facilities operating, and what explains the differences in their performance?
This dashboard takes a close look at facility-level performance (For a hospital with several branches), exploring patient volumes, waiting times, consultation duration, and operational efficiency across healthcare facilities.
It moves beyond overall healthcare statistics to examine how individual facilities compare, where bottlenecks may exist, and how operational performance changes over time.
Some of the key analyses include:
Average Waiting Time by Facility, Encounter Volume by Facility, Facility Rankings Over Time, Waiting Time vs. Consultation Duration, Facility Performance Comparison, Monthly Operational Trends and more.
Interactive date filters and facility-level analysis make it easier to investigate specific periods, compare facilities, and identify patterns that may otherwise be hidden in summary reports.
The business intelligence perspective: Facility performance is not just about how many patients are served. It is also about how efficiently services are delivered, how resources are utilised, and where improvements may be needed.
Built with Power BI, this dashboard demonstrates how healthcare data can support operational monitoring, facility benchmarking, and more informed management decisions.
0
41
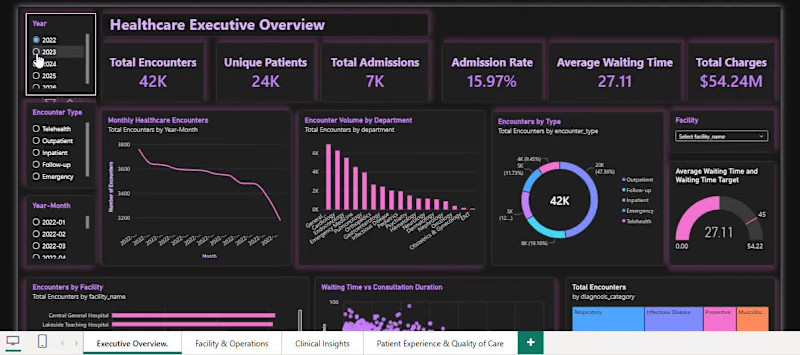
Healthcare Executive Overview | Power BI Dashboard
This Healthcare Executive Overview dashboard brings key healthcare performance indicators into one interactive view, helping management monitor activity, identify trends, and make more informed operational decisions.
The dashboard provides an overview of:
Total Encounters, Unique Patients, Admission Rate, Total Charges, Average Waiting Time and more.
With interactive Year and Month slicers, users can explore performance across different reporting periods, compare trends, and examine results across healthcare facilities.
The goal is simple: turn healthcare data into meaningful insights that support better planning, resource allocation, financial monitoring, and operational decision-making.
Built with Power BI, this dashboard demonstrates how business intelligence can help healthcare administrators move beyond static reports and gain a clearer picture of organizational performance.
1
1
176
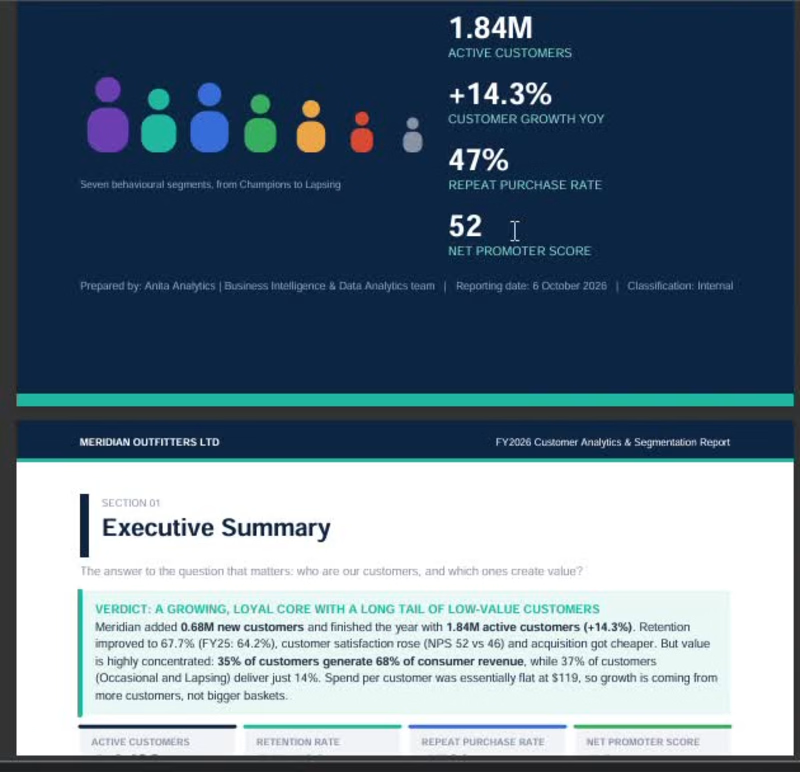
Customer Analytics & Segmentation Report 📊
Having customer data is one thing. Understanding what it tells you about your customers is another.
Customer analytics and segmentation help businesses move beyond total customer counts to understand who their customers are, how they behave, what they buy, and how they contribute to business growth.
A Customer Analytics & Segmentation Report helps answer questions such as:
- Who are our most valuable customers?
- What percentage of our customers are repeat buyers?
- Which customer segments generate the most revenue?
- Are we retaining customers, or are we losing them over time?
- Which customers are likely to return, and which may be at risk of leaving?
- What opportunities exist to improve customer retention, loyalty, and sales?
These insights help businesses identify valuable customer segments, personalize marketing efforts, strengthen customer relationships, and make better decisions about where to focus their resources.
The goal isn't just to understand who your customers are, but to understand their value, behavior, and potential for future growth.
1
154


Data Analyst | SQL, Python, Excel, and Power BI Expert.
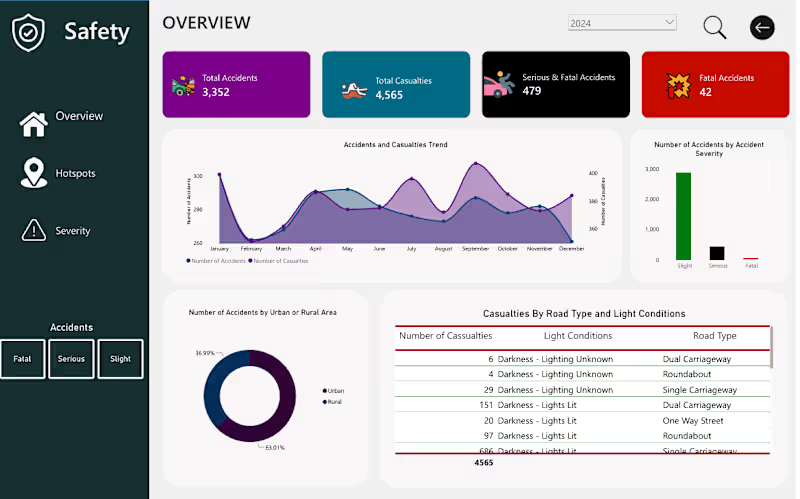
Road Safety Analysis | Python, SQL & Power BI
Developed an end-to-end road safety analytics project to help authorities understand accident patterns, identify high-risk areas, and make informed decisions about road safety interventions.
The project involved cleaning and preparing road accident data using Python and Pandas, followed by SQL-based exploratory analysis to investigate accident trends, casualty figures, severity distributions, and geographical patterns.
Using Power BI, I transformed the findings into an interactive dashboard featuring key performance indicators and visualisations that provide an overview of accident activity, highlight trends over time, and reveal differences in accident occurrence across districts and locations.
The analysis also explored accident severity in relation to road types, weather conditions, lighting, and road surface conditions.
Tools used: Python, Pandas, SQL, Power BI.
Project deliverable: An interactive Power BI dashboard supported by data cleaning, transformation, and SQL analysis.
The objective was to turn raw accident data into clear, meaningful insights that can support evidence-based road safety planning and resource prioritisation.
1
217
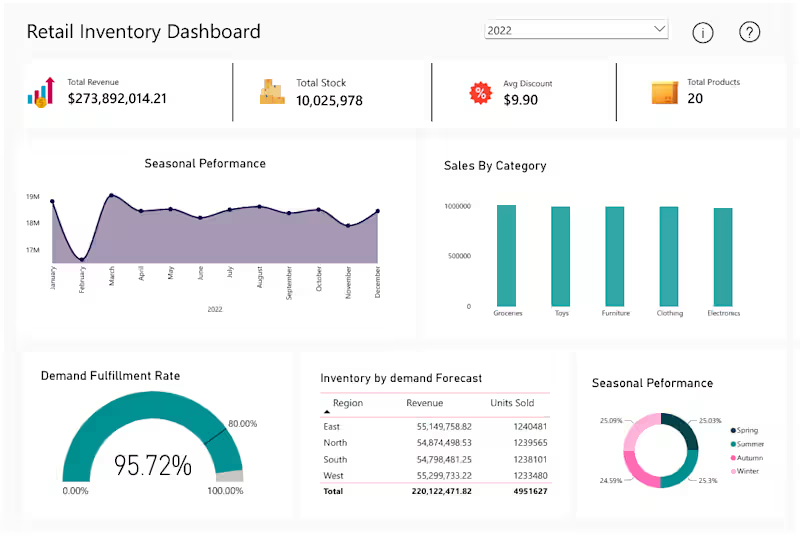
Retail Inventory and Sales Analysis
Retailers collect plenty of sales and inventory data, but turning it into useful decisions about stock, demand, and revenue isn't always straightforward. I built this project to bring those numbers together in one interactive Power BI dashboard.
I used Python and Pandas to clean and prepare the data, handling missing values according to their business meaning, then used MySQL to analyze sales, inventory, discounts, product categories, regions, and seasonal trends.
The dashboard brings together key metrics such as revenue, total stock, demand fulfillment, number of products, and average discount. It also shows sales by category, monthly trends, regional performance, inventory against demand forecasts, and seasonal patterns.
One of the key findings was a 95.72% demand fulfillment rate. The analysis also showed relatively balanced sales across the five product categories and similar performance across the four seasons. These insights help highlight sales trends and areas where inventory and demand may need closer attention.
The screenshot shows the dashboard overview, with the complete project available on GitHub.
1
304
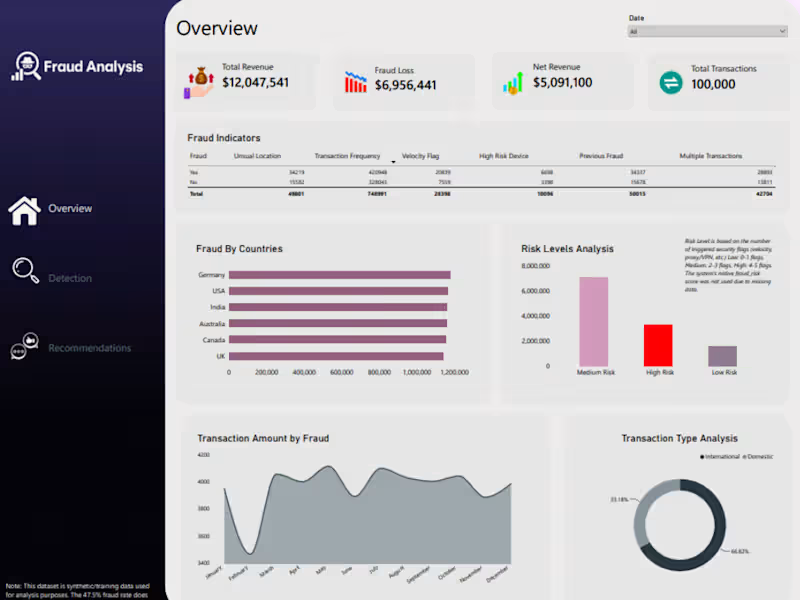
Retail Fraud Analysis
Retail businesses need to detect fraud without unnecessarily flagging legitimate transactions. I built this project using 100,000 retail transactions to explore fraud patterns and identify where financial risk was concentrated.
During data exploration, I found that the original fraud-risk score was stuck at 0.0 across all records, while two location fields contained duplicate information. Rather than inventing a score, I created transparent Low, Medium, and High risk classifications using available security indicators, including transaction velocity, proxy/VPN usage, and high-risk devices.
I used SQL to clean and prepare the data, then built an interactive Power BI dashboard covering the overall picture, fraud detection, and recommendations.
One key finding was that medium-risk transactions represented approximately $7.1 million in financial exposure, compared with $3.3 million for high-risk transactions. The analysis also showed that fraud activity was concentrated in lower transaction-value brackets.
The overview below shows the project, while the full analysis is available on GitHub.
1
279
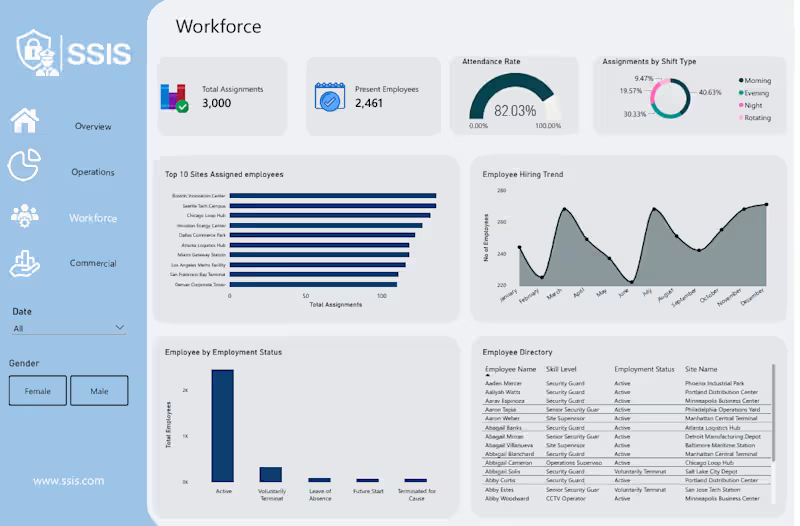
Security Support Information System
This project focuses on improving operational visibility and decision-making in the private security industry. I built an end-to-end Business Intelligence solution using Python for data cleaning and transformation, MySQL for database design and data management, and Power BI for the dashboards.
The final solution brings everything together in four dashboards: Executive Overview, Workforce Analytics, Operations Analytics, and Commercial Analytics.
1
289

Delivering Strategic Growth Through Data, Finance & Tech.
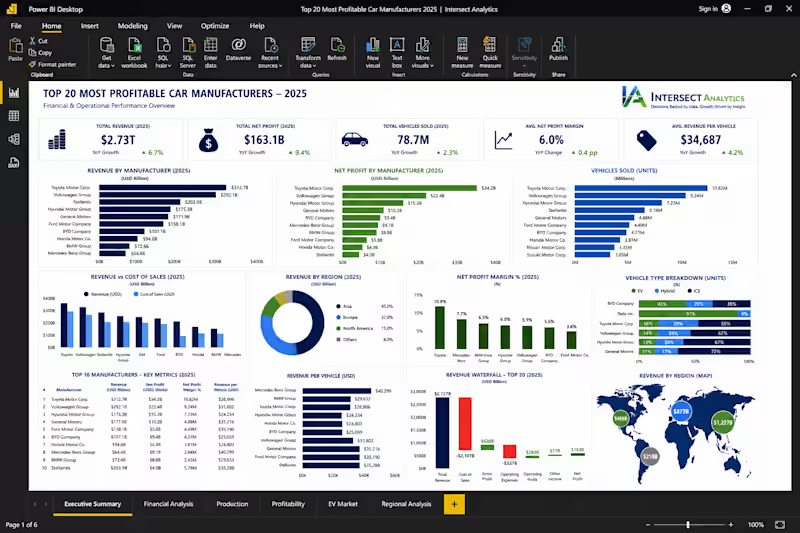
🚗 Executive Automotive Industry Intelligence — Powered by Power BI
How do the world's leading automotive manufacturers compare when it comes to revenue, profitability, production, and market performance?
At Intersect Analytics, we developed this executive Power BI dashboard to transform complex automotive industry data into a single source of truth for strategic decision-making.
📊 Executive Insights
Our analysis revealed several key industry trends:
🏆 Toyota Motor Corporation continues to lead the global automotive market, generating the highest revenue while maintaining exceptional profitability and vehicle production volumes.
📈 Volkswagen Group remains one of the strongest global competitors, demonstrating consistent revenue growth and a diversified international market presence.
⚡ BYD has emerged as one of the fastest-growing manufacturers, driven by rapid expansion in electric vehicle production and increasing global demand.
💰 While several manufacturers generate significant revenue, profit margins vary considerably, highlighting differences in operational efficiency, manufacturing costs, and pricing strategies.
🌍 Asian manufacturers continue to dominate the global automotive industry, contributing the largest share of revenue and vehicle production compared to Europe and North America.
🚘 The transition toward electric and hybrid vehicles is reshaping the competitive landscape, with manufacturers investing heavily in next-generation mobility technologies.
📉 Comparing Revenue against Cost of Sales reveals that companies with stronger cost control consistently deliver higher profitability despite operating in the same competitive environment.
📊 Revenue per vehicle varies significantly across manufacturers, reflecting differences in brand positioning, product mix, and premium versus mass-market strategies.
What This Dashboard Delivers
✔ Executive KPI Scorecards
✔ Revenue & Profitability Benchmarking
✔ Global Vehicle Sales Analysis
✔ Regional Performance Comparison
✔ Revenue vs Cost Analysis
✔ Net Profit Margin Analysis
✔ EV, Hybrid & ICE Market Breakdown
✔ Interactive Geographic Performance Mapping
✔ Executive-ready Multi-page Reporting
Our Services
At Intersect Analytics, we help organizations transform raw business data into executive intelligence through:
✅ Power BI Dashboard Development
✅ Financial Analytics & Executive Reporting
✅ Business Intelligence Solutions
✅ Excel & Google Sheets Automation
✅ SQL Data Modeling & ETL
✅ Power Query & DAX Optimization
✅ KPI Scorecards & Performance Monitoring
✅ Predictive Analytics & Decision Support
Every dashboard we build is designed to help leaders move beyond reporting—to uncover trends, optimize performance, and make confident, data-driven decisions.
📊 Decisions Backed by Data. Growth Driven by Insight.
If your organization is ready to unlock the full potential of its data, let's build a solution tailored to your business.
0
64
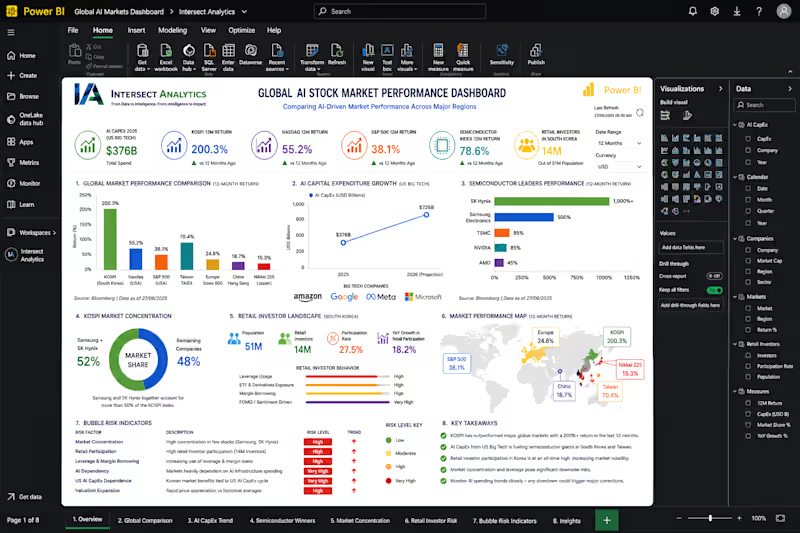
📊 GLOBAL AI STOCK MARKET PERFORMANCE DASHBOARD
Artificial Intelligence is no longer influencing individual companies alone — it is reshaping entire financial markets.
At Intersect Analytics, we developed this interactive Global AI Stock Market Performance Dashboard to analyze how AI investment is driving market performance across the United States, South Korea, Taiwan, Europe, China, and Japan.
Our analysis highlights several key findings:
✅ South Korea's KOSPI significantly outperformed many major global markets, driven largely by AI-related semiconductor companies.
✅ Massive AI capital expenditure by major US technology companies continues to fuel global semiconductor demand.
✅ Market concentration risk is increasing, with a small number of companies accounting for a significant share of market performance.
✅ Retail investor participation has reached historic levels in some markets, increasing both opportunity and risk.
✅ AI infrastructure spending is becoming one of the strongest drivers of global equity markets.
How We Built This Solution
This dashboard was developed using a complete Business Intelligence workflow:
• Data collection and market research
• Data transformation and modeling
• Power Query data preparation
• DAX calculations and performance measures
• KPI development and financial analysis
• Geographic and market visualization
• Risk assessment and investment analysis
• Executive dashboard design in Power BI
Services Delivered by Intersect Analytics
📈 Power BI Dashboard Development
📊 Financial & Market Analytics
🤖 Business Intelligence Solutions
⚙️ Data Modeling & Automation
📉 Executive Reporting & KPI Design
🗄️ Power Query & DAX Optimization
🌍 Economic & Market Intelligence Dashboards
☁️ Data Integration & Analytics Infrastructure
At Intersect Analytics, we help businesses, investors, and organizations transform complex data into clear insights that support better decisions.
DECISIONS BACKED BY DATA.
GROWTH DRIVEN BY INSIGHT.
#PowerBI #BusinessIntelligence #DataAnalytics #FinancialAnalytics #ArtificialIntelligence #StockMarket #DashboardDesign #DataVisualization #InvestmentAnalytics #BusinessGrowth
0
67
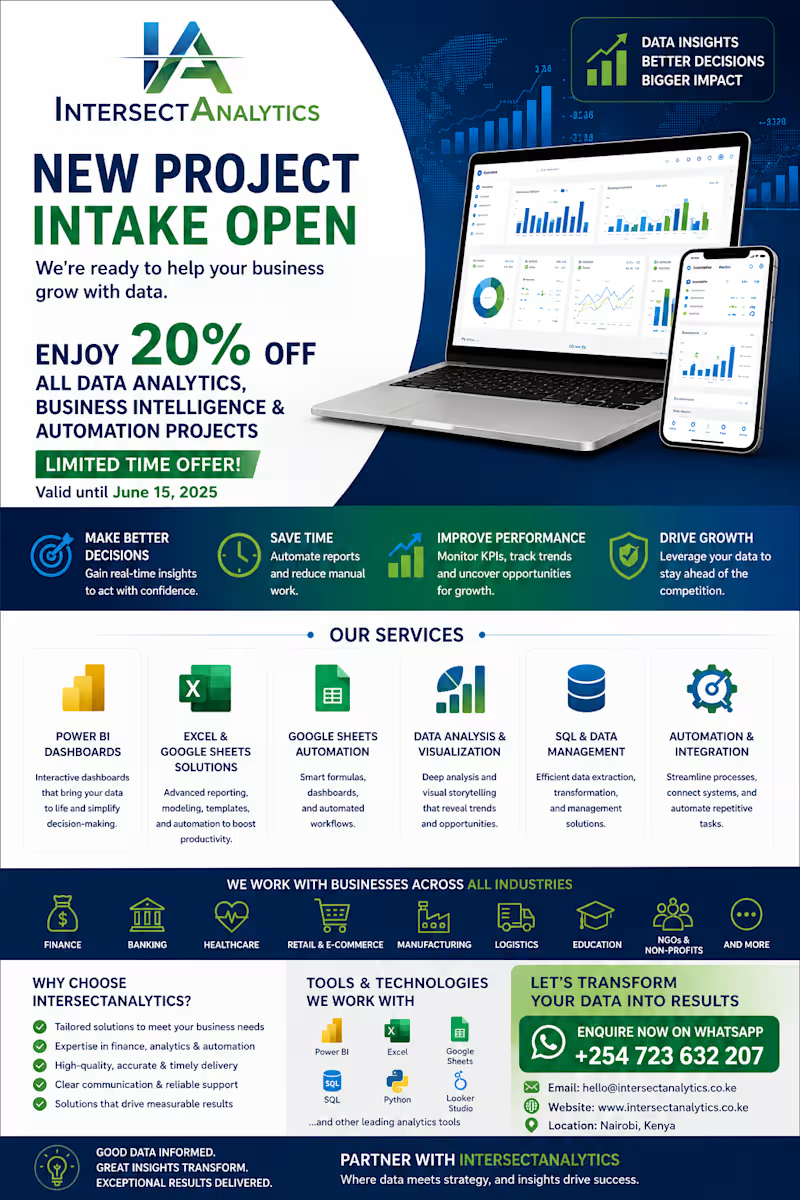
🚀 NEW PROJECT INTAKE OPEN | 20% OFF UNTIL JUNE 15
Every business generates data. The difference between industry leaders and everyone else is what they do with it.
At Intersect Analytics, we help organizations save time, eliminate manual reporting, automate repetitive processes, and turn data into actionable business intelligence that drives growth.
Our services include:
📊 Power BI Dashboards & Business Intelligence
📈 Data Analytics & Visualization
⚙️ Excel & Google Sheets Automation
🐍 Python Data Extraction & Preparation
🗄️ SQL & Database Solutions
🔄 Business Process Automation
Whether your business is just beginning its analytics journey or already has reporting systems in place, we help unlock greater value through smarter automation, better insights, and more efficient decision-making.
✅ Reduce reporting time
✅ Improve operational efficiency
✅ Monitor KPIs in real time
✅ Make faster, data-driven decisions
✅ Focus more time on growth and strategy
🎉 Enjoy 20% OFF all Data Analytics, Business Intelligence, and Automation projects until June 15.
📱 WhatsApp: +254 723 632 207
INTERSECT ANALYTICS
Decisions Backed by Data. Growth Driven by Insight.
0
58
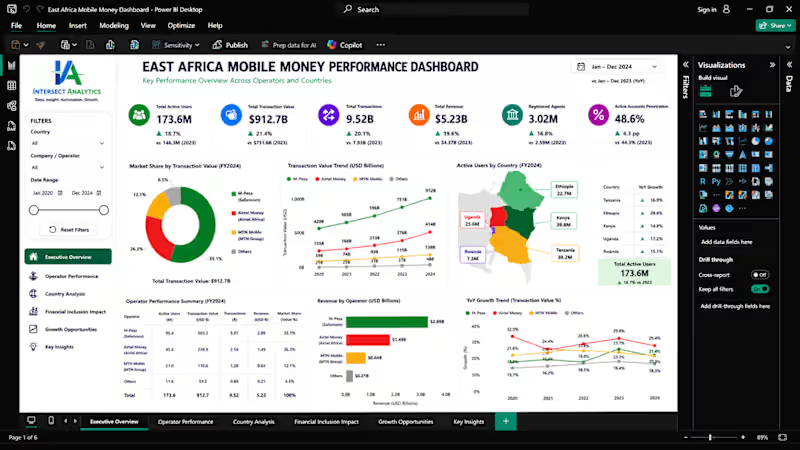
East Africa Mobile Money Performance Analysis Dashboard
Prepared by Intersect Analytics | Power BI, Data Analytics & Business Intelligence
Mobile money continues to reshape financial inclusion, digital payments, and economic activity across East Africa. To evaluate the performance of the region's leading operators, Intersect Analytics developed an executive-level Power BI dashboard analyzing transaction activity, user adoption, market share, and growth trends across key markets.
Key Findings
M-Pesa Maintains Regional Leadership
M-Pesa remains the dominant mobile money platform, leading in transaction volumes, active users, and market penetration. Its extensive ecosystem continues to strengthen its competitive position across the region.
Airtel Money Continues to Gain Momentum
Airtel Money has demonstrated strong growth, driven by increasing customer adoption, expanding service offerings, and rising transaction activity across multiple markets.
Digital Financial Services Are Experiencing Sustained Growth
The continued increase in mobile money usage highlights the growing importance of digital financial services in facilitating payments, commerce, savings, remittances, and financial accessibility.
East Africa Remains a High-Growth Market
Kenya, Uganda, Tanzania, Rwanda, and Ethiopia continue to present significant opportunities for financial institutions, fintech companies, investors, and businesses operating within the digital payments ecosystem.
Development Approach
Data was collected from industry publications, operator reports, and financial inclusion research.
Python was utilized for data extraction, cleaning, validation, and preparation using:
• Pandas
• NumPy
• Requests
• BeautifulSoup
• OpenPyXL
The final solution was developed in Power BI using Power Query, Data Modeling, DAX, and interactive visualizations to deliver clear, actionable insights for decision-makers.
Our Services
📊 Power BI Dashboards & Business Intelligence
📈 Financial Analysis & Performance Reporting
🐍 Data Scraping, Cleaning & Preparation
⚙️ Excel & Google Sheets Automation
🗄️ SQL & Database Analytics
🔄 Business Process Automation
Why Organizations Choose Intersect Analytics
We help organizations transform complex data into meaningful business intelligence by combining analytics, automation, and reporting expertise. Our solutions are designed to reduce manual effort, improve operational efficiency, accelerate decision-making, and provide the visibility required to support sustainable growth.
INTERSECT ANALYTICS
Power BI | Business Intelligence | Data Analytics | Automation | Financial Analysis
Decisions Backed by Data. Growth Driven by Insight.
📞 +254 723 632 207
5
138

Data Analyst | Data Engineer
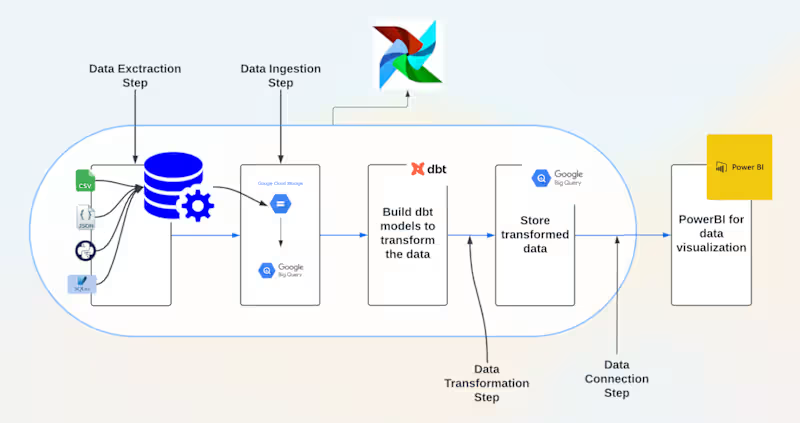
View more →

Data Analyst provided data driven decisions to stakeholders.


Web Designer | UI/UX Designer| Graphic Designer |
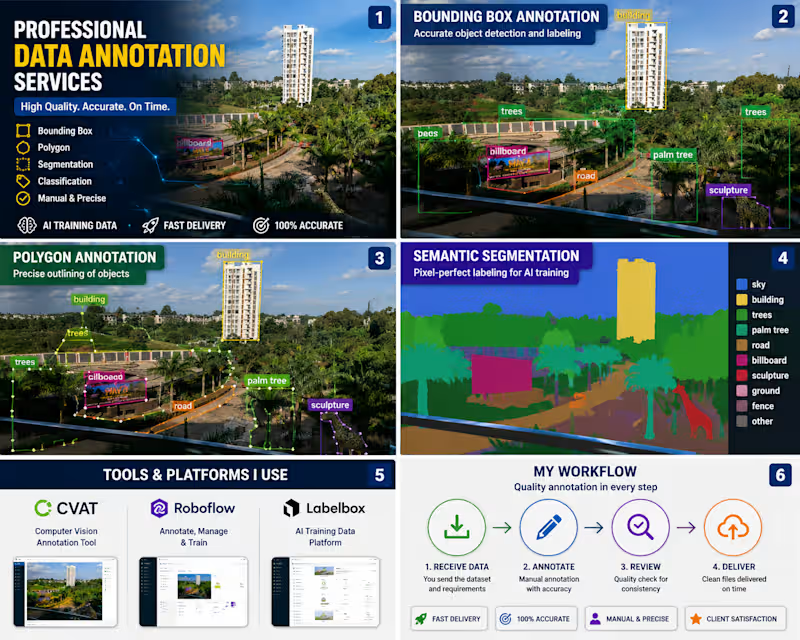
Q. How do you ensure annotation quality?
A. Every dataset is reviewed for accuracy and consistency before delivery, following your labeling guidelines.
1
93
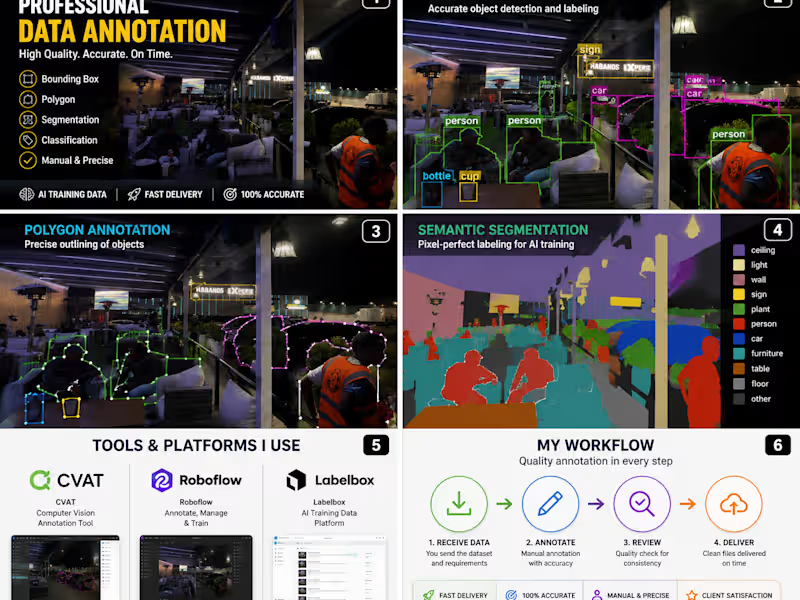
🚀 Excited to Continue Growing in AI Data Annotation & Quality Assurance
Over the past months, I’ve had the opportunity to work on various data annotation and quality assurance projects involving image and video datasets. Using tools such as CVAT and Labelbox, I’ve gained valuable experience in bounding boxes, object tracking, segmentation, data validation, and annotation review.
Working on AI training datasets has strengthened my attention to detail, problem-solving abilities, and commitment to delivering high-quality results. Every project provides a new opportunity to learn and contribute to the development of more accurate and reliable AI systems.
I’m always interested in connecting with professionals in AI, machine learning, computer vision, and data annotation. Feel free to reach out if you’d like to connect, collaborate, or discuss opportunities in this exciting field.
#AI #DataAnnotation #QualityAssurance #ComputerVision #MachineLearning #CVAT #Labelbox #ArtificialIntelligence #DataLabeling #RemoteWork
0
67
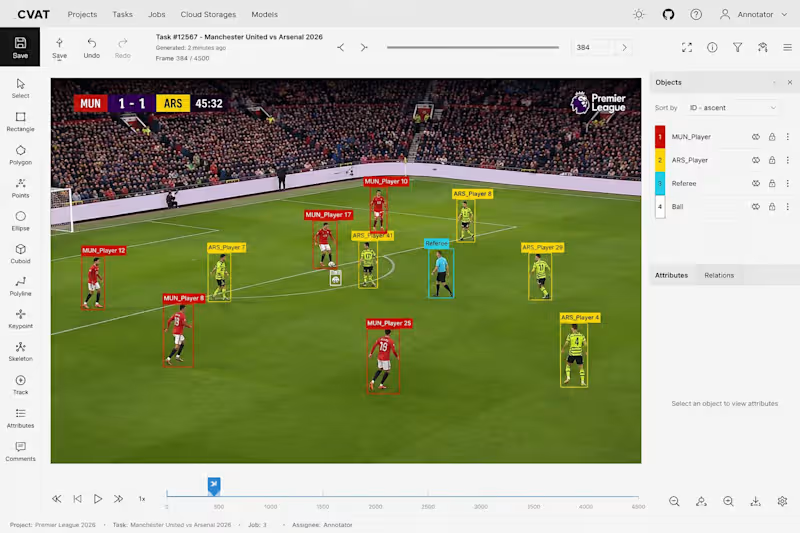
Project: Football Video Annotation and Quality Assurance✅ Reviewing annotations to ensure consistency and compliance with project guidelines ✅ Identifying and correcting labeling errors
✅ Maintaining high-quality standards across large video datasets
✅ Supporting the development of computer vision models through reliable training data
Projects like this continue to strengthen my expertise in data annotation, quality assurance, and AI training workflows. It is rewarding to contribute to datasets that help improve the performance of machine learning and computer vision systems.
I’m always open to connecting with professionals and organizations working in AI, computer vision, data annotation, and quality assurance.
0
138
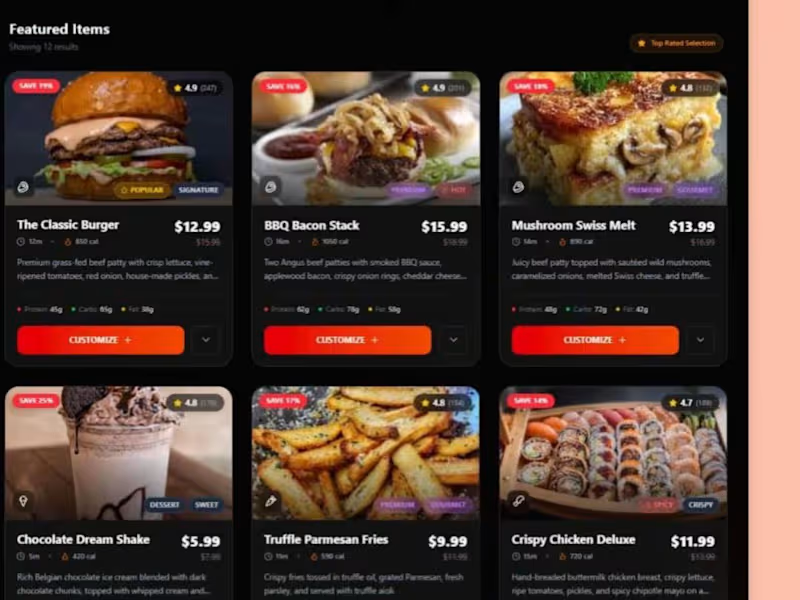
Created a full e-commerce website UI design for Burger Hub, a premium burger restaurant. The project included a homepage, featured menu, about/story page, contact page and footer. Designed in Figma with a bold dark theme, red accents and modern food e-commerce layout."
Skills to tag:
Website Design
UI/UX Design
Figma
E-Commerce Design
Restaurant Website
0
94

Decoding data patterns to reveal actionable business stories
Decoding data patterns to reveal actionable business stories
View more →

Experienced Data Engineer
Experienced Data Engineer


View more →