Retail Inventory and Sales Analysis Retailers

View completed workgithub.com
Retail Inventory and Sales Analysis
Retailers collect plenty of sales and inventory data, but turning it into useful decisions about stock, demand, and revenue isn't always straightforward. I built this project to bring those numbers together in one interactive Power BI dashboard.
I used Python and Pandas to clean and prepare the data, handling missing values according to their business meaning, then used MySQL to analyze sales, inventory, discounts, product categories, regions, and seasonal trends.
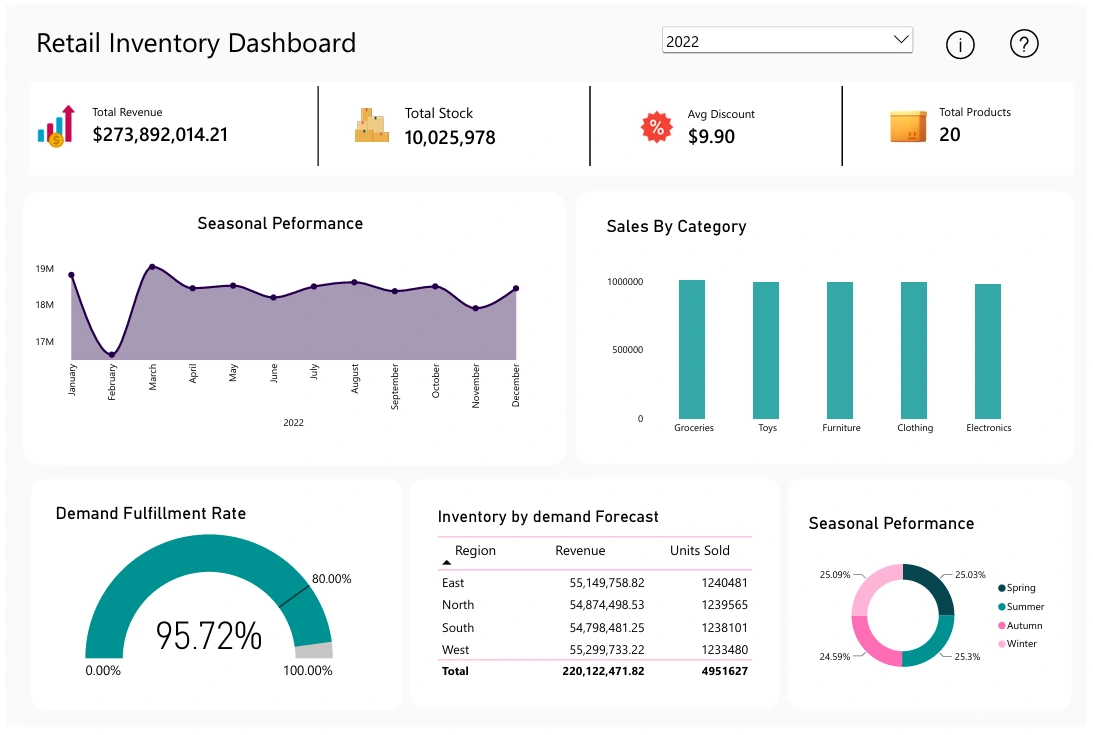
The dashboard brings together key metrics such as revenue, total stock, demand fulfillment, number of products, and average discount. It also shows sales by category, monthly trends, regional performance, inventory against demand forecasts, and seasonal patterns.
One of the key findings was a 95.72% demand fulfillment rate. The analysis also showed relatively balanced sales across the five product categories and similar performance across the four seasons. These insights help highlight sales trends and areas where inventory and demand may need closer attention.
The screenshot shows the dashboard overview, with the complete project available on GitHub.
0 likes · 0 views · Oct 23, 2026
Retail Inventory and Sales Analysis Retailers collect plenty of sales and inventory data, but turning it into useful decisions about stock, demand, and reven...