
Fraud Analysis
An end-to-end fraud analytics project — cleaning 100,000 raw retail transaction records in SQL, then building an interactive 3-page Power BI dashboard to identify fraud patterns, assess risk exposure, and support fraud monitoring decisions.
The Problem
Retail businesses lose money through fraudulent transactions and ineffective fraud monitoring. This project focuses on identifying where fraud occurs, understanding the indicators associated with suspicious transactions, and translating the findings into practical recommendations for risk management.
Data Cleaning (SQL)
The raw dataset required several cleaning and preparation steps before analysis:
Removed duplicate transaction records
Standardized inconsistent formatting across fields
Identified and handled nulls/blanks in key columns
Full script: Fraud Queries.sql
Data Quality Issues Found
Two important data quality issues were identified during profiling:
The dataset's native fraud_risk score field was completely corrupted — flatlined at 0.0 across all 100,000 records, making it unsuitable for analysis.
is_international and unusual_location_flag were found to contain duplicate information, so only one was retained to avoid redundant reporting.
Rather than creating or simulating a risk score, a transparent Risk Level classification was built from the number of legitimate security flags triggered by each transaction:
Low Risk: 0–1 flags triggered
Medium Risk: 2–3 flags triggered
High Risk: 4–5 flags triggered
The methodology is disclosed directly on the dashboard so that the classification is not mistaken for an original dataset field.
This is a synthetic/training dataset with a fraud rate of approximately 47.5%, so the results should not be interpreted as representative of real-world fraud levels.
Dashboard Pages
1. Overview
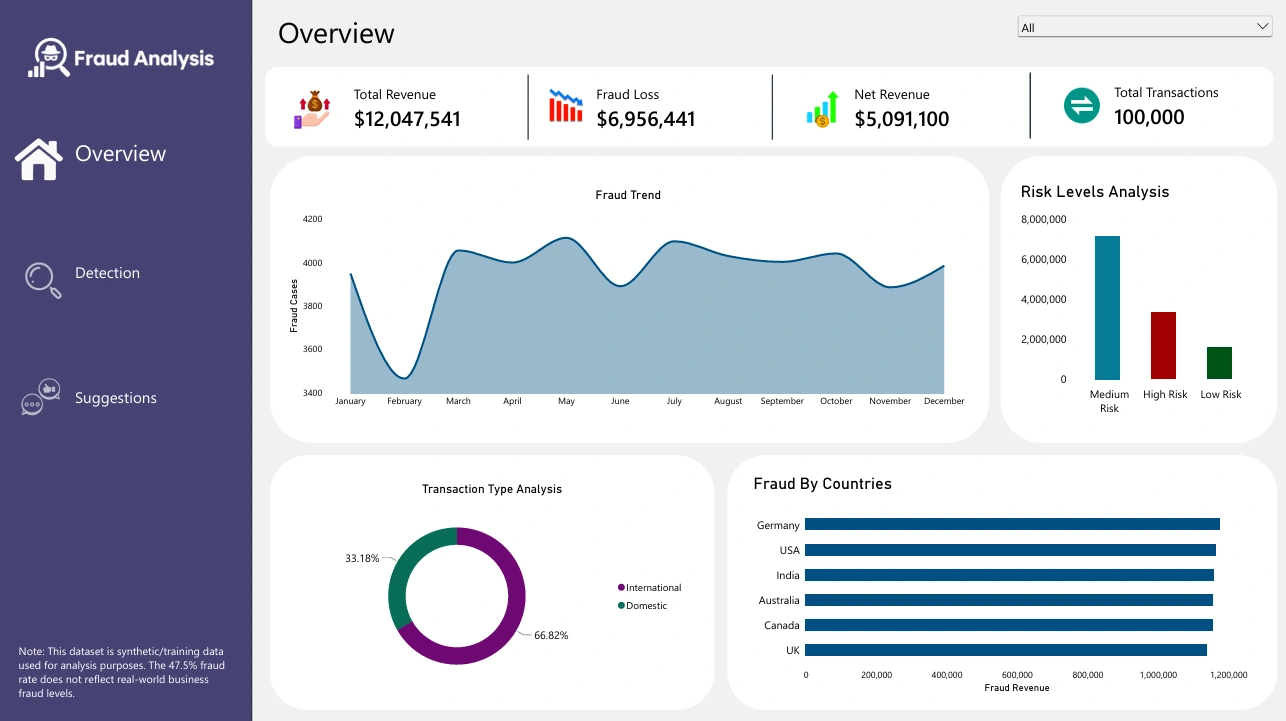
The Overview page provides an executive-level view of the fraud landscape through:
Total Revenue
Fraud Loss
Net Revenue
Total Transactions
Fraud Indicators
Fraud by Country
Risk Level Analysis
Transaction Amount by Fraud
Transaction Type Analysis
2. Detection
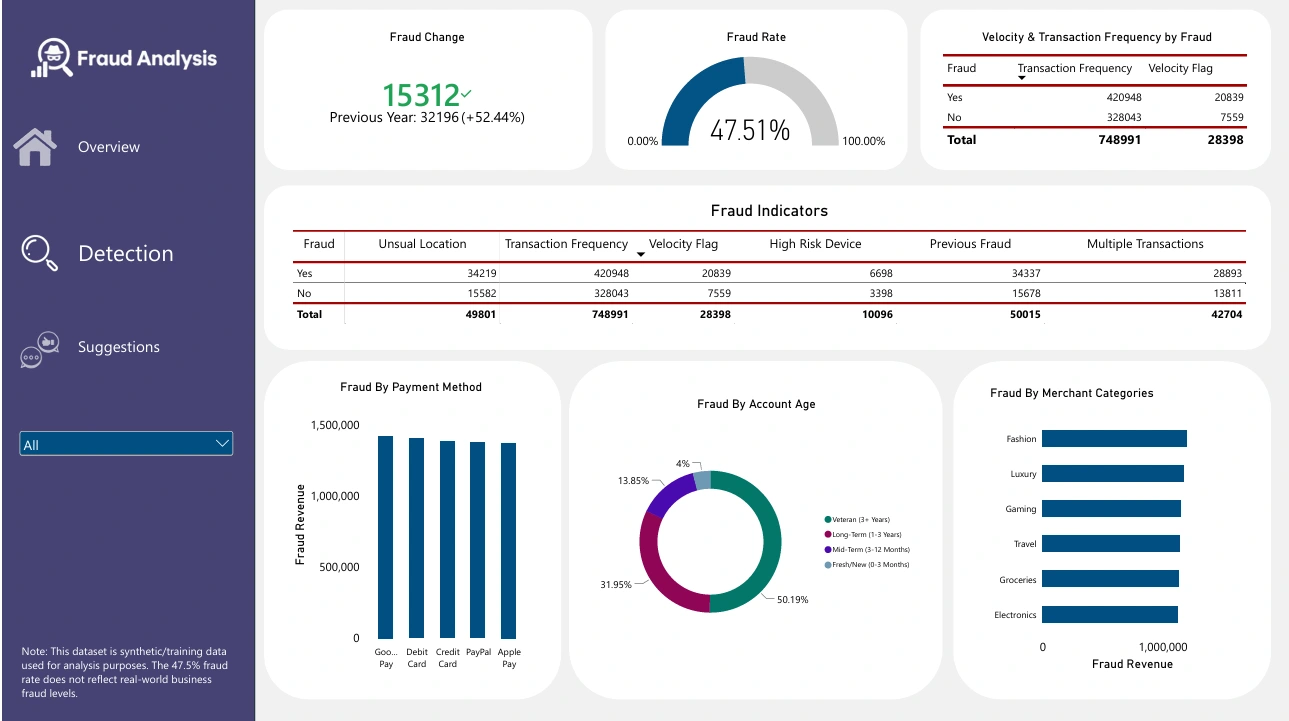
The Detection page focuses on deeper fraud-pattern analysis, including:
Transaction Frequency
Velocity Flags
Fraud Change
Fraud Rate
Fraud by Payment Method
Fraud by Merchant Category
Fraud by Account Age
3. Recommendations
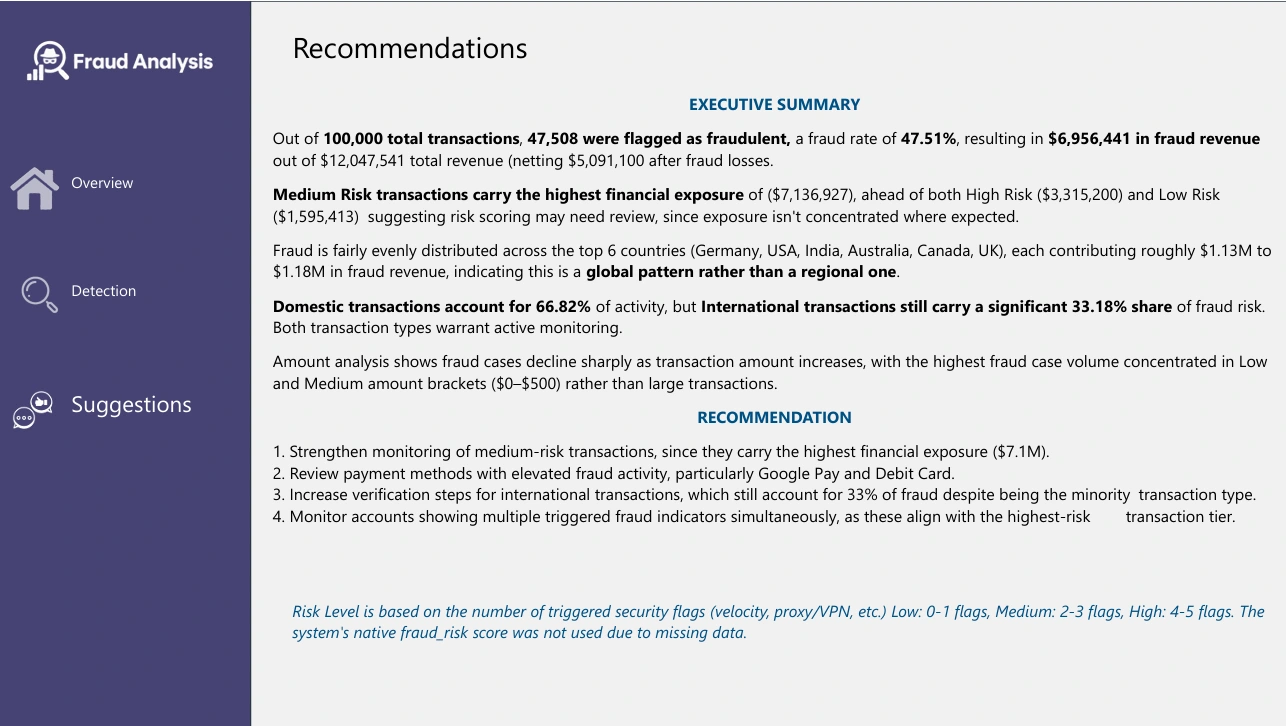
The Recommendations page summarizes the major findings from the analysis and translates them into practical fraud-monitoring actions.
Key Insights
Out of 100,000 total transactions, 47,508 were flagged as fraudulent, representing a fraud rate of 47.51%.
Total revenue was $12,047,541, with $6,956,441 identified as fraud loss and $5,091,100 remaining as net revenue after fraud losses.
Medium Risk transactions carried the highest financial exposure at approximately $7.1M, followed by High Risk at approximately $3.3M and Low Risk at approximately $1.6M.
Fraud revenue was distributed relatively evenly across the six countries shown — Germany, USA, India, Australia, Canada, and the UK — with each contributing roughly $1.13M–$1.18M.
Domestic transactions accounted for 66.82% of activity, while international transactions accounted for 33.18%.
Fraud cases declined as transaction amounts increased, with the highest concentration occurring in the lower transaction-value brackets ($0–$500).
The Detection dashboard highlights fraud patterns across payment methods, merchant categories, account age, transaction frequency, and velocity-related indicators.
Recommendations
Strengthen monitoring of medium-risk transactions, given their highest financial exposure.
Review payment methods showing higher levels of fraud activity, particularly Google Pay and Debit Card.
Increase verification controls for international transactions despite their smaller share of overall activity.
Monitor accounts triggering multiple fraud indicators simultaneously, as these combinations can provide stronger signals of suspicious activity.
Files in This Repo
Dataset — raw dataset
Fraud Queries.sql — SQL cleaning and analysis script
Power BI Dashboard — Power BI dashboard file
Screenshots of all 3 dashboard pages
Tools Used
SQL · Power Query · Power BI · DAX
1 like · 1 view · Oct 23, 2026
Cleaned and analyzed 100,000 retail transactions in SQL, then built a three-page Power BI dashboard to identify fraud patterns and recommend monitoring actions.

