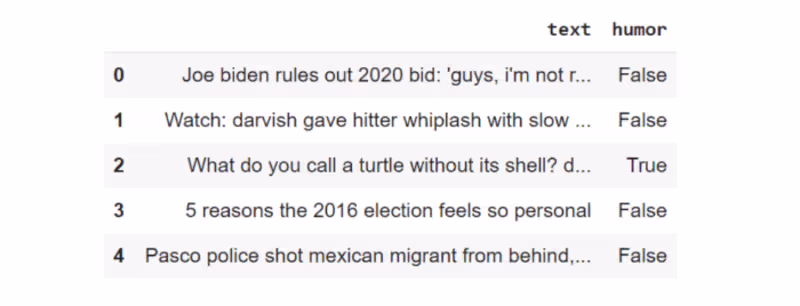
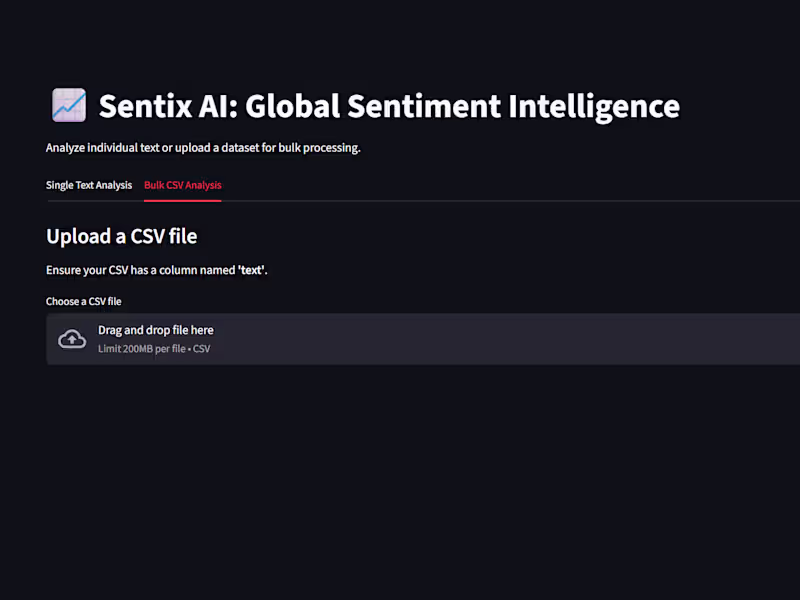
I build AI-powered data apps and dashboards
I build AI-powered data apps and dashboards
Data Scientist, Backend Engineer, Data Analyst


"ML Engineer | RAG Pipelines · LLM Fine-Tuning · RL
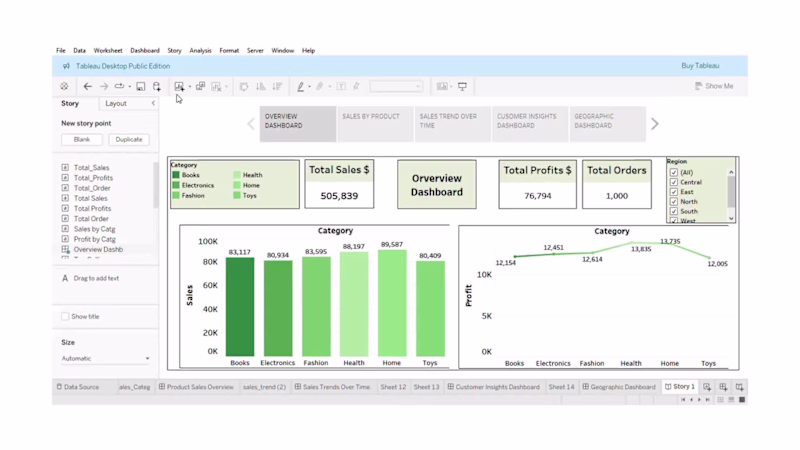
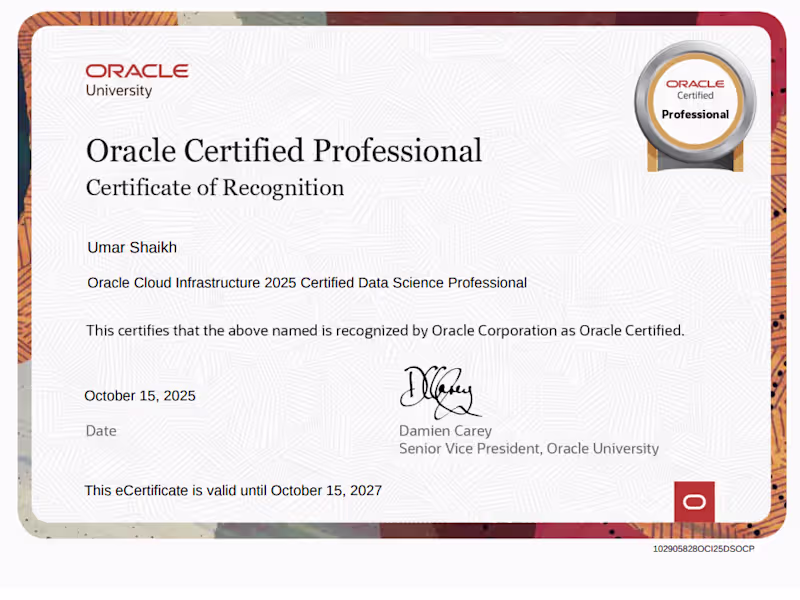
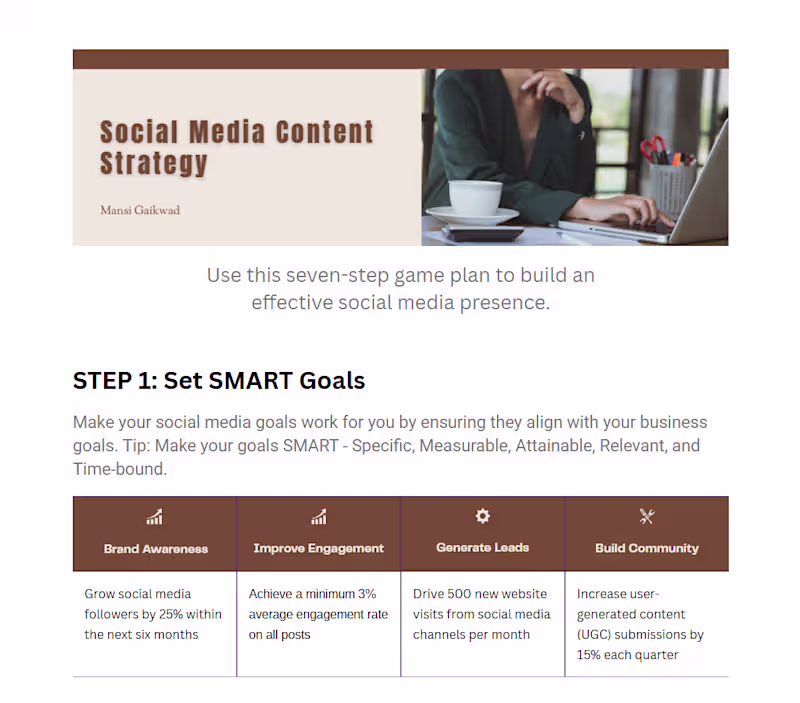
Data Analytics Professional
Data Analytics Professional

View more →
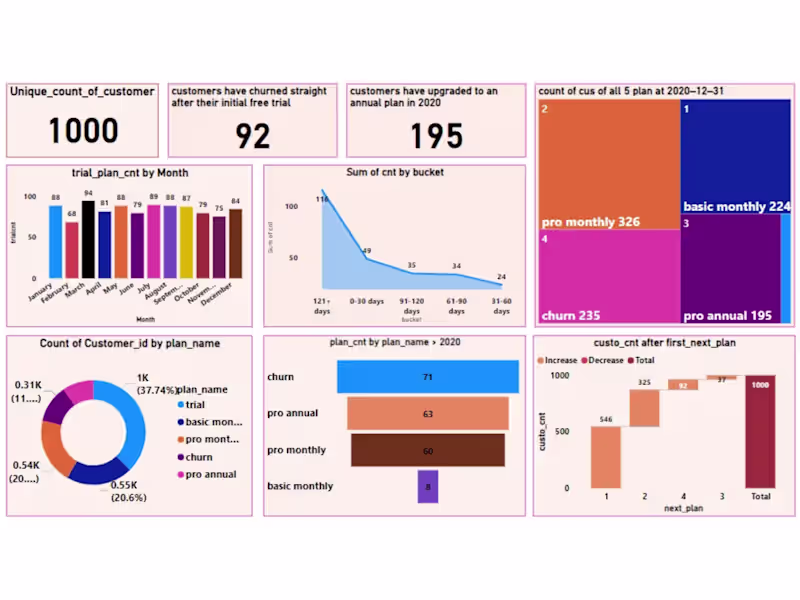
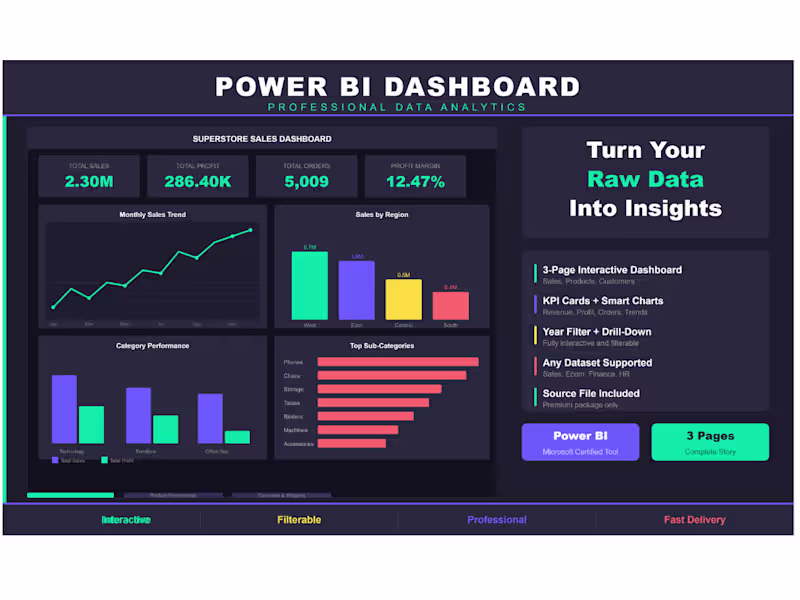
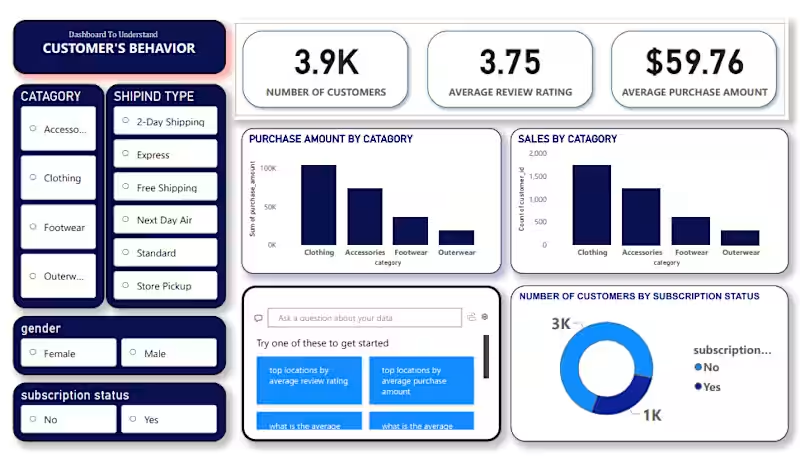
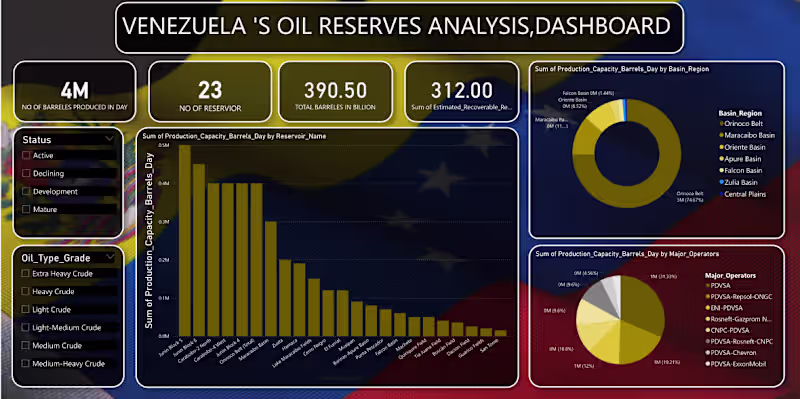
Power BI Expert | Turning Raw Data into Actionable Insights
New to Contra
Power BI Expert | Turning Raw Data into Actionable Insights
Web Developer | Responsive Design & UI/UX Specialist


Data Analyst / Data Scientist


View more →
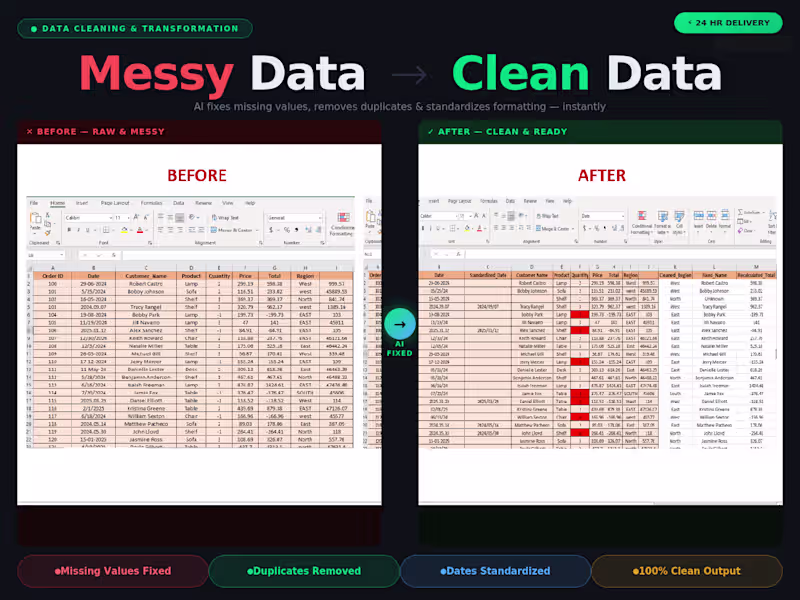
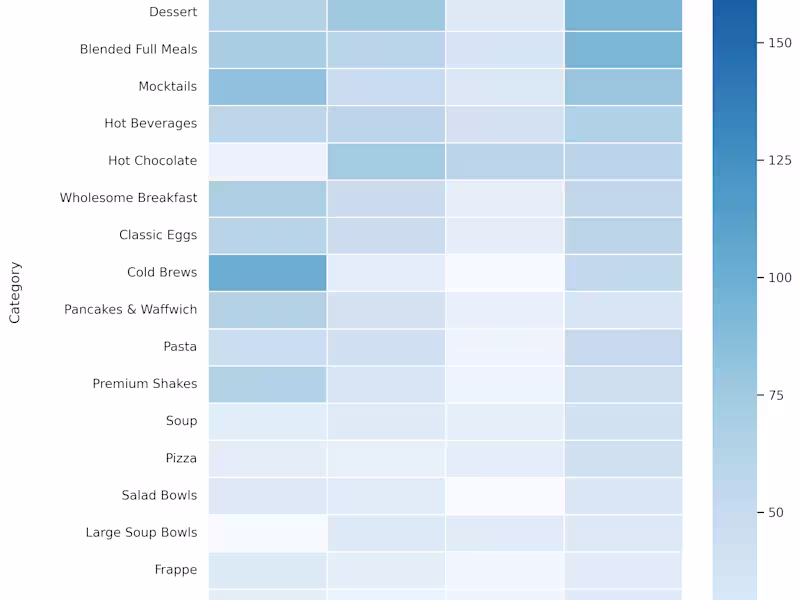
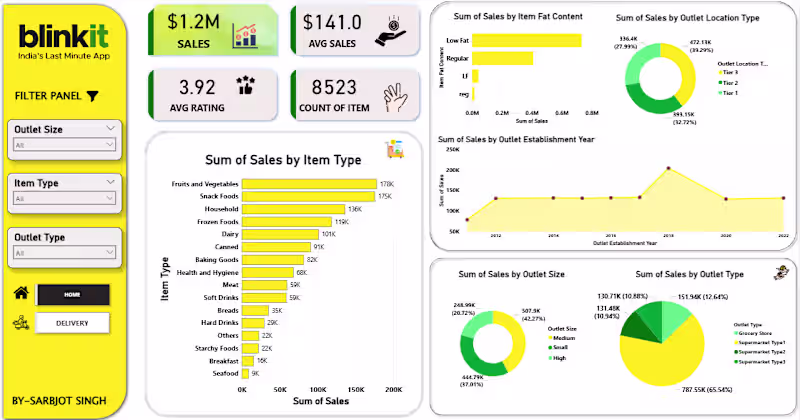
🔍 Transforming Data into Business Insights
🔍 Transforming Data into Business Insights