
Content Strategist | Research-Backed Growth| Architect
- 1x
- Hired
- 5.0
- Rating
- 37
- Followers
Content Strategist | Research-Backed Growth| Architect


Professional Accountant | Bookkeeping, Financial Reporting
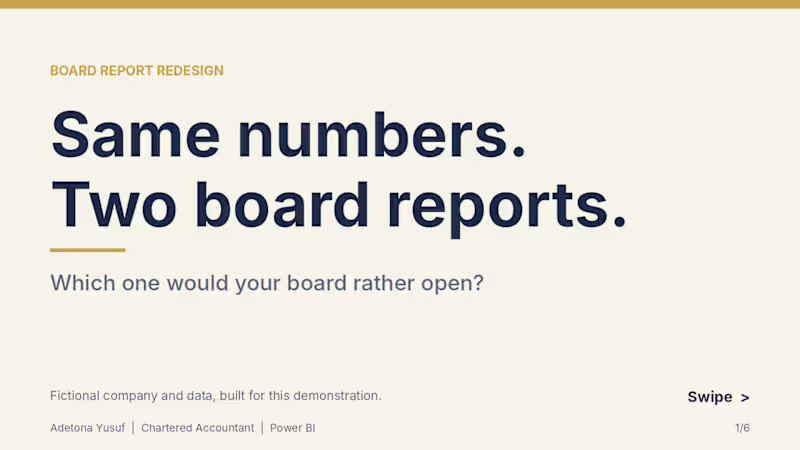
Project title: Board Report Redesign: Q3 Performance Pack (Power BI)
Same financial data, redesigned from a plain Word report into a one-page Power BI board view.
The problem
Board and management reports are often full of accurate numbers that nobody reads closely. Tables, long paragraphs and default charts make people hunt for the headline.
What I did
To show my approach, I built a fictional company’s Q3 board report two ways from the same Excel workbook: a typical plain Word version, and a redesigned one-page Power BI view.
What I changed
• Key figures (revenue, profit, closing cash, variance to budget) placed first
• A waterfall that takes cash from opening balance to closing cash
• Clear chart titles, with units where they apply
• One colour system applied across every visual
• All figures tie back to a single workbook, with DAX measures checked against it
Deliverables in this sample
• Plain “before” report (Word, 8 pages)
• Redesigned Power BI board view (PDF)
• Source workbook structure and a custom navy and gold theme
Note: The company, figures and report are fictional, created only to demonstrate my approach. No real client data is used.
What I can do for you
I design board packs, investor decks and monthly management reports for SMEs and finance teams, in Power BI and Excel. If your reports get skimmed instead of read, message me.
1
0
193

1M+ Row Migration ROI: SQL Server to PostgreSQL
I engineered a Python ETL pipeline to migrate legacy SQL Server data to PostgreSQL, prioritizing cost-efficiency and absolute integrity.
The Problem: High licensing costs and a need for cloud-scalability without risking the "Source of Truth."
The Outcomes:
🔹Savings: Projected 65% reduction in annual licensing fees
🔹Integrity: 1,055,008 rows reconciled with zero violations
🔹Audit: Flagged 24,000+ quality issues (negative prices, invalid emails) during the move
The Impact: Shifted from reactive maintenance to proactive cloud-scaling on AWS/Azure with a cleaner, more reliable database.
Why Me? As an Accountant & Data Engineer, I bring "ledger-style" reconciliation to architecture. I don’t just move data; I audit it.
Open for Migration contracts. Let’s cut your costs.
2
240

My latest build turns that chaos into a sleek, interactive Insurance Application Summary Dashboard built for speed, insight, and control.
Traditional reports hide insights behind endless spreadsheets.
This dashboard flips the script, it reveals the story instantly:
Clarity isn’t cosmetic, it’s profit.
Good reporting tells what happened.
Creative reporting shows where to act next.
By blending storytelling, interactivity, and business logic, this becomes a true decision engine for underwriting teams.
If approvals still take 75 days, your reporting is the bottleneck.
I build data products that turn chaos into profit-driving clarity.
Now open to projects merging data strategy + design + visualization for faster, smarter decisions.
📊 Explore the vision.
💬 DM to discuss your toughest data challenge.
1
208

Created a professional investor pitch deck for a customizable bedding business. I combined clean design, structured storytelling, and financial insight to communicate the company’s mission, market opportunity, traction, business model, customer profiles, and financial KPIs.
The deck includes premium slide layouts, branded color themes, clear charts, and subtle animations optimized for live presentations. Perfect for investor meetings, fundraising, and strategic presentations.
Below is the full project link
https://github.com/adetonayusuf/pitch-deck-for-a-start-up/tree/main
#pitchdecks #powerpoint #presentation #anythingappchallenge #rivechallenge #contraeverywhere
1
510

Product designer and No code Developer

Product & UI/UX Developer | Figma | Framer | Brand Designer


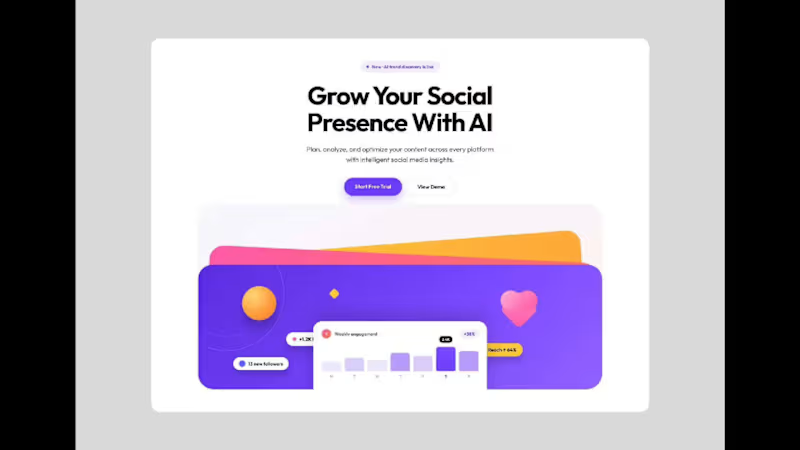
Gym & Fitness landing Page
This concept reimagines the gym experience in the digital era a platform where motivation meets design, and every workout feels empowering.
I designed a modern, high-energy landing page Ul that combines bold typography, powerful imagery, and a dynamic layout to reflect movement, strength, and determination. The interface emphasizes clarity and motivation, helping users explore classes, track progress, and stay inspired on their fitness journey.
To bring the experience to life, I integrated subtle motion effects and interactive elements that mirror the rhythm and intensity of a real workout.
The goal was to fuse fitness UI, modern aesthetics, and interactive design to create an immersive online gym experience that motivates users to push their limits anytime, anywhere.
Would love your feedback! Get reply within 10 Minutes!
Looking to build some great together??
GET IN TOUCH.....
1
4
239


Data Analyst, Product Analyst, Framer Designer
- 1x
- Hired
- 5.0
- Rating
- 12
- Followers
Data Analyst, Product Analyst, Framer Designer
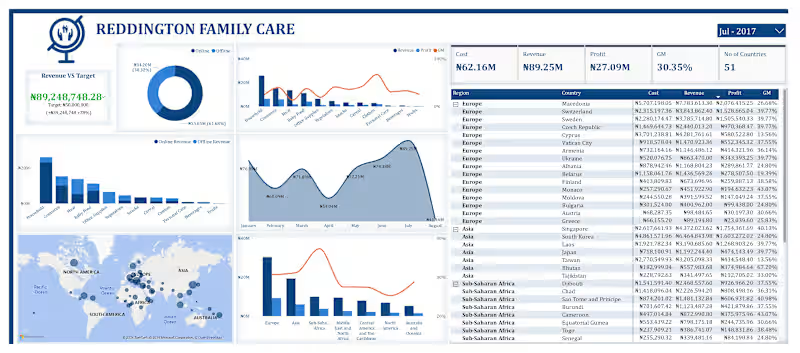

UI/UX Designer designing websites and apps that converts
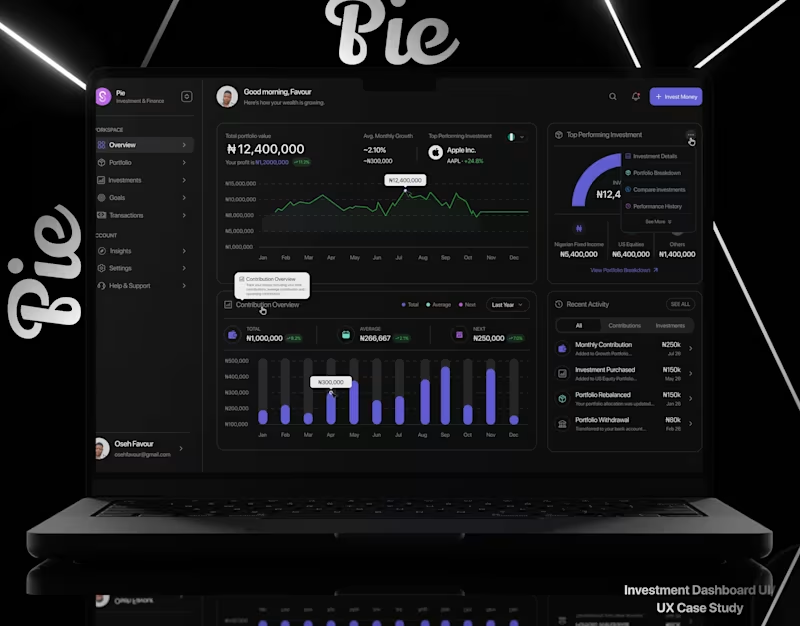

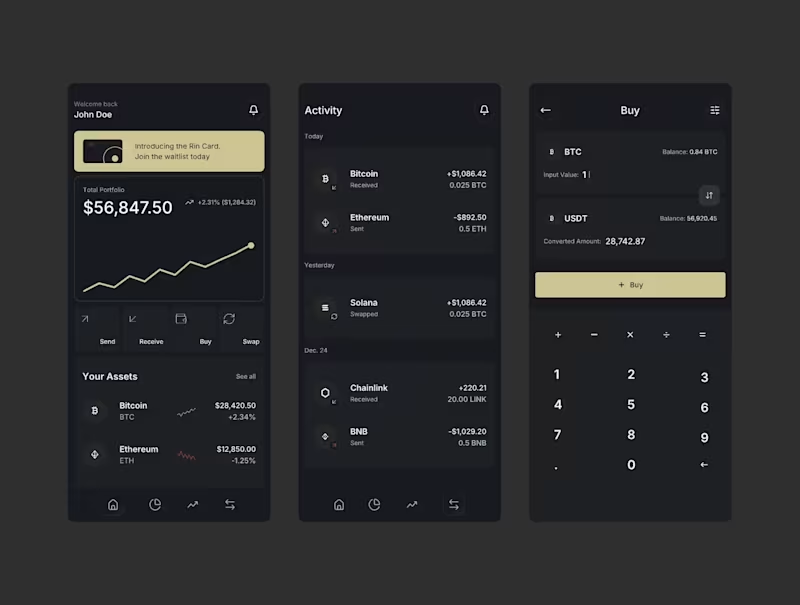
I designed the portfolio feature for a stock tracking app.
The main goal was simple:
Help users understand what they own, how much their portfolio is worth, and how it is performing without making the experience complicated.
The problem
Tracking different stocks can quickly become confusing.
Users may have several holdings, different amounts invested, different returns, and changing stock prices.
The challenge was to bring all of this information into one simple screen.
The solution
I designed the Portfolio screen around the information users need most.
The screen includes:
Portfolio value: shows the current total value of the portfolio.
Performance chart: helps users quickly see how the portfolio has changed over time.
Time filters: users can switch between 1D, 1W, 1M, 6M, YTD, 1Y, and MAX.
Today’s return: shows how the portfolio is performing today.
Total return: shows the overall gain or loss.
Invested amount: shows how much has been invested.
Holdings: gives users a clear list of the stocks in their portfolio.
Sorting: lets users organize holdings by value.
Design approach
I wanted the screen to feel clean, calm, and easy to understand.
Instead of showing too much information at once, I created a clear visual hierarchy:
Portfolio value → Performance → Key numbers → Holdings
This allows users to understand their portfolio at a glance and explore more details when they need them.
Important product decision
This is a stock tracking app, not a trading app.
The portfolio does not hold money, place trades, or give investment advice.
Users manually manage their portfolio so they can use the app to track their holdings and performance.
What I focused on
For this design, I focused on:
Clear information hierarchy
Simple data visualization
Easy-to-scan numbers
Clean spacing and typography
Useful portfolio insights
A simple way to browse holdings
Making complex financial information feel easy
The goal was not to make the screen look complicated.
The goal was to make complex information feel simple.
What do you think about this design?
4
3
283
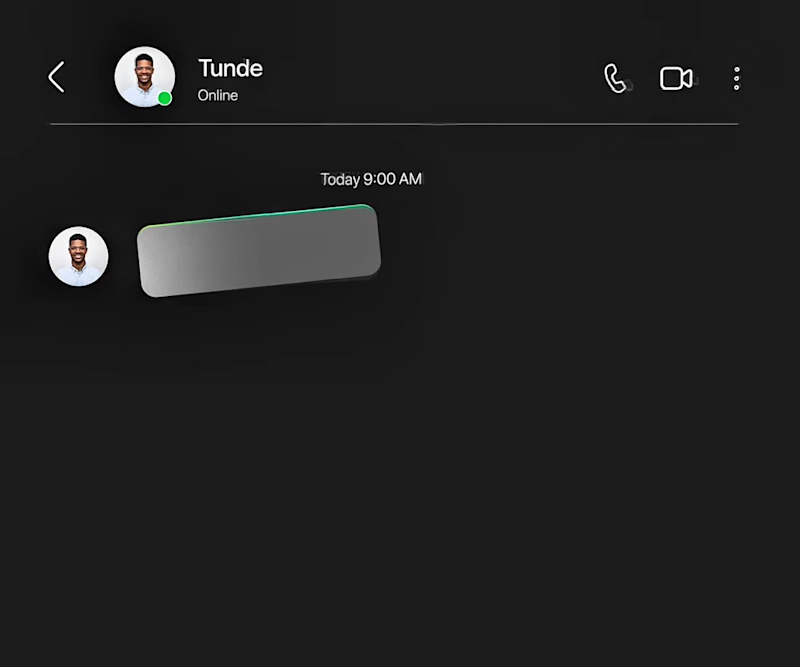
Created this indrive Ads using Figma motion.
Here’s the storyline: most people complain of high prices of ride, so I offered indrive as the solution.
with indrive, book your ride and agree on a comfortable price with your driver.
So basically, the problem is high ride prices and the solution is Indrive.
Good motion design is meant to identify the problem and offer a solution.
Started the design with the storyboard made up of up to 7 scenes and animated it.
What is good motion design to you?
2
3
90
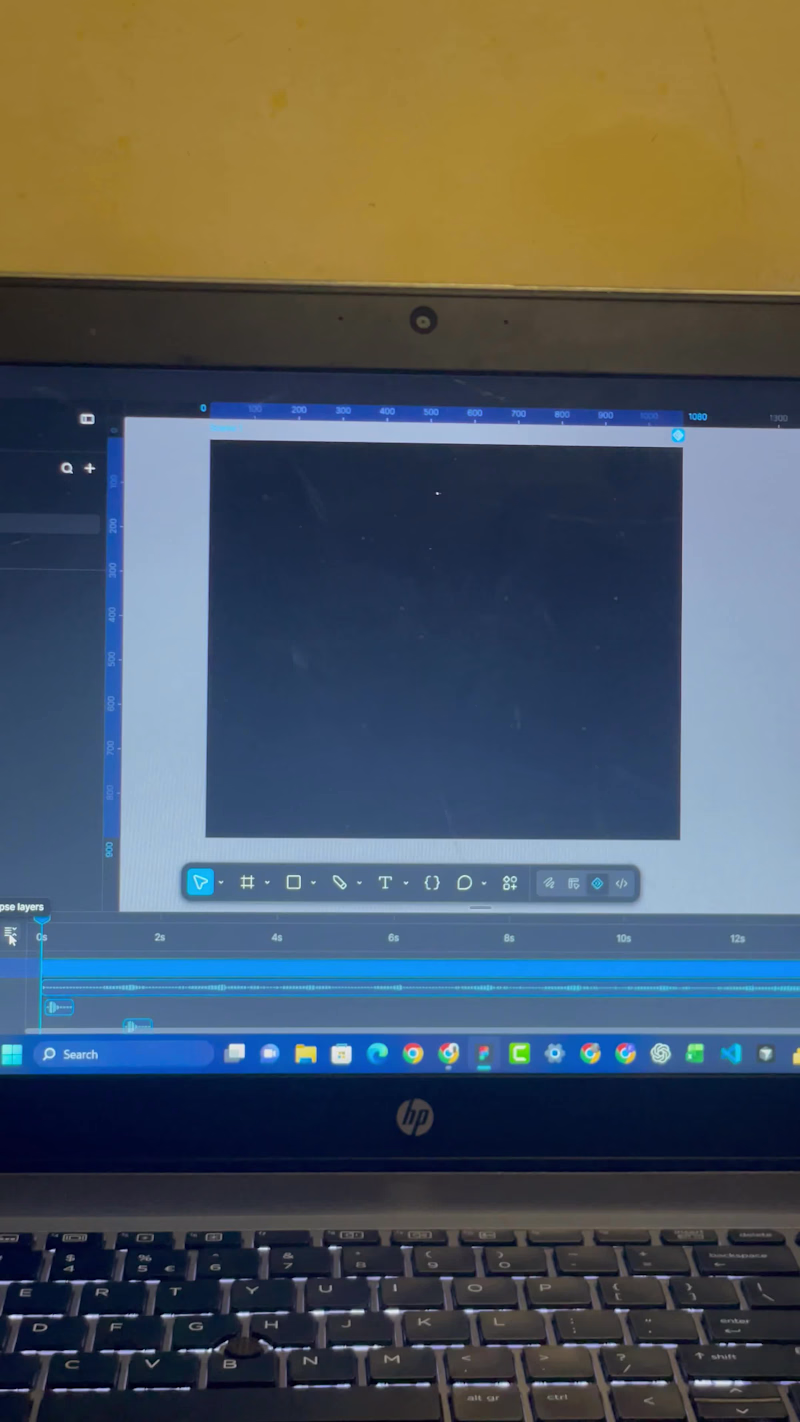

Transforming raw data into organized and actionable insights
Transforming raw data into organized and actionable insights


Data Analyst | Leveraging Data to uncover Insights.
Data Analyst | Leveraging Data to uncover Insights.


View more →